Primer on basic magnetic resonance physics
Images


Dr. Charagundla is currently Chief Radiology Resident at the Hospital of the University of Pennsylvania (HUP), Philadelphia, PA. He received a BS in Physics from the College of William and Mary, Williamsburg, VA. He completed a combined MD/PhD program at the University of Pennsylvania and received degrees from the School of Medicine and the Department of Biochemistry and Molecular Biophysics. He completed a preliminary year in Internal Medicine at Pennsylvania Hospital, Philadelphia, PA, before entering his residency. Dr. Charagundla will begin a Body MRI Fellowship at HUP upon completion of his residency.
Magnetization, precession, and the rotating frame
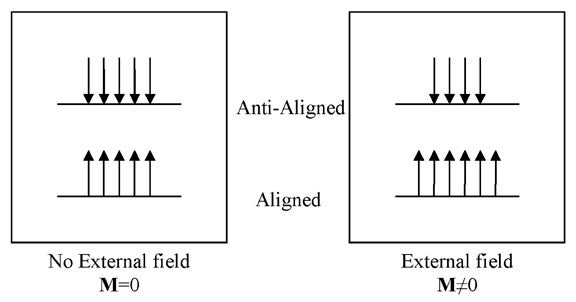
The signal used in biomedical MRI originates from the nucleus of the hydrogen atom (1H), which consists of a single proton. Protons have a spin, and when placed in a magnetic field, have a "preferred" orientation. When a population of protons is placed in a magnetic field, a few of the spins become aligned with the external magnetic field. The difference between the aligned and anti-aligned states generates a net magnetization, symbolized by the vector quantity M (Figure 1).2 It is important to remember that the magnetization M is, in fact, a sum of multiple smaller spin components, which are considered in bulk because each of the individual elements is too small to be detected easily.
Once created, the magnetization vector follows a series of rules, as dictated by the Bloch equations.3 As discussed earlier, the preferred orientation of the magnetization is in the direction of the externally applied magnetic field, termed B0. By convention, descriptions of the magnetization that use a coordinate frame assign the z-axis to be the direction of B0. Therefore, the magnetization's preferred orientation is along the z-axis.
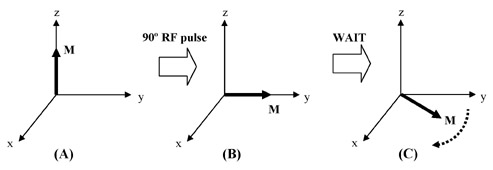
Through the use of radiofrequency (RF) coils and RF pulses applied perpendicular to the main magnetic field, the magnetization can be manipulated into any orientation desired. When the magnetization is disturbed from the z-axis, it "precesses" about the main magnetic field, much like a gyroscope precesses around a gravitational field (Figure 2). The frequency with which the magnetization precesses, ω, is directly proportional to the strength of the main magnetic field, and is called the Larmor frequency. For example, ω at 4T is double the value of ω at 2T. Only precessing magnetization generates a signal in MRI.
MRI pulse sequences usually contain multiple RF pulses. It becomes difficult to visualize the evolution of magnetization as it undergoes complex rotations during such a sequence, all the while precessing at the Larmor frequency. To simplify the situation, a change in reference frame is utilized. To analyze the magnetization, we can simply choose a coordinate frame that is rotating at the same frequency as the spin. In this coordinate frame, the precessing magnetization becomes stationary. This is nothing more than a mathematical trick, yet it makes the analysis of pulse sequences far more intuitive. This rotating coordinate frame is aptly termed the rotating frame; all subsequent magnetization diagrams presented here are in the rotating frame.
Relaxation
Application of RF pulses disturbs spins from their equilibrium states. The process by which spins return to equilibrium is termed "relaxation." In general, relaxation involves the interaction of spins with their environment, and involves restoration of a lower energy, more disordered state. The relaxation behavior of spins yields clinically useful information about the spin environment and generates important image contrast.
As discussed earlier, the magnetization's preferred state is oriented along B0. If magnetization is disturbed from the z-axis, it relaxes back to the z-axis. The process by which this occurs is termed T1 relaxation. Meanwhile, magnetization that has been flipped to the y-axis (or x-axis, for that matter) is in a highly ordered state, because each of the individual spin components that comprise M are aligned and pointing in the same direction. Such an ordered state cannot persist, and ultimately decays away. The process by which this decay occurs is termed T2 relaxation. These relaxation processes are considered individually in the following sections.
T1 relaxation—When magnetization is oriented along the z-axis, ie, pointing in the direction of B0, it is in a low-energy state. Changing the orientation of the magnetization requires the input of energy, which is achieved with an RF pulse. This rotates the magnetization away from the z-axis and places it into a relatively high-energy state.
This high-energy state cannot persist indefinitely. The magnetization will ultimately realign with B0. However, to do so, the spins must rid themselves of the excess energy that was imparted to them by the RF pulse. This is accomplished through their interaction with the surrounding environment, termed the lattice. The lattice is an oversimplification of a tremendously complex entity, consisting of every atom or molecule that may interact with the spin. The lattice serves as an energy "sink," drawing energy away from the spins and allowing them to return to their preferred state. The amount of time it takes for a spin to give up all of its excess energy to the lattice is characterized by the relaxation time T1. Because T1 depends on the interaction of the spins with the surrounding lattice, it is also called the spin-lattice relaxation time.4
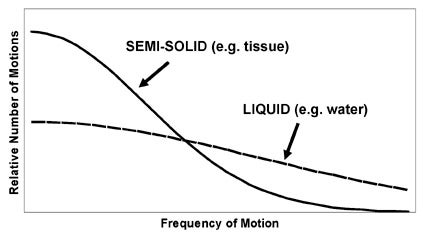
It is important to realize that the lattice is a combination of atoms and molecules, of varying sizes and shapes, each spontaneously moving, rotating, and vibrating at its desired frequency. There are a variety of motions in the lattice, occurring at a range of frequencies, with different relative proportions depending on the substance. For example, liquids have many mobile components that are moving/vibrating/tumbling at high frequencies, while solids have relatively fixed components and, therefore, have fewer high-frequency motions. This concept is summarized by the spectral density function, which is a representation of the number of motions in a range of frequencies for a given lattice (Figure 3). The spectral density function provides a concise overview of the kinds of processes occurring in the lattice with which the spins may interact. An important feature of spectral density functions is that, regardless of the composition of the lattice, there are usually more low-frequency motions than high- frequency motions.
Energy exchange between the spin and a component of the lattice becomes most efficient when the characteristic frequency of the spin and the lattice component are equal. This is a property of many resonant natural processes--for example, a glass breaking when an opera singer hits the right pitch, or a pendulum swinging higher when pushed at just the right rate. The characteristic frequency for a spin is the Larmor frequency. A spin precessing at the Larmor frequency best confers energy to the lattice when it finds something in the lattice that is also moving, rotating, or vibrating at the Larmor frequency.
Therefore, if the lattice contains a large number of motions at the Larmor frequency, there is an abundance of processes with which the spins can readily interact. Energy exchange is efficient, and the spins relax back to their low-energy state quickly. This translates into a short T1. If there are only a few lattice motions at the Larmor frequency, the spins relax very slowly because energy exchange with the lattice is inefficient, and T1 is long.
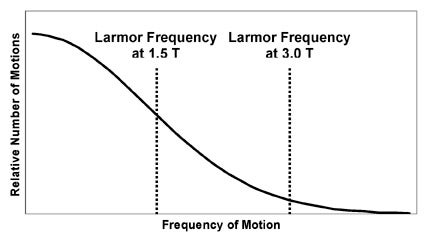
An empirical observation is that the spin-lattice relaxation time depends on the strength of the main magnetic field, B0.5 In general, at stronger fields (higher B0), T1 becomes longer. The basic reason for this effect is quickly deducible from the concepts described earlier. As B0 increases, the Larmor frequency increases. This means that the spins require higher frequency motions in the lattice for energy exchange. Because high-frequency lattice motions are more unusual than low-frequency motions, the interaction of spins with the lattice becomes less efficient (Figure 4). This prolongs T1.
T2 relaxation—Magnetization along the z-axis undergoes relaxation as governed by T1. However, magnetization perpendicular to the z-axis (in the x-y, or transverse, plane) undergoes relaxation by completely different mechanisms, governed by T2. To understand T2, one must consider several important features of transverse magnetization.
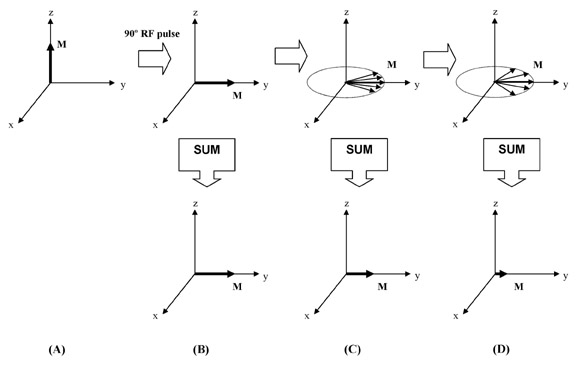
First, magnetization in the transverse plane is always precessing at the Larmor frequency. Second, remember that referring to a single magnetization is a simplification of the truth. A more accurate description is that there are multiple spin components, or "pieces" of magnetization, and we are actually detecting the sum of all of these pieces. This distinction is important, because each piece of magnetization behaves like its own little magnet, generating a small local magnetic field, which then influences the behavior of adjacent spins. The result is that each piece of magnetization has its own microenvironment, which is the result of its interaction with all surrounding spins, as well as spatial variations in B0, chemical processes, spin motion, and a host of other factors. Each piece of magnetization experiences its own unique, local B0, and therefore has its own unique Larmor frequency.
Imagine magnetization at "rest," pointing along the z-axis. If we apply
an appropriately calibrated RF pulse, we can rotate this magnetization
into the transverse plane. Once we do this, the magnetization begins to
precess. However, each spin component now precesses at its own
characteristic
Larmor frequency. The spin components are no longer "in sync," and after a short time are pointing in many
different directions, a process called "dephasing." If we add up these
components to determine the net transverse magnetization (the quantity
we actually detect), we find that it has dramatically reduced when the
spins have dephased (Figure 5). In other words, the transverse
magnetization has decayed simply because the spin components were all
precessing at their own individual frequencies. The time constant of
this decay is T2, called the spin-spin relaxation time because of its
dependence on spins interacting with each other to create varying
microenvironments.4
Principles and application of T1
Principles of T1ρ, the spin-lattice relaxation time in the rotating frame
A large portion of modern MR research is a quest for improved contrast between normality and disease, beyond the information offered by conventional T1- and T2-weighted imaging. There is growing interest in identifying diseased tissue through its unique chemical, mechanical, and biophysical properties. The question then becomes: how can MR imaging be tailored to create contrast based on the intrinsic properties of a tissue of interest?
One potential answer to this important question involves the use of a different relaxation time constant that can provide more complete tissue characterization. T1ρ is called the spin-lattice relaxation time in the rotating frame, and is somewhat of a hybrid between T1 and T2. In fact, the value for T1ρ is always between T2 and T1.
Ordinarily, when magnetization is rotated into the transverse plane, it undergoes T2 relaxation and decays away. However, instead of allowing the transverse magnetization to decay unperturbed, we can apply a low amplitude RF pulse for a prolonged period of time, forcing the transverse magnetization to relax while under the influence of this applied pulse. If the RF pulse is appropriately aligned with the transverse magnetization, the magnetization no longer relaxes according to T2, but instead relaxes according to T1ρ. An RF pulse that accomplishes this is called a spin-locking pulse (Figure 6).
Effects of the spin-locking pulse
The spin-locking pulse creates a small new magnetic field that is oriented in the transverse plane, parallel to the bulk magnetization. In ordinary T2 relaxation, the spin components become dephased, and bulk magnetization decays. The presence of a spin-locking field alters the tendency of the spin components to precess at their own individual frequencies, instead locking them in an orientation aligned with the spin-locking pulse. The prevention of dephasing slows down magnetization decay dramatically--the result is that T1ρ is longer than T2. The amplitude of the spin-locking pulse, BSL, and the duration of the spin-locking pulse, TSL, can be set to arbitrary values, constrained only by the electronics of the MR system.
The spin-locking pulse creates a new environment that affects the spins' interaction with the lattice. Because of the presence of the RF-generated magnetic field, the efficiency with which the spin couples to the lattice changes. In ordinary T1 relaxation, longitudinal magnetization relaxes by exchanging energy with processes in the lattice that are occurring at the Larmor frequency (Figure 4). In the presence of the spin-locking pulse, transverse magnetization can exchange energy with lattice processes occurring at the spin-locking frequency, which is directly proportional to the amplitude of the spin-locking pulse (BSL). T1ρ is, therefore, dependent on the spin-locking frequency, in the same way that T1 is dependent on the Larmor frequency.
There are large differences between ρ and T1 values, because of the markedly different range of lattice processes available to the spins for energy exchange. At 1.5T, for example, the Larmor frequency of water protons is about 63,866,000 Hz. Spin-locking frequencies used in most research and clinical work are in the range of 100 to 1000 Hz. There are far more lattice processes operating at these low spin-locking frequencies (so-called "slow motions") than at the Larmor frequency. Because there are so many available mechanisms for energy exchange at low frequency, T1ρ is shorter than T1. Because of the analogous dependence of these relaxation times on the lattice, the phrase "spin-lattice" finds its way into the name for T1ρ.
Information provided by T1ρ and T1ρ-dispersion
T1 and T2 are purely properties of tissue and are virtually never affected by pulse sequence parameters. T1 is affected by main magnetic field strength, as discussed earlier, but this is always a fixed value in clinical MRI. T1ρ is unique in that its value is determined by both properties of tissues as well as by features of the applied spin-locking pulse. By changing the amplitude of the spin-locking pulse, we can alter the spin-locking frequency, and therefore influence how the spins interact with the lattice. In particular, we can increase the contribution of low-frequency lattice motions to relaxation. T1ρ is thereby made more sensitive to slow motions in the lattice. This is of considerable interest to biomedical imaging, because slow motions in the lattice are typically associated with large molecules such as proteins. In fact, it has been shown that T1ρ is sensitive to the protein composition of tissue,6 and may therefore provide information about the macromolecular properties of tissue that is not available from T1 and T2 measurement.
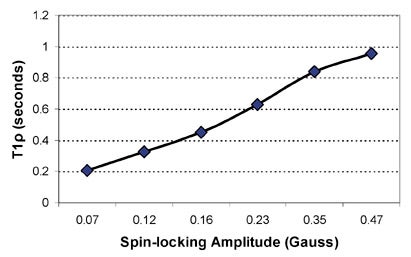
The dependence of T1ρ on the amplitude of the applied spin-locking field is called T1ρ dispersion. A sample T1ρ dispersion curve is provided in Figure 7. T1ρ dispersion is a property of tissue, and provides a representation of the tissue lattice at a range of low frequencies. Again, this can reflect the protein content and composition of tissue, which is characteristically not information provided by routine T1- and T2-weighted imaging.
An additional benefit of T1ρ-weighted imaging is that the relaxation time T1ρ is less susceptible to weak background magnetic field gradients that arise from inhomogeneous magnetic fields and magnetic susceptibility differences. T1ρ is a more reproducible tissue parameter than T2, and T1ρ-weighted images also tend to have higher signal-to-noise ratio than comparable T2-weighted images.
Implementation of T1ρ-weighted imaging
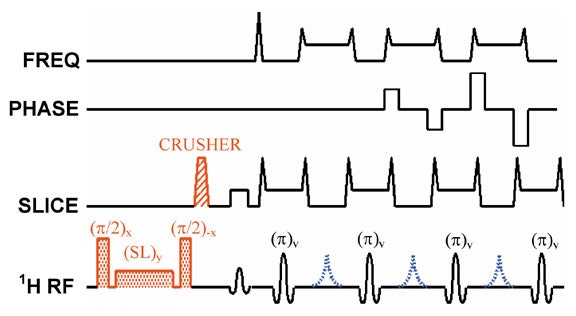
To introduce T1ρ-weighting into an MR imaging pulse sequence, one must allow the spins to relax in the presence of a spin-locking pulse at some point in time during the sequence. This is most easily done by applying a spin-locking pulse prior to imaging, allowing adequate time for T1ρ relaxation to occur, and then "storing" this T1ρ prepared magnetization along the z-axis.7 The magnetization can then be imaged by using any of a number of pulse sequences, including spin-echo,8 fast spin-echo (Figure 8),7,9,10 single-shot fast spin-echo,9 and 3D gradient-echo11,12 sequences. There is ongoing research to reduce RF power deposition,13,14 reduce imaging artifacts,15 and develop T1ρ-weighted multislice imaging techniques.16
Applications of T1ρ-weighted imaging
T1ρ-weighted imaging has been applied to multiple organ systems, studying a wide range of disease processes. As always, the goal is to extract tissue information that is not readily available with conventional T1- and T2-weighted imaging. T1ρ-weighted imaging has been used in the past to evaluate liver lesions,17,18 muscle disease,19-21 and breast lesions.13,22,23 Several recent developments and potential applications of T1ρ-weighted imaging are reviewed later.
Osteoarthritis—Osteoarthritis, a degenerative condition of articular cartilage, is radiographically evident only in advanced stages of disease where there is already extensive cartilage volume loss.24 However, the degenerative process begins with subtle biochemical and biomechanical alteration of cartilage; the cutting edge of musculoskeletal imaging involves the detection of these early signs of degeneration, such that treatment with chondroprotective agents may be instituted prior to irreversible cartilage loss.
Cartilage is composed of a water-avid proteoglycan matrix supported by a collagen framework. The intact matrix hinders the motion of water, thereby increasing the relative proportion of slow motions. Furthermore, water protons undergo exchange with amide and hydroxyl protons in proteoglycans at a relatively low frequency, creating another slow lattice motion. In early osteoarthritis, these proteoglycans are depleted, resulting in more free motion of water molecules within cartilage and less interaction between water and the depleted amide and hydroxyl groups. This causes an overall removal of slow motions from the lattice.25 Correspondingly, T1ρ is short in healthy cartilage and prolonged in diseased cartilage.26
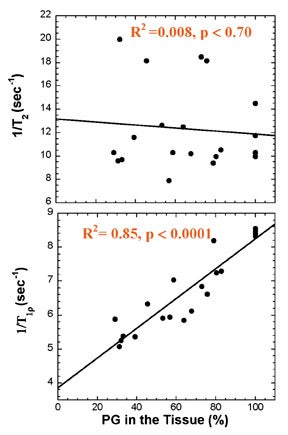
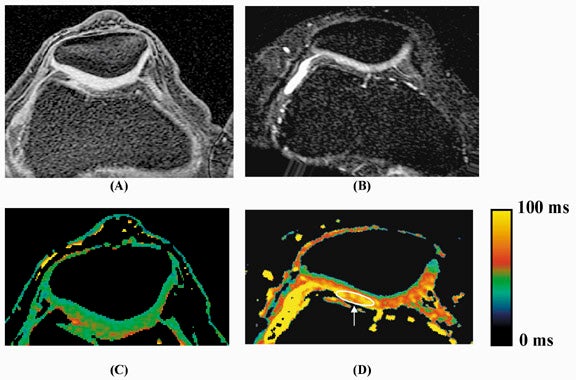
Multiple studies show that these changes in cartilage T1ρ are greater and more reproducible than corresponding changes in T2. The effects of enzymatic degradation of cartilage (an experimental model of osteoarthritis) are more sensitively detected with T1ρ measurement than with T2.27 In fact, cartilage T1ρ relaxation rate has been shown to be linearly correlated with proteoglycan content25 and more reproducible than T2 (Figure 9),28 allowing quantitative cartilage evaluation. Studies of cartilage in experimental in vivo animal models of osteoarthritis,29 and in human volunteers with osteoarthritis30 show that T1ρ is a sensitive marker for the changes in cartilage composition that occur with osteoarthritis (Figure 10). Recent work suggests that T1ρ-weighted imaging also reduces directional dependence in the appearance of cartilage, facilitating quantitative imaging.31 T1ρ-weighted imaging is a promising method for sensitive detection of early osteoarthritis; its entry into the clinical arena is imminent, pending current clinical trials.
Alzheimer's disease—Alzheimer's disease is a common neurodegenerative dementia of the elderly, characterized pathologically by deposits of amyloid protein in multiple senile plaques and neurofibrillary tangles in brain tissue.32 Despite its prevalence, there are few sensitive or specific imaging methods for detecting Alzheimer's disease. On conventional MRI, the disease most commonly causes cerebral atrophy, which is nonspecific and exhibits considerable overlap with changes seen in normal aging.33
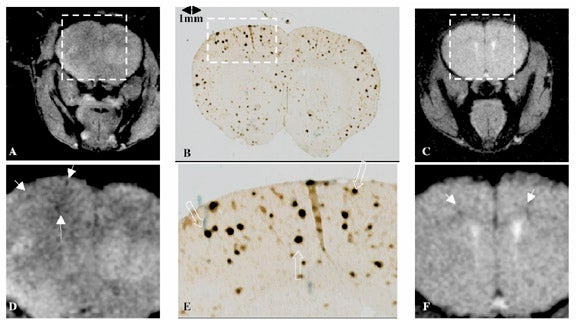
Recent work using a transgenic mouse model of Alzheimer's disease suggests that T1ρ is sensitive to the presence of amyloid plaques.34 Healthy brain tissue generally allows the free motion of water, resulting in few slow motions, and consequently, a relatively long T1ρ. The high protein content of Alzheimer's plaques may hinder water motion in such a way that T1ρ is shortened. Imaging of mouse brain riddled with plaques shows multiple areas of hypointensity on T1ρ-weighted images, corresponding to T1ρ shortening in regions of disease (Figure 11). Further work with higher resolution, three-dimensional imaging, with improved histopathologic correlation, is under way, and is necessary before T1ρ-weighted imaging can be clinically validated.
Tumor characterization and monitoring response to therapy—Conventional MRI is generally a highly sensitive means of tumor detection, particularly in the solid organs, soft tissues, and central nervous system. However, differentiation of benign and malignant disease continues to be a challenge of modern imaging. Delineation of tumor margins, assessment for local invasion, and detecting response to therapy are also sometimes problematic.
T1ρ-weighted imaging shows promise as a means of improved tumor characterization. T1ρ-weighted imaging of gliomas in the human brain at 0.1T showed that spin-locking pulses have different effects on the signal from normal brain and the signal from tumor. This suggests the ability to generate contrast between normal and diseased tissue.12 Early work on T1ρ dispersion imaging indicated different dispersion characteristics for normal mouse tissue and implanted mouse adenocarcinoma.35 More recently, T1ρ dispersion of head and neck tumors in humans has been studied at 0.1T; this work showed a statistically significant difference in T1ρ dispersion between benign and malignant tumors.36 Further evaluation of these techniques at clinically utilized field strengths will yield interesting results.
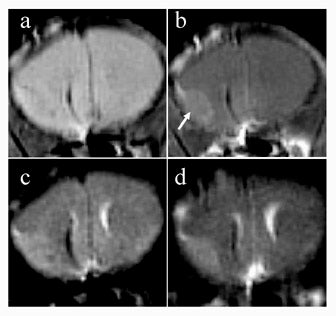
Anatomic imaging of tumors may also be facilitated with T1ρ-weighted imaging. In mice with melanoma implanted in brain, tumor margins were more sharply delineated with T1ρ-weighted imaging as compared with T2-weighted imaging at 4T (Figure 12).37 It was postulated that this effect arose from the ability of T1ρ imaging to suppress diffusion-related blurring, a benefit that has clear implications for MR microscopy.38 A more recent comparison of T1ρ- and T2-weighted imaging of mouse fibrosarcoma at 4T has shown improved delineation of tumor margins, as well as improved contrast between tumor and normal tissue, with T1ρ-weighted imaging.39
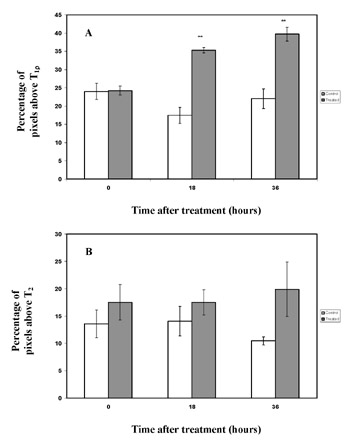
A desirable feature of clinical MRI is the ability to detect response of tumors to treatment. The most reliable current indicator of tumor response is decrease in size, but this, of course, requires sufficient time for treatment effect. T1ρ-weighted imaging was used to study mouse fibrosarcomas immediately after treatment with the chemotherapeutic agent cyclophosphamide.40 Significant elevation of T1ρ times in treated tumors was seen a mere 18 hours after treatment, before changes in T2 could be detected (Figure 13), possibly due to changes in tumor protein content. The authors suggested that an imaging modality with the ability to predict tumor response could allow rapid adjustment of therapeutic regimens tailored for each patient individually.
Cerebral ischemia—Imaging already has a pivotal role in the evaluation of acute ischemic stroke. However, there is continued need for an imaging technique that identifies brain tissue at risk of further damage. If salvageable, viable brain tissue can be distinguished from brain tissue damaged beyond repair, patients can be appropriately selected for thrombolytic therapy.
In a rat model of cerebral hypoperfusion and ischemia at 4.7T, T1ρ has shown sensitivity to ischemia similar to that of diffusion-weighting. T1ρ also shows better correlation with histological assessment of neuronal damage than T2 or diffusion weighting during cerebral reperfusion.41 Additional work in this model has shown that T1ρ dispersion increases in a graded fashion during cerebral ischemia. During reperfusion, T1ρ dispersion correlates with neuronal damage better than does diffusion- weighted imaging.42
The processes causing the changes in T1ρ during ischemia are still incompletely understood, but they may be distinct from processes causing early changes in apparent diffusion coefficient (ADC).43 The complementary information from changes in T2, ADC, and T1ρ may be combined for the improved evaluation of acute ischemic stroke. Continued work in reducing RF energy deposition is necessary prior to clinical implementation.44
Detection of T1ρ contrast agents— In a similar fashion to contrast agents affecting the T1 and T2 of water, such compounds can also affect T1ρ. In fact, compounds that exert their influence on slowly moving water can have a more selective effect on T1ρ, leaving T1 relatively unaffected.
Oxygen-17 (17O) is a stable, naturally occurring isotope of oxygen that possesses a nuclear spin. It is detectable by MRI,
but yields very poor SNR. In17O-labelled water (H217O), the water proton is influenced by its chemical coupling to the
17O atom. Because hydrogen atoms in water are constantly exchanging from one molecule to another,45 all water molecules in the sample share the effect of17O. Because the rate of hydrogen exchange is slow (approximately 1000 Hz), H217O shortens water T1ρ, but does not affect T1.46 This allows17O to be detected indirectly, purely by observing its effect on water, thus circumventing the poor intrinsic sensitivity of17O.
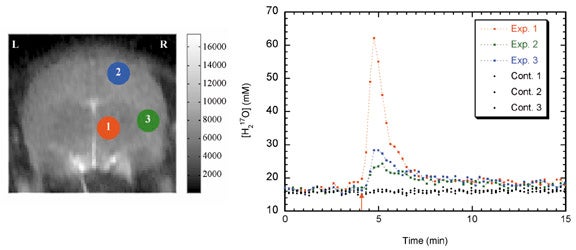
Use of17O as a contrast agent takes several forms. Injected17O-labelled water can be used as an intravenous or intra-arterial contrast agent that exactly mimics the physiology of water. T1ρ imaging can be used to quantify H217O concentration by performing T1ρ-dispersion imaging.8,47 Time-resolved T1ρ-weighted imaging, if performed at sufficient speed, can be used to map brain perfusion (Figure 14).48,49 This method has also been applied to perfusion measurements in mouse fibrosarcomas.50
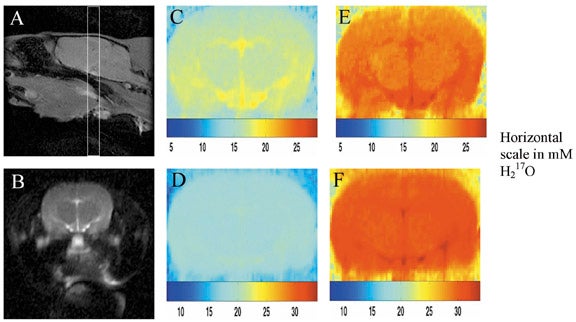
Perhaps more importantly,17O2 can be inhaled, and through tissue oxidative meta-bolism, converted to H217O. After administration of17O2, T1ρ-weighted imaging can detect regional increases in H217O concentrations, which can then be used to directly calculate metabolic rate (Figure 15).51 This is the "holy grail" of functional imaging, and has important implications for functional MRI and MRI of cerebral ischemia. Further research optimizing imaging techniques and establishing the sensitivity of this technique is under way.
Conclusion
T1ρ is a relaxation time constant with an intermediate value between T1 and T2, and is the main relaxation process during spin-locking with an RF pulse. T1ρ is sensitive to slow spin motions in tissue, and, with appropriately chosen pulse-sequence parameters, can show properties of a tissue of interest that are not observable through T1- and T2-weighted imaging. T1ρ-weighted imaging has been applied to a number of disease processes and organ systems and shows promise as a tool for the early detection of osteoarthritis and Alzheimer's disease, characterization of tumors, evaluation of cerebral ischemia, and detection of T1ρ contrast agents. Clinical applications exploiting the information available through T1ρ-weighted imaging are currently under development.
Acknowledgments
The author is grateful to Arijitt Borthakur, PhD, Harish Poptani, PhD, Ravinder Regatte, PhD, and Dharmesh Tailor, PhD, for their generous contribution of figures; to Ravinder Reddy, PhD, for his teaching and helpful comments during manuscript preparation; and to John S. Leigh, PhD, for his guidance and for many thought-provoking discussions.
References
- Redfield AG. Nuclear magnetic resonance saturation and rotary saturation in solids. Phys Rev. 1955;98:1787-1809.
- Abragam A. Principles of Nuclear Magnetism. Oxford, UK: Clarendon Press; 1961.
- Bloch F. Nuclear induction. Phys Rev. 1946;70:460-474.
- Bloembergen N, Purcell EM, Pound RV. Relaxation effects in NMR absorption. Phys Rev. 1948;73:679.
- Koenig SH, Brown RD, 3rd, Adams D, et al. Magnetic field dependence of 1/T1 of protons in tissue. Invest Radiol. 1984;19:76-81.
- Virta A, Komu M, Kormano M. T1ρ of protein solutions at very low fields: Dependence on molecular weight, concentration, and structure. Magn Reson Med. 1997;37:53-57.
- Mulkern RV, Patz S, Brooks M, et al. Spin-lock techniques and CPMG imaging sequences: A critical appraisal of T1ρ contrast at 0.15 T. Magn Reson Imaging. 1989;7:437-444.
- Reddy R, Stolpen AH, Leigh JS. Detection of17O by proton T1ρ dispersion imaging. J Magn Reson B. 1995;108:276-279.
- Charagundla SR. Indirect 17O Detection with
Proton Magnetic Resonance Imaging. PhD Thesis
in Department of Biochemistry and Molecular
Biophysics, Philadelphia, PA: University of Pennsylvania; 2000. - Duvvuri U, Charagundla SR, Kudchodkar SB, et al. Human knee: In vivo T1ρ-weighted MR imaging at 1.5 T--preliminary experience. Radiology. 2001;220:822-826.
- Borthakur A, Wheaton AJ, Charagundla SR, et al. Three-dimensional T1ρ-weighted MRI at 1.5 Tesla. J Magn Reson Imaging. 2003;17:730-736.
- Aronen HJ, Ramadan UA, Peltonen TK, et al. 3D spin-lock imaging of human gliomas. Magn Reson Imaging. 1999;17:1001-1010.
- Santyr GE, Fairbanks EJ, Kelcz F, Sorenson JA. Off-resonance spin locking for MR imaging. Magn Reson Med. 1994;32:43-51.
- Charagundla SR, Stolpen AH, Leigh JS, Reddy R. Off-resonance proton T1ρ dispersion imaging of17O-enriched tissue phantoms. Magn Reson Med. 1998;39:588-595.
- Charagundla SR, Borthakur A, Leigh JS, Reddy R. Artifacts in T1ρ-weighted imaging: Correction with a self-compensating spin-locking pulse. J Magn Reson B. 2003;162:113-121.
- Borthakur A, Charagundla SR, Wheaton AJ, et al. A novel pulse sequence for multi-slice T1ρ MRI. Presented at the 11th Scientific Meeting and Exhibition of the International Society for Magnetic Resonance in Medicine, Toronto, Ontario, Canada, July 2003:557.
- Halavaara JT, Lamminen AE, Bondestam S, et al. Spin lock magnetic resonance imaging in the differentiation of hepatic hemangiomas and metastases. Br J Radiol. 1995;68:1198-1203.
- Halavaara JT, Sepponen RE, Lamminen AE, et al. Spin lock and magnetization transfer MR imaging of local liver lesions. Magn Reson Imaging. 1998;16:359-364.
- Lamminen AE, Tanttu JI, Sepponen RE, et al. T1ρ dispersion imaging of diseased muscle tissue. Br J Radiol. 1993;66:783-787.
- Virta A, Komu M, Lundbom N, et al. Low field T1ρ imaging of myositis. Magn Reson Imaging. 1998;16:385-391.
- Virta A, Komu M, Lundbom N, Kormano M. T1ρ MR imaging characteristics of human anterior tibial and gastrocnemius muscles. Acad Radiol. 1998;5:104-110.
- Santyr GE, Henkelman RM, Bronskill MJ. Spin locking for magnetic resonance imaging with application to human breast. Magn Reson Med. 1989;12:25-37.
- Santyr GE. MR imaging of the breast. Imaging and tissue characterization without intravenous contrast. Magn Reson Imaging Clin N Am. 1994;2:673-690.
- Recht M, Bobic V, Burstein D, et al. Magnetic resonance imaging of articular cartilage. Clin Orthop. 2001:S379-396.
- Akella SV, Reddy Regatte R, Gougoutas AJ, et al. Proteoglycan induced changes in T1ρ-relaxation
of articular cartilage at 4T. Magn Reson Med. 2001;46:419-423. - Regatte RR, Akella SV, Borthakur A, et al. In Vivo T1ρ mapping of human articular cartilage. Radiology. 2003;229:269-274.
- Duvvuri U, Reddy R, Patel SD, et al. T1ρ-relaxation in articular cartilage: Effects of enzymatic degradation. Magn Reson Med. 1997;38:863-867.
- Regatte RR, Akella SV, Borthakur A, et al. Proteoglycan depletion-induced changes in transverse relaxation maps of cartilage: Comparison of T2 and T1ρ. Acad Radiol. 2002;9:1388-1394.
- Wheaton AJ, Borthakur A, Dodge G, et al. T1ρ MRI of experimentally induced osteoarthritis in a porcine animal model. Presented at the 11th Scientific Meeting and Exhibition of the International Society for Magnetic Resonance in Medicine, Toronto, Ontario, Canada, July 2003:2591.
- Regatte RR, Akella SV, Lech G, et al. T1ρ relaxation mapping: Quantitative in vivo assessment of early degenerative changes in symptomatic OA subjects. Presented at the 11th Scientific Meeting and Exhibition of the International Society for Magnetic Resonance in Medicine, Toronto, Ontario, Canada, July 2003:446.
- Akella SV, Regatte RR, Borthakur A, Reddy R. Effect of spin-locking field on laminar appearance of articular cartilage. Presented at the 11th Scientific Meeting and Exhibition of the International Society for Magnetic Resonance in Medicine, Toronto, Ontario, Canada, July 2003:59.
- Esiri MM. In: Dawbarn D, Allen SJ, eds. Neurobiology of Alzheimer's Disease. 2nd ed. New York, NY: Oxford University Press; 2001:33-53.
- Fox N, Scahill R, Hogh P, Rossor MN. In: Dawbarn D, Allen SJ, eds. Neurobiology of Alzheimer's Disease. 2nd ed. New York, NY: Oxford University Press; 2001:312-337.
- Borthakur A, Uryu K, Shively SB, et al. In Vivo T1ρ-weighted MRI of amyloid transgenic mouse model of Alzheimer's disease. Presented at the 11th Scientific Meeting and Exhibition of the International Society for Magnetic Resonance in Medicine, Toronto, Ontario, Canada, July 2003:2039.
- Rommel E, Kimmich R, Korperich H, et al. T1ρ dispersion imaging and localized T1ρ dispersion relaxometry: Application in vivo to mouse adenocarcinoma. Magn Reson Med. 1992;24:149-157.
- Markkola AT, Aronen HJ, Paavonen T, et al. T1ρ dispersion imaging of head and neck tumors: A comparison to spin lock and magnetization transfer techniques. J Magn Reson Imaging. 1997;7:873-879.
- Poptani H, Duvvuri U, Miller CG, et al. T1ρ imaging of murine brain tumors at 4 T. Acad Radiol. 2001;8:42-47.
- Engelhardt RT, Johnson GA. T1ρ relaxation and its application to MR histology. Magn Reson Med. 1996;35:781-786.
- Duvvuri U, Poptani H, Branstetter BF, et al. T1ρ Imaging of intra-muscular RIF-1 tumors at 4T. Presented at the 11th Scientific Meeting and Exhibition of the International Society for Magnetic Resonance in Medicine, Toronto, Ontario, Canada, July 2003:1229.
- Duvvuri U, Poptani H, Feldman M, et al. Quantitative T1ρ magnetic resonance imaging of RIF-1 tumors in vivo: Detection of early response to Cyclophosphamide therapy. Cancer Res. 2001;61:7747-7753.
- Grohn OH, Lukkarinen JA, Silvennoinen MJ, et al. Quantitative magnetic resonance imaging assessment of cerebral ischemia in rat using on-resonance T1 in the rotating frame. Magn Reson Med. 1999; 42:268-276.
- Grohn OHJ, Kettunen MI, Makela HI, et al. Early detection of irreversible cerebral ischemia in the rat using dispersion of the magnetic resonance imaging relaxation time, T1ρ. J Cereb Blood Flow Metab. 2000;20:1457-1466.
- Kettunen MI, Grohn OH, Penttonen M, Kauppinen RA. Cerebral T1ρ relaxation time increases immediately upon global ischemia in the rat independently of blood glucose and anoxic depolarization. Magn Reson Med. 2001;46:565-572.
- Grohn OH, Makela HI, Lukkarinen JA, et al. On- and off-resonance T1ρ MRI in acute cerebral ischemia of the rat. Magn Reson Med. 2003;49:172-176.
- Meiboom, S, Luz, Z, Gill, D. Proton relaxation in water. J Chem Phys. 1957;27:1411-1412.
- Rommel E, Kimmich R. Volume-selective determination of the spin-lattice relaxation time in the rotating frame T1ρ, and T1ρ imaging. Magn Reson Med. 1989;12:209-218.
- Rizi RR, Charagundla SR, Song HK, et al. Proton T1ρ-dispersion imaging of rodent brain at 1.9 T. J Magn Reson Imaging. 1998;8:1090-1096.
- Charagundla SR, Duvvuri U, Rizi R, et al. Dynamic17O imaging with fast T1ρ dispersion magnetic resonance imaging (MRI). Proceedings of the International Society of Magnetic Resonance in Medicine, 7th Scientific Meeting, Philadelphia, PA. 1999:2106.
- Tailor DR, Roy A, Regatte RR, et al. Indirect17O-magnetic resonance imaging of cerebral blood flow in the rat. Magn Reson Med. 2003;49:479-487.
- Tailor DR, Poptani H, Glickson JD, et al. High-resolution assessment of blood flow in murine RIF-1 tumors by monitoring uptake of H217O with proton T1ρ-weighted imaging. Magn Reson Med. 2003;49:1-6.
- Tailor DR, Baumgardner JE, Leigh JS, Reddy R. Proton MRI detection of metabolically generated H217O from inhaled17O. Proceedings of the International Society of Magnetic Resonance in Medicine, ISMRM-ESMRB Joint Annual Meeting, Glasgow, 2001.
Related Articles
Citation
. Primer on basic magnetic resonance physics. Appl Radiol.
February 2, 2004