Imaging of brain parenchyma in stroke
Images

Dr. Wintermark is an Assistant Professor of Radiology, Department of Radiology, Neuroradiology Section, University of California, San Francisco, CA. Dr. Fiebach is a Private Lecturer and a Specialist in Diagnostic Radiology, Institute for Diagnostic and Interventional Radiology and Neuroradiology, University Hospital of Essen, Germany.
The central premise of acute stroke treatment is to rescue the ischemic penumbra. When a cerebral artery is occluded, a core of brain tissue dies rapidly. Surrounding this infarct core is an area of brain that is hypoperfused but does not die quickly, because of collateral blood flow. This area is called the ischemic penumbra. 1-3
The fate of the penumbra depends upon reperfusion of the ischemic brain. In the case of persistent arterial occlusion, the infarct core will grow and progressively replace the penumbra. In the case of early recanalization-either spontaneous or resulting from thrombolysis-the penumbra will be salvaged from infarction. 4
The presence and extent of the ischemic penumbra is time-dependent, but especially patient-dependent. Indeed, from patient to patient, survival of the penumbra can vary from <3 hours to well beyond 48 hours. Approximately 90% to 100% of patients with supratentorial arterial occlusion show ischemic penumbra in the first 3 hours of a stroke, but, interestingly enough, 75% to 80% of patients still have penumbral tissue 6 hours after stroke onset. 4-6
The relatively negative results to date of thrombolysis trials between 3 and 6 hours, 6 in spite of the high percentage of patients with penumbra within this time window, relate to the fact that these trials did not use any method of penumbral imaging to select patients for therapy, despite the fact that the penumbra area was the target for treatment. Thus, a tissue clock, where both the extent of infarct and penumbra are determined, would seem an ideal guide to patient selection for thrombolysis, rather than a rigid time window, as in the current thrombolysis guidelines. 7
Extension of the therapeutic window beyond 3 hours could substantially increase the number of patients who are able to receive thrombolysis. However, for this to occur with improved outcomes, a rapid and accessible neuroimaging technique able to assess the ischemic penumbra is required. 8
Stroke MRI
The advent of new magnetic resonance imaging (MRI) techniques such as diffusion-weighted imaging (DWI) and perfusion MRI (perfusion-weighted imaging [PWI]) in the early 1990s added a new dimension to diagnostic imaging in stroke. 9 In the late 1990s, improved gradient hardware that was needed for echoplanar imaging was implemented in clinical MRI scanners. Deep brain ischemia leads to a shortage of metabolites. This causes a Na+/K+ channel failure in each ischemic cell. This membrane channel failure causes a subsequent cytotoxic edema. Without any net water uptake in the affected brain, the tissue water content remains unchanged and, therefore, X-ray attenuation does not change. During this early stage, native CT does not show any changes in tissue contrast. Cytotoxic edema leads to a narrowing of the extracellular matrix and, thus, to a reduction of Brownian molecular motion in the extracellular space. This phenomenon can be measured with DWI. It was first described in 1965 and can be measured quantitatively in the form of the apparent diffusion coefficient (ADC). 10
Kucinski and coworkers 11 presented clinical data from ischemic stroke pa-tients who were imaged with CT and DWI. They measured ADC and X-ray attenuation changes in infarcted tissue. In a cohort of 25 patients, they observed mean ADC changes of 170 × 10 -6 mm 2 /sec in the infarcted tissue 1.3 to 5.4 hours after symptom onset. This ADC decrease caused a strong contrast between infarcted and unaffected brain tissue (ADC 803 × 10 -6 mm 2 /sec) on DWI. In contrast to the ADC changes, Kucinski observed a time-dependent X-ray attenuation decrease of 0.4 HU per hour. Based on these data, CT appears to be less sensitive for early brain infarction as compared with DWI.
A stroke MRI protocol consists of T2-weighted (T2W) imaging, T2*-weighted (T2*W) imaging, DWI, and PWI as well as MR angiography (MRA). On T2W and fluid-attenuated inversion recovery (FLAIR) images, ischemic infarction appears as a hyperintense lesion that is seen--at the earliest--6 to 8 hours after stroke onset, in humans. 12 Diffusion-weighted imaging allows the depiction of ischemic tissue changes within minutes after vessel occlusion with a reduction of the ADC. 12 A net shift of extracellular water into the intracellular compartment (cytotoxic edema) with a consecutive reduction of free water diffusion is the main underlying mechanism for the ADC decrease. 13 The use of DWI leads to a significantly improved detection of early infarction compared with CT (91% versus 64%). 14,15
Perfusion-weighted imaging allows the measurement of capillary perfusion of the brain. The contrast bolus passage causes a nonlinear signal decrease in proportion to the perfused cerebral blood volume (CBV). It is not yet clear which PWI parameter gives the optimum approximation to critical hypoperfusion and allows the differentiation of infarct from penumbra and penumbra from oligemia. 16 In clinical practice, however, most authors agree that mean transit time (MTT) gives the best results. The calculation of the quantitative cerebral blood flow (CBF) requires knowledge of the arterial input function (AIF), which in clinical practice is estimated from a major artery, such as the middle cerebral artery (MCA) or internal carotid artery. Thijs et al 17 evaluated the impact of different AIFs measured at 4 different locations in 13 ischemic stroke patients. The curves of AIF were measured near both of the MCAs in MCA branches adjacent to the largest DWI abnormality and in the contralateral tissue to the lesion that is seen on DWI. The largest PWI lesion was measured based on the AIF of the unaffected MCA. The other 3 measurements of AIF led to an underestimation of the infarct size on follow-up images.
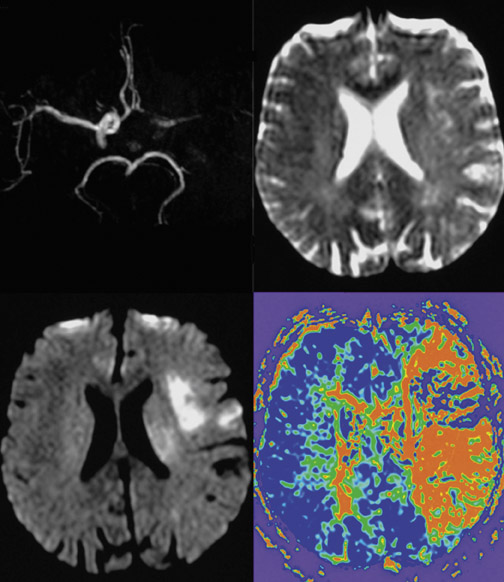
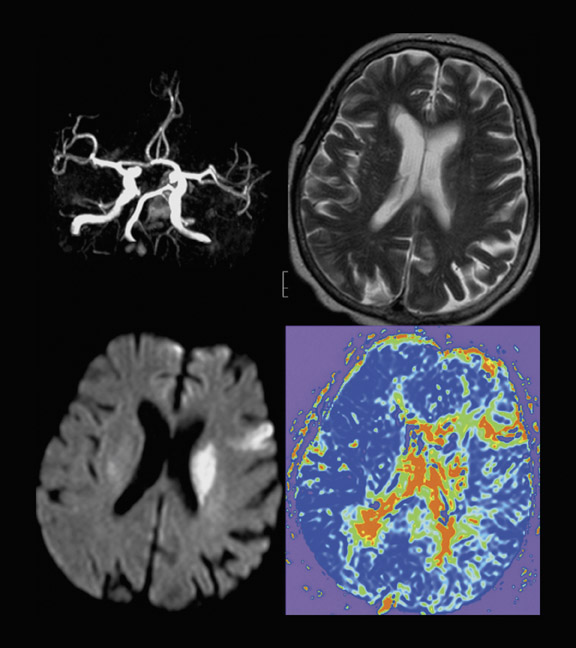
The attempt to differentiate infarction from penumbra by imaging techniques was made by introducing DWI and PWI into the clinical setting. In a simplified approach, it has been hypothesized that DWI more or less reflects the irreversibly damaged infarct, and PWI reflects the complete area of hypoperfusion. 18 The volume difference between these 2, which is also known as the PWI/DWI-mismatch (ie PWI volume minus DWI volume), would, therefore, be the stroke MRI correlate of the ischemic penumbra (Figure 1). On the other hand, if there is no difference in PWI and DWI volumes or even a negative difference (PWI < DWI), this is considered to be a PWI/ DWI match (Figure 2) and, according to the model is equivalent to the condition of a patient who does not have penumbral tissue because of normalization of prior hypoperfusion or completion of infarction and total loss of penumbra. 19,20 This model might be criticized because it does not take into account that the PWI lesion also assesses areas of oligemia that are not in danger and that DWI abnormalities do not necessarily turn into infarction. 21
Fiehler and coworkers 22 analyzed the frequency of ADC normalization in 68 acute stroke patients. They reported that 19.7% of their cohort had ADC normalization in >5 mL brain tissue. In those patients imaged within 3 hours after symptom onset, ADC normalization was seen in 35.5%, while it was 7.5% in patients imaged between 3 and 6 hours after onset. Apparent diffusion coefficient normalization was predominantly seen in the basal ganglia and white matter in patients with distally located vessel occlusions, and it was associated with a trend toward a better clinical outcome. 22 Thus, patients presenting with a PWI/DWI match with-in 3 hours after symptom onset might have salvageable tissue at risk and may benefit from fibrinolysis. However, it is still not known whether the absence of hyperintensities on follow-up T2W images indicates neuronal integrity in humans. DeLaPaz and coworkers 23 and Li and coworkers 24 observed neuronal damage in histologic examinations of tissue showing ADC normalization after reperfusion in a rat stroke model.
Stroke MRI was investigated under a routine clinical setting. Based on an open, nonrandomized patient cohort of 139 patients treated at 6 different academic hospitals, Röther et al 25 compared the results of 76 patients treated with recombinant tissue-type plasminogen activator (rtPA) with 63 control subjects. Presenting with a slightly more severe stroke score, similar DWI lesions, and a larger mismatch ratio, the treated patients showed early vessel recanalization more frequently and had better clinical outcome after 90 days than did the controls. The recently published Desmoteplase In Acute Stroke (DIAS) trial used a new fibrinolytic drug similar to a peptide from the salivaria of Desmodus rotundus , a vampire bat. Patient screening was based on clinical examination and medical history and was guided by the stroke MRI. Only patients presenting with a clear DWI/PWI mismatch were randomized. Besides the safety and dose-finding aspects of the trial, it also proved the usefulness of this imaging approach during the first 9 hours after symptom onset in ischemic stroke. Those patients who received a placebo or an ineffective dosage showed a low recanalization rate and, thus, an unfavorable outcome. In patients who achieved an early vessel recanalization and, thus, a reperfusion of penumbra tissue, a significant clinical benefit was observed, and 60% of the patients from the most effective dose tier had an excellent clinical outcome. 26
Hyperacute stroke imaging demands the differentiation between ischemic stroke and intracranial hemorrhage (ICH), which is impossible by clinical means only. The diagnosis of ICH is still in the domain of CT. Performing both-CT for the exclusion of ICH and stroke MRI to guide therapeutic efforts-is time-consuming and medicoeconomically questionable. 27 The appearance of ICH at MRI primarily depends on the age of the hematoma and the type of MR contrast used. The key substrate for early MRI visualization of hemorrhage is deoxyhemoglobin, a blood degradation product with paramagnetic properties due to unpaired electrons. The typical appearance of ICH on MRI images is a heterogeneous focal lesion. With increasing susceptibility weighting, the central area of hypointensity became more pronounced. On T2*W images, no or few areas of hyperintensity are visible in the lesion's core, which is surrounded by a hypointense rim. There is a surrounding hyperintensity on T2W and T2*W images and a hypointensity on T1-weighted images that represent perifocal vasogenic edema. One randomized, blinded pro-spective multicenter trial recently investigated the role of stroke MRI in ICH. 28 Images from 62 ICH patients and 62 nonhemorrhagic stroke patients all acquired within the first 6 hours after symptom onset (mean 3 hours 18 minutes) were analyzed after randomization for the order of presentation. The size of ICH ranged from 1 to 101.5 mL (mean 17.3 mL). Three readers who were experienced in stroke imaging and 3 senior medical students each separately evaluated sets of DW, T2W, and T2*W images (all were unaware of the clinical details). The experienced readers identified ICH with a 100% sensitivity (confidence interval: 97.1% to 100%) and a 100% overall accuracy. The medical students achieved a mean sensitivity of 95.16% (90.32% to 98.39%). Thus, hyperacute ICH is detectable with excellent accuracy even if the raters have only limited experience.
Stroke CT
Modern CT studies--including noncontrast CT (NCCT), perfusion CT (PCT), and CT angiography (CTA) 29-32 --fulfill all the requirements for hyperacute stroke imaging. 33
Noncontrast CT has classically been used as the standard initial imaging examination for acute stroke patients because of its convenience and its high sensitivity for the detection of intracranial hemorrhage, which represents an absolute contraindication to thrombolytic therapy. Occasionally, NCCT can provide information that is supportive of the diagnosis of evolving infarction (eg, the hyperdense artery sign, indicating arterial thrombus), even when ischemic changes in the brain parenchyma, such as hypodensity, are not visible. Unfortunately, NCCT provides solely anatomic and not physiologic information and has thus very low sensitivity for acute stroke detection. 34,35
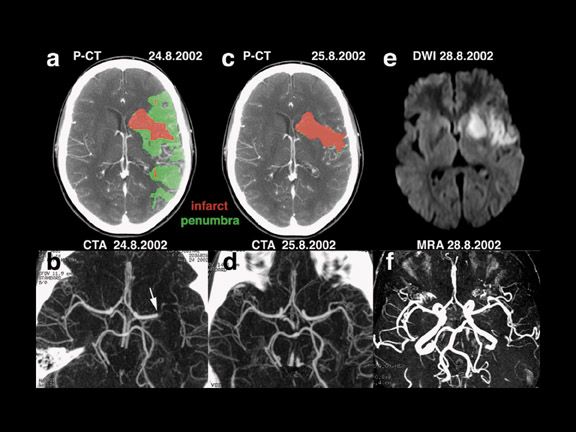
Sensitive and specific functional CT imaging, including CTA and PCT (Figure 3), provide complementary information about vessel patency and the hemodynamic repercussions of a possible vessel occlusion, respectively. Perfusion CT and CTA can be obtained immediately after NCCT, during the same CT examination, obviating moving the patient to another imaging device for the physiologic information needed for making treatment decisions. The total duration of an NCCT, 2 series of PCT, and a CTA is approximately 10 minutes. 29
Perfusion CT imaging, using standard nonionic iodinated contrast, relies on the speed of modern helical CT scanners that can sequentially trace the entry and wash-out of a bolus of contrast injected into an arm vein through an intravenous line. 36 The relationship between contrast concentration and signal intensity of CT data is linear. Thereby, analysis of the signal intensity increasing and then decreasing during the passage of the contrast pro-vides information about brain perfusion. More specifically, PCT description of brain perfusion consists of 3 types of parametric maps that relate to regional cerebral blood volume (rCBV), MTT, and regional cerebral blood flow (rCBF), respectively. Regional cerebral blood volume reflects the blood content of each pixel. Mean transit time designates the average time required by a bolus of blood to cross the capillary network in each pixel. Finally, rCBF relates to the amount of blood flowing through each pixel during a 1-minute interval. 36,37 Recently, blood flow values from PCT imaging have been shown to be highly accurate in humans when compared with the gold standard, PET. 38
By combining MTT and rCBV results, PCT has the ability to reliably identify the ischemic reversible penumbra and the irretrievable infarct core in acute stroke patients, immediately on admission. In the infarct core, both MTT and rCBV values are lowered, whereas in the penumbra, cerebral vascular autoregulation attempts to compensate for decreased rCBF by a local vasodilatation, which results in increased rCBV values. 39,40 Commercial PCT software currently offers the real-time automatic calculation of infarct and penumbra maps according to the above-mentioned principles.
PCT/CTA or MRI: Which one to choose?
CT and MRI provide similar information. The DWI lesion corresponds to the infarct core, whereas the DWI/PWI mismatch is representative of the ischemic penumbra. 41 The infarct core and the ischemic penumbra, as exhibited by DWI/PWI and by PCT, respectively, are comparable (Figure 4). 39,40 Similarly, CTA and MRA results are very much alike (Figure 3). Besides the similarity of their results, both CT and MRI techniques show respective advantages and drawbacks to be considered in the special settings of acute stroke.
Stroke MRI is still available only in a limited number of hospitals. Despite the advantages of stroke MRI, there are still doubts whether it is a safe approach in severely affected patients and, depending on each individual setting, it is hard to conduct stroke MRI without losing too much time before the onset of treatment. The main advantages are, first, direct visualization on DWI of the full extent of infarction and, second, whole-brain coverage that can be achieved with PWI at a time resolution of 1.4 seconds per frame; thus, even small but clinically relevant hypoperfusion can be visualized. Visualization of the circle of Willis can be performed within 3 minutes with a time-of-flight MRA. If a patient moves his or her head during image acquisition, a sequence can be easily repeated. No additional X-ray dosage or iodinated contrast agent is needed, and, therefore, no nephrotoxicity or relevant allergic reactions are expected. In contrast to iodinated contrast media, MRI perfusion measurement does not cause a feeling of heat, and, therefore, movement artifacts are less likely during perfusion imaging. However, the control of vital signs and the access to the patient during the 10-minute scan procedure is limited by the magnet. In addition, it takes some effort to train staff and technicians to conduct stroke MRI in a short period of time and to establish an adequate workflow during the hyperacute phase of ischemic stroke.
CT is often criticized, without reason, for its use of X-rays and iodinated contrast material. However, the radiation dose involved in PCT imaging is less than that of conventional cerebral CT, 42 and, to the authors' knowledge, no renal failure has yet been reported following a PCT examination. 43 Because of limited spatial resolution, PCT cannot detect small lacunes, whereas NCCT is not as sensitive to microbleeds as gradient-echo MRI. Perfusion CT has a limited spatial coverage (20- to 48-mm thickness). The issue of spatial coverage will, however, be addressed in the near future through the development of larger multidetector CT scanners with greater arrays of elements, and, even at present, PCT has been shown to have 95% accuracy in the delineation of the extent of supratentorial strokes, despite its limited spatial coverage. 44 Perfusion CT has also been proven to be as useful in the evaluation of vertebrobasilar ischemia. 45
The low requirements for performing PCT/CTA technology and its wide availability are keys to its taking over MRI in the imaging of acute stroke patients. Indeed, because of their relatively low cost and utility in other areas of medicine-particularly emergency medicine and trauma-CT scanners are becoming very widely available. In contrast to MRI, it is foreseeable that every major emergency center will eventually be able to complete this form of imaging within minutes of the patient presenting to the emergency department. Another major advantage of PCT over MRI relates to its quantitative accuracy, whereas MRI perfusion imaging offers only semiquantitative comparison of one hemisphere with the other. The quantitative accuracy of PCT makes it a potential surrogate marker to monitor the efficiency of acute reperfusion therapy, which is a decisive element when it comes to finding and validating new individualized therapeutic strategies for acute stroke patients.
Conclusion
Both CT and MRI fulfill all the requirements for hyperacute stroke imaging. CT angiography and MRA can define the occlusion site, depict arterial dissection, grade collateral blood flow, and characterize atherosclerotic disease. Perfusion CT and DWI/PWI accurately delineate the infarct core and the ischemic penumbra. CT and MRI both have their own advantages and drawbacks. The selection of one technique over another depends on the intrinsic characteristics of each imaging technique but also on the settings and on the knowledge and experience of the institution's staff.
Controversies regarding the superiority of either CT or MRI for acute stroke imaging should not obscure the ultimate goal, which is to increase the availability and improve the efficiency of thrombolytic therapy. From that standpoint, CT and MRI must be considered to be equivalent tools. It is hoped that the use of CT and/or MRI to define new individualized strategies for acute reperfusion will allow the number of acute stroke patients benefiting from thrombolytic therapy to be significantly increased.