Adrenal imaging: A practical guide to diagnostic workup and spectrum of imaging findings
Images


Dr. Elsayes is an Associate Professor, Department of Diagnostic Radiology, University of Texas MD Anderson Cancer Center, Houston, TX; and Dr. Caoili is a Clinical Associate Professor, Department of Radiology, University of Michigan Health Center, Ann Arbor, MI.
Noninvasive imaging can be useful in overcoming the challenges of detecting and characterizing adrenal masses. Imaging characteristics based on morphologic and physiologic features can guide the radiologic management of adrenal lesions.
Imaging techniques
Computed tomography (CT)
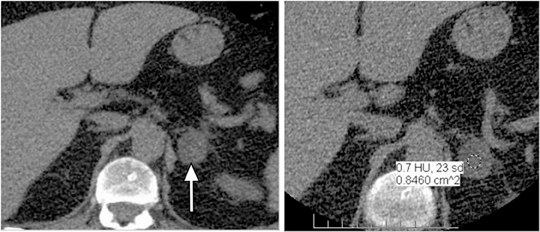
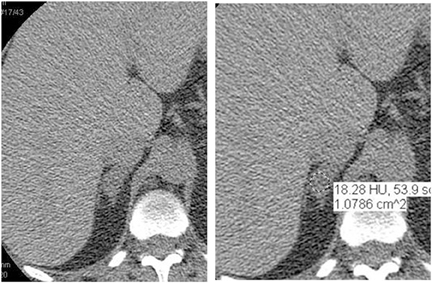
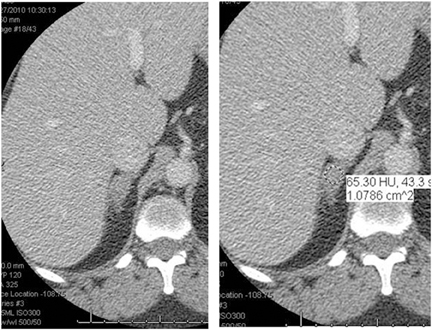
CT is commonly used to detect and characterize adrenal masses. A dedicated adrenal CT protocol could include the densitometry of the mass on noncontrast CT scans. Measuring the unenhanced attenuation value of adrenal masses is important for diagnosing lipid-rich adenomas. An unenhanced attenuation value of less than 10 Hounsfield units (HU) is characteristic of a benign adrenal mass, and no further imaging evaluation would be required.1 Use of contrast enhancement washout values would help to further distinguish adenomas from malignant lesions. Adrenal masses that have attenuation values >10 HU at unenhanced imaging should undergo enhanced CT imaging 60 sec after intravenous administration of contrast material and then delayed-enhanced CT imaging at 15 min. Enhancement washout percentages for these masses are calculated. The absolute percentage enhancement washout can be calculated by measuring the enhanced attenuation, the delayed enhanced, and the unenhanced values using the following formula:
AEW = EAV-DAV / EAV-UAV
AEW = Absolute enhancement washout
REW = Relative enhancement washout
EAV = Enhanced attenuation value
DAV = Delayed attenuation value
UAV = Unenhanced attenuation value
When noncontrast scans have not been obtained, relative enhancement washout can be calculated as follows:
REW = EAV-DAV / EAV
Absolute threshold values ≥60% and relative washout threshold ≥40% have been found to be 98% sensitive and 92% specific for diagnosing adrenal adenomas.1
Magnetic resonance imaging (MRI)
The most important sequence of the adrenal MRI protocol is chemical shift imaging performed with in-phase and out-of-phase sequences. Loss of signal intensity of the adrenal mass on out-of-phase images, compared to the in-phase pulse sequence, is diagnostic of the presence of intracellular lipid. The accuracy in distinguishing adenomas from metastatic tumors is 100% if the cutoff value of the signal intensity index selected is 16.5%.2
However, MRI has been reported to have limited value in characterizing lipid-poor adenomas. Haidar has described this limitation in lipid-poor adenomas with attenuation values >30 HU.3 Similarly, only 62% (8 of a series of 13 cases) of adrenal adenomas measuring >10 HU on unenhanced CT were characterized with chemical shift MRI.4
The utility of diffusion-weighted MR imaging (DWI) has been studied for the diagnosis of adrenal tumors. Although pheochromocytomas showed higher apparent diffusion coefficient (ADC) values in this series, ADC value has not been found to have significant utility for differentiating adenomas and metastatic tumors.5
Positron emission tomography (PET)
PET has been found to be less useful than CT in differentiating adrenal adenomas from nonadenomas. However, adrenal mass activity, which is visibly lower than liver activity, is more specific for adenoma, whereas adrenal mass activity visibly greater than liver activity is more specific for malignancy.6
Imaging findings
Adrenal adenomas
Adrenal adenomas are the most common adrenal lesions, found in 3% of cases at autopsy. An important characteristic of adrenal adenoma is the presence of intracellular lipid. CT is the most sensitive and specific imaging modality for characterization of adrenal masses. As discussed above, an unenhanced attenuation value <10 HU is characteristic of lipid-rich adenoma (Figure 1). Threshold values >60% for absolute and >40% for relative enhancement washout have been found to be 98% sensitive and 92% specific for diagnosing adrenal adenomas (Figure 2).1 Chemical shift imaging (with in-phase and out-of-phase pulse sequences) is the most reliable MR technique for diagnosing adrenal adenomas. Most adrenal adenomas demonstrate a loss of signal intensity on out-of-phase compared to in-phase images (Figure 3).7-9 A decrease in signal intensity of >16.5% is considered diagnostic of adenomas.2 Uniform enhancement on immediate contrast-enhanced images is also typical of adenomas.10 Small, rounded foci of altered signal intensity may be seen within adenomas, owing to cystic changes, hemorrhage, or variations in vascularity.11
Foci of macroscopic fat have rarely been reported in adrenocortical adenomas, which were preoperatively interpreted as myelolipomas on the basis of radiologic findings. The lipomatous tissue may represent degenerative phenomena within an adrenocortical adenoma or may be an additional neoplastic component of a tumor. Regardless of their origin, extensive (myelo) lipomatous changes in adrenocortical tumors can lead to misinterpretation in the preoperative work-up of patients with adrenal masses.12
Mimics of adrenal adenomas
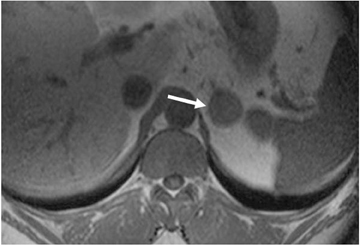
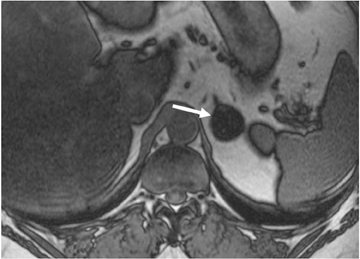
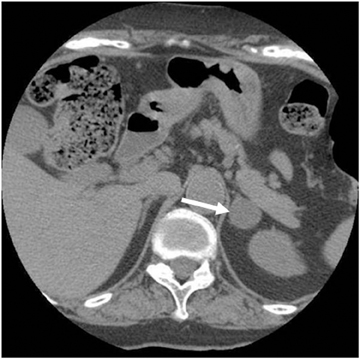
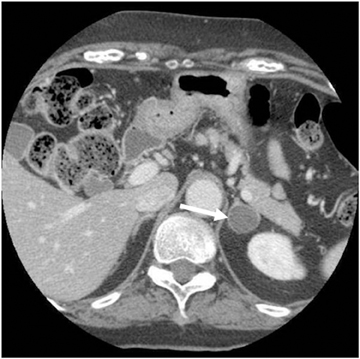
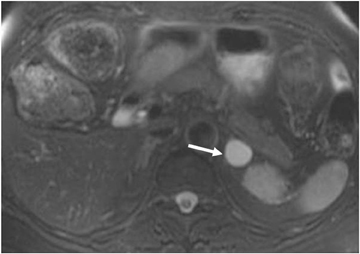
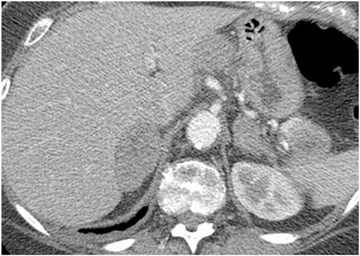
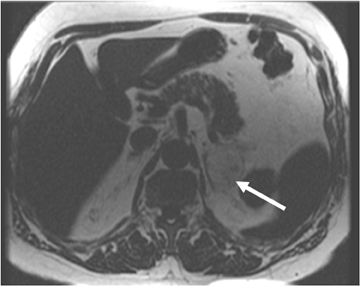
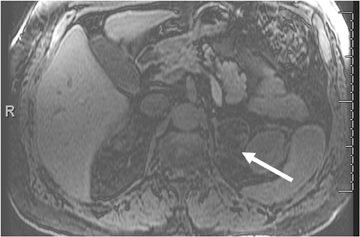
Although uncommon, various adrenal masses can mimic adrenal adenomas, mainly due to low attenuation on CT or the signal loss on out-of-phase MR pulse sequences compared to in-phase sequences. Simple cysts can mimic adrenal lipid-rich adenomas on unenhanced CT, as it could demonstrate attenuation value <10 HU. However, simple cysts do not enhance on postcontrast series, and they also exhibit high-signal intensity on T2-weighted MR images (Figure 4). Metastatic deposits containing intracellular lipid could develop secondary to primary malignancies containing intracellular lipid such as hepatocellular carcinoma or renal cell carcinoma (clear cell subtype).13,14 The presence of intracellular lipid in these masses results in signal loss in out-of-phase pulse sequences compared to in-phase pulse sequences, making them difficult to differentiate from the more common adrenal adenomas. Adrenal cortical carcinoma (ACC) has also been reported to contain intracellular lipid.15 However, adrenal cortical carcinomas are usually large at presentation, and the distribution of intracellular lipid in ACC would be rather inhomogeneous.
Adrenal metastases
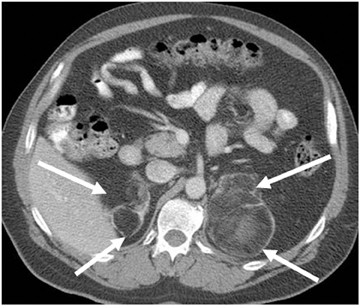
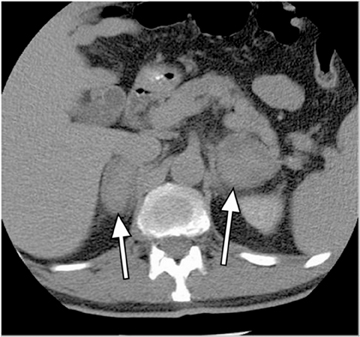
Metastases are the most common malignant lesions involving the adrenal gland. Adrenal metastases are found in up to 27% of patients with malignant epithelial tumors at autopsy.16 Common primary tumors that metastasize to the adrenal glands include carcinomas of the lung, bowel, breast, and pancreas.17 Metastases are usually bilateral (Figure 5), but they may also be unilateral. On CT, metastases typically have attenuation values >10 HU on unenhanced CT. They also demonstrate absolute enhancement washout of <60%, and a relative enhancement of <40%.1
On MRI, metastases usually exhibit low-signal intensity on T1-weighted images and high-signal intensity on T2-weighted images, with heterogeneous enhancement after administration of contrast. The most important diagnostic feature is the lack of signal loss on out-of-phase images (in contradistinction to that seen with adrenal adenoma).7-9
Collision tumors
Collision tumors are uncommon and represent the coexistence of two adjacent but histologically distinct tumors without histological admixture. If a collision tumor is not recognized, however, biopsy only of the benign component of the tumor can result in potential misdiagnosis.18 MR imaging can improve characterization of the separate components of collision tumors.18
Adrenal masses containing macroscopic fat
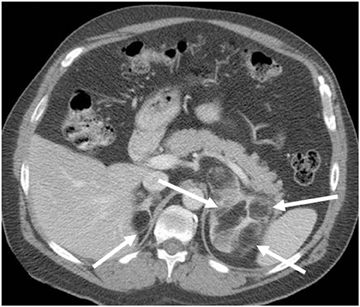
The most common adrenal mass containing macroscopic fat is myelolipoma. Myelolipoma is an uncommon benign tumor composed of mature adipose tissue and hematopoietic tissue. Most of these lesions are discovered incidentally. The fatty component of this tumor can be diagnosed by the presence of areas of negative attenuation value on CT. On MRI, macroscopic fat is hyperintense on nonfat-suppressed T1-weighted images. The use of fat suppression can help confirm the diagnosis by demonstrating a loss of signal intensity within the fatty component (Figure 6).19 Myelolipomas can be large and symptomatic secondary to spontaneous hemorrhage. Rarely, large myelolipomas can be confused with other retroperitoneal lipomatous tumors such as liposarcoma.11
Congenital adrenal hyperplasia can have a characteristic appearance of multiple bilateral adrenal masses containing extensive macroscopic fat that could result from prolonged stimulation of the adrenal cortex by elevated ACT levels (Figure 7).
The authors have described a rare entity presumed to represent lipomatous metaplasia.20 Adrenal lipomatous metaplasia is a known pathological entity characterized by small oval foci of macroscopic lipid occupying an otherwise unremarkable adrenal cortex. Because all the cases reported previously have been in the pathology literature, it is not surprising that they have been in patients with hypersecretory adrenal lesions such as hyperplasia, adenoma, and carcinoma that required surgical resection. In our cases, there was no clinical evidence of hypersecretory or structural adrenal abnormalities.20
Adrenal cortical carcinoma has rarely been reported to contain foci of macroscopic fat.21
Cystic masses
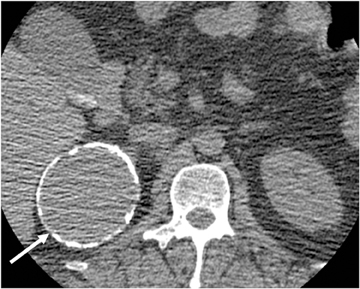
Endothelial cysts are the most common pathologic subtype of adrenal cyst, accounting for approximately 40% of adrenal cysts. Simple cysts demonstrate fluid attenuation (<20 HU) on noncontrast series; thus they could mimic lipid rich adenoma. Simple cysts, however, exhibit no significant enhancement on postcontrast series. On MRI, simple cysts are typically hypointense on T1-weighted images and hyperintense on T2-weighted images, with no soft-tissue component and no internal enhancement.22 Pseudocysts are the second most common cystic lesions of the adrenal gland, accounting for approximately 39% of adrenal cysts. They are more likely than simple adrenal cysts to be symptomatic. Pseudocysts typically arise after an episode of adrenal hemorrhage and do not have an epithelial lining. Peripheral curvilinear calcification may be present, which represents a characteristic pattern of a complicated cyst that is well depicted by CT (Figure 8), but difficult to appreciate on MR images.23,24 Adrenal pseudocysts may have a complicated appearance on MR images, manifesting septations, blood products, soft-tissue components secondary to hemorrhage or hyalinized thrombus.23,25
Adrenal cortical hyperplasia
Adrenal cortical hyperplasia is often seen in patients with Cushing syndrome (the result of hyperproduction of cortisol) and less commonly in Conn’s disease. The hyperplasia may be diffuse or nodular and typically is bilateral. On CT and MRI, the attenuation and signal intensity of hyperplastic adrenal glands are usually similar to that of the normal adrenal gland, although noncontrast attenuation could be lower in some cases. Similarly, signal intensity may also decrease on out-of-phase pulse sequences compared to in-phase pulse sequences, especially in patients with adenomatous cortical nodules. Bilateral cortical hyperplasia is seen in 45% of patients with Cushing syndrome, whereas nodular cortical hyperplasia is seen in only 3% of these patients.26
Adrenal hemorrhage
Adrenal hemorrhage can occur in the settings of postoperative states, trauma, stress, hypotension, and various bleeding diatheses as well as eclampsia of pregnancy and sepsis. On CT, adrenal hemorrhage can be seen as high density on unenhanced images (Figure 9). Its appearance overlaps with that of other lesions following contrast enhancement.
Adrenal insufficiency (Addison’s disease) can be a secondary effect of bilateral adrenal hemorrhage.27 MR imaging is the most sensitive and specific modality for diagnosing adrenal hemorrhage. MR imaging features vary according to the age of the hematoma. The appearance of blood products at MR imaging varies with their stage of evolution. Acute blood in the form of deoxyhemoglobin is isointense relative to muscle on T1-weighted images and has low intensity on T2-weighted images. Subacute blood in the form of methemoglobin is hyperintense on T1-weighted images. Initially, methemoglobin is intracellular and has low signal intensity on T2-weighted images. Subsequently, as the red cells lyse and the methemoglobin becomes extracellular, it has high signal intensity on T2-weighted images. Old hemorrhage has low signal intensity on both T1- and T2-weighted images because of the presence of hemosiderin. T1-weighted fat-saturated images are quite sensitive in the detection of methemoglobin. GRE images can magnify the susceptibility effects of decreased signal intensity seen with hemosiderin and deoxyhemoglobin, thereby increasing their conspicuity. Similarly, a lesion that loses a substantial amount of signal intensity on in-phase images compared with out-of-phase images obtained with a shorter echo time may contain blood products.
Pheochromocytoma
Pheochromocytomas are uncommon tumors arising from the adrenal medulla and the sympathetic paraganglia. Sympathetic ganglia are found predominantly in the para-axial region of the trunk along the prevertebral and paravertebral sympathetic chains and in the connective tissue in or near the walls of pelvic organs. Pheochromocytoma has been called the “10% tumor” because approximately 10% are bilateral, 10% are malignant, 10% occur in children, and 10% are extra-adrenal. It is difficult to differentiate benign pheochromocytomas from malignant, histologically. Therefore, malignancy is usually established by local invasion or metastases.
Pheochromocytomas can be associated with multiple endocrine neoplasias (MEN2), Von Hippel-Lindau Disease (VHL) (Figure 10), Von Recklinghausen neurofibromatosis (NF1) and nonsyndromic familial pheochromocytoma.28 Elevated levels of urinary metanephrine or resting plasma catecholamines can suggest the diagnosis of pheochromocytoma.
The appearances of pheochromocytomas are non-specific by CT and frequently overlap with other adrenal masses. MRI is increasingly used because of its multiplanar capability, high sensitivity for contrast enhancement, and lack of ionizing radiation. In our series of 18 surgically proven pheochromocytomas, the MRI appearances were variable. Most cases demonstrate high intensity on T2-weighted images. However, markedly increased T2 signal intensity is not as common as thought in the past. Pheochromocytomas do not contain intracellular lipids leading to lack of signal dropout on chemical shift pulse sequences. Variable postcontrast appearances can be also seen in these tumors with a characteristic persistent enhancement on delayed phase.29
Adrenal cortical carcinomas
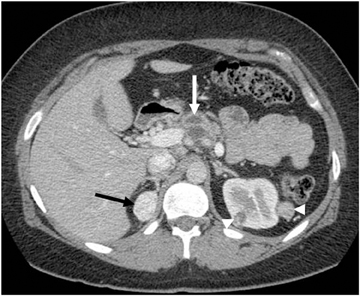
Adrenal cortical carcinomas are rare tumors, affecting approximately 2 patients per million, with a peak incidence in patients 30 to 70 years of age.30 Adrenocortical carcinoma is typically an aggressive malignancy with a poor prognosis, although less virulent forms do occur. The tumors can present either due to hormone production causing Cushing syndrome or Conn syndrome, or due to mass effect from the primary or metastatic lesions. Other manifestations include an abdominal mass and abdominal pain.
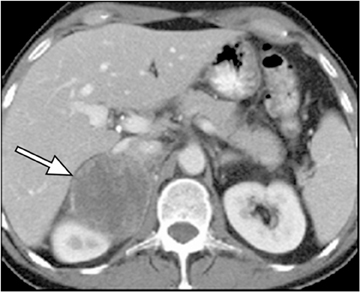
Typically, adrenal cortical carcinoma is large at presentation, usually measuring more than 6 cm. Heterogeneous texture on CT and MRI is usually noted, owing to the presence of internal hemorrhage, necrosis, and calcification (Figure 11).31 Adrenocortical carcinoma can contain foci of intracytoplasmic lipid, which results in a loss of signal intensity on out-of-phase images.31,32 Large adrenal carcinomas tend to invade the adrenal vein and inferior vena cava.
Conclusion
Adrenal adenoma is the most common adrenal mass, and metastases is the most common malignant adrenal mass. Most imaging techniques were developed to differentiate adenoma from metastatases, with CT washout technique as the most sensitive and specific imaging technique. Using CT, <10 HU on noncontrast series indicates a lipid-rich adenoma, and >10 HU on noncontrast series is indeterminate, and one should proceed with the washout technique. Washout >60% indicates diagnostic for lipid poor adenoma.
MRI is helpful in the setting of heterogeneous mass as well as in contrast issues, such as allergy, or renal insufficiency. In-phase/out-of-phase MRI is very useful for diagnosing lipid-rich and most lipid-poor adenomas, but is limited in characterizing few cases of lipid poor adenomas. 16.5% signal dropout is diagnostic of adenoma.
Metastatic deposits of primary malignancies containing intracellular lipid (such as HCC and RCC) could mimic adenoma.
Simple cysts may also mimic adenoma on noncontrast CT. Rarely, adrenal cortical carcinoma contains intracellular lipid and very rarely contains macroscopic fat. The presence of macroscopic fat is consistent with myelolipoma, until proven otherwise. Pseudocyst can have a large heterogeneous pattern, thus mimicking carcinoma.
Pheochromocytomas are better characterized by MRI. Although variable, a constellation of features, including lack of intracellular lipid, high signal intensity on T2-weighted images, and contrast enhancement, is suggestive of pheochromocytoma. Elevated plasma metanephrine levels are also consistent.
Adrenal cortical carcinoma is typically large and heterogeneous at presentation. The tumor can present due either to hormone production causing Cushing syndrome or Conn syndrome or to mass effect.
References
- Caoili EM, Korobkin M, Francis IR, et al. Adrenal masses: Characterization with combined unenhanced and delayed enhanced CT. Radiology. 2002;222:629-633.
- Fujiyoshi F, Nakajo M, Fukukura Y, et al. Characterization of adrenal tumors by chemical shift fast low-angle shot MR imaging: Comparison of four methods of quantitative evaluation. AJR Am J Roentgenol. 2003;180:1649-1657.
- Haider MA, Ghai S, Jhaveri K, Lockwood G. Chemical shift MR imaging of hyperattenuating (>10 HU) adrenal masses: Does it still have a role? Radiology. 2004;231:711-716.
- Israel GM, Korobkin M, Wang C, et al. Comparison of unenhanced CT and chemical shift MRI in evaluating lipid-rich adrenal adenomas. AJR Am J Roentgenol. 2004;183:215-219.
- Tsushima Y, Takahashi-Taketomi A, Endo K. Diagnostic utility of diffusion-weighted MR imaging and apparent diffusion coefficient value for the diagnosis of adrenal tumors. J Magn Reson Imaging. 2009;29:112-117.
- Caoili EM, Korobkin M, Brown RK, et al. Differentiating adrenal adenomas from nonadenomas using (18)F-FDG PET/CT: quantitative and qualitative evaluation. Acad Radiol. 2007;14:468-475.
- Mitchell DG, Crovello M, Matteucci T, et al. Benign adrenocortical masses: Diagnosis with chemical shift MR imaging. Radiology. 1992;185:345-351.
- Korobkin M, Lombardi TJ, Aisen AM, et al. Characterization of adrenal masses with chemical shift and gadolinium-enhanced MR imaging. Radiology. 1995;197:411-418.
- Namimoto T, Yamashita Y, Mitsuzaki K, et al. Adrenal masses: Quantification of fat content with double-echo chemical shift in-phase and opposed-phase FLASH MR images for differentiation of adrenal adenomas. Radiology. 2001;218:642-646.
- Semelka RC, Shoenut JP, Lawrence PH, et al. Evaluation of adrenal masses with gadolinium enhancement and fat-suppressed MR imaging. J Magn Reson Imaging. 1993;3:337-343.
- Elsayes KM, Mukundan G, Narra VR, et al. Adrenal masses: MR imaging features with pathologic correlation. Radiographics. 2004;24:S73-S86.
- Papotti M, Sapino A, Mazza E, et al. Lipomatous changes in adrenocortical adenomas: Report of two cases. Endocr Pathol. 1996;7:223-228.
- Shinozaki K, Yoshimitsu K, Honda H, et al. Metastatic adrenal tumor from clear-cell renal cell carcinoma: A pitfall of chemical shift MR imaging. Abdom Imaging. 2001;26:439-442.
- Sydow BD, Rosen MA, Siegelman ES. Intracellular lipid within metastatic hepatocellular carcinoma of the adrenal gland: A potential diagnostic pitfall of chemical shift imaging of the adrenal gland. AJR Am J Roentgenol. 2006;187:550-551.
- Yamada T, Saito H, Moriya T, et al. Adrenal carcinoma with a signal loss on chemical shift magnetic resonance imaging. J Comput Assist Tomogr. 2003;27:606-608.
- Abrams HL, Spiro R, Goldstein N. Metastases in carcinoma: Analysis of 1000 autopsied cases. Cancer. 1950;3:74-85.
- DeAtkine AB, Dunnick NR. The adrenal glands. Semin Oncol. 1991;18:131-139.
- Schwartz LH, Macari M, Huvos AG, et al. Collision tumors of the adrenal gland: Demonstration and characterization at MR imaging. Radiology. 1996;201:757-760.
- Boraschi P, Braccini G, Gigoni R, et al. Adrenal myelolipomas: Their magnetic resonance assessment. Clin Ter. 1996;147:549-557.
- Elsayes KM, Korobkin MT, Neiderman BJ. Lipomatous adrenal metaplasia: Computed tomography findings in 2 presumed cases. J Comput Assist Tomogr. 2009;33:715-716.
- Ferrozzi F, Bova D. CT and MR demonstration of fat within an adrenal cortical carcinoma. Abdom Imaging. 1995;20:272-274.
- Lee MJ, Mayo-Smith WW, Hahn PF, et al. State-of-the-art MR imaging of the adrenal gland. Radiographics. 1994;14:1015-1029.
- Rozenblit A, Morehouse HT, Amis ES. Cystic adrenal lesions: CT features. Radiology. 1996;201:541-548.
- Pollack HM. Miscellaneous conditions of the adrenals and adrenal pseudotumors. Clin Urogr. 1990;3:2403-2405.
- Tagge DU, Baron PL. Giant adrenal cyst: Management and review of the literature. Am Surg. 1997;63:744-746.
- Lumachi F, Zucchetta P, Marzola MC, et al. Usefulness of CT scan, MRI and radiocholesterol scintigraphy for adrenal imaging in Cushing’s syndrome. Nucl Med Commun. 2002;23:469-473.
- Xarli VP, Steele AA, Davis PJ, et al. Adrenal hemorrhage in the adult. Medicine. 1978;57:211-221.
- Elsayes KM, Narra VR, Leyendecker JR, et al. MRI of adrenal and extraadrenal pheochromocytoma. AJR Am J Roentgenol. 2005;184:860-867.
- Elsayes, KM, Menias CO, Siegel CL. Magnetic resonance characterization of pheochromocytomas in the abdomen and pelvis: Imaging findings in 18 surgically proven cases. J Comput Assist Tomogr. 2010;34:548-553.
- Hedican SP, Marshall FF. Adrenocortical carcinoma with intracaval extension. J Urol. 1997;158:2056-2061.
- Schlund JF, Kenney PJ, Brown ED, et al. Adrenocortical carcinoma: MR imaging appearance with current techniques. J Magn Reson Imaging. 1995;5:171-174.
- Mackay B, el-Naggar A, Ordonez NG. Ultrastructure of adrenal cortical carcinoma. Ultrastruct Pathol. 1994;18:181-190.