The Role of Cardiac CT for Function: Evaluation of Perfusion, Volumetric Analysis, and Regional Wall Motion Assessment
Images
Dr. Kanada graduated from Yale University with a degree in Molecular Biophysics and Biochemistry. In 2003, he graduated from Yale University School of Medicine, where he completed thesis work concerning the treatment of lower extremity peripheral artery occlusion with intra-arterial thrombolysis. He completed an internship in internal medicine at Yale-New Haven Hospital and is currently a Resident in Diagnostic Radiology at Yale-New Haven Hospital. He plans to specialize in body imaging. Dr. Catanzan o is an Assistant Professor of Diagnostic Radiology at Yale University School of Medicine, New Haven, CT.
Multidetector technology has enabled computed tomography (CT) to overcome limitations in temporal and spatial resolution, thereby providing important functional cardiac information. Perfusion imaging can be used to localize areas of recent and remote myocardial infarction. Volumetric analysis by CT now approaches magnetic resonance in accuracy and allows for the calculation of left ventricular ejection fraction. Finally, wall motion abnormalities in both acute and nonacute settings can be identified with good accuracy. These 3 functional parameters can be extrapolated from CT coronary angiographic data, which provides additional diagnostic and prognostic information in patients with cardiac dysfunction.
For more than a quarter of a century, investigators have examined the feasibility of acquiring functional cardiac information using contrast-enhanced computed tomography (CT). Early experimental studies and small clinical series suggested that myocardial perfusion abnormalities could be identified with CT. 1-9 Quantification of left ventricular ejection fraction (LVEF) and detection of wall motion abnormalities was initially limited by the suboptimal temporal resolution of single-detector systems. Electron-beam CT allowed for greatly improved temporal resolution but, for a variety of reasons, such systems never gained a substantial foothold in clinical practice. Multidetector CT (MDCT) also offers improved spatial and temporal resolution over single-detector systems, allowing for the assessment of functional information.
The widespread deployment of MDCT systems in hospitals and imaging centers has fueled a resurgence in investigations into cardiac CT imaging, with particular attention given to noninvasive imaging of the coronary arteries. The use of this application is expected to grow considerably in the coming years. This development has led investigators to explore the means of obtaining functional information from studies that are primarily optimized for the detection of coronary artery disease. In this way, a comprehensive cardiac evaluation can be provided for patients without exposing the patient to additional radiation.
CT perfusion
Early experimental studies of myocardial infarction
The evaluation of myocardial perfusion abnormalities with CT can provide both diagnostic and prognostic information. Early animal investigations with cardiac CT focused on the diagnosis of acute myocardial infarction (MI). Coronary artery ligation studies in canines revealed that infarct volumes detected on contrast-enhanced CT as localized regions of decreased attenuation correlated well with gross infarct weights. 1-3 Infarcts >1 g were consistently detected on CT, while 1 of 3 that weighed ≤0.5 g could be detected. 1 Although acute infarcts show diminished CT attenuation, with time, areas of hyperenhancement become detectable. Carlsson et al 4 reported that in canines, within the first few minutes of intravenous contrast administration, infarcted myocardium appeared as an area of decreased attenuation relative to the normally perfused myocardium. Furthermore, the same region would show hyperenhancement up to 30 minutes following contrast administration.
These experimental findings were corroborated by Masuda et al 5 in human subjects who presented with documented MIs. Inferior wall infarctions were poorly evaluated. Perfusion defects, presumably related to diminished blood flow to the infarcted myocardium, were seen in 87% of patients with recent (≤30 days) anterior, septal, and apical infarctions. Of the 31 patients with infarctions older than 6 months, none had perfusion defects. Late hyperenhancement, on the other hand, was seen in 33% and 55% of patients with recent and remote (>30 days) infarctions, respectively. In canine studies, Doherty et al 3 found that the areas of hyperenhancement could not be reliably depicted until 24 hours following coronary artery ligation and that they were caused by slow washout of contrast due to myocardial damage. 3 Also in canine studies, Slutsky et al 2 found that inclusion of the late hyperenhancing rim in infarct size calculations showed improved correlation with infarct size on gross examination in comparison with size measurements that excluded the enhancing periphery. 2
In experimental canine studies using gadolinium-enhanced magnetic resonance imaging (MRI), areas of hyperenhancement correlated with irreversibly damaged and necrotic myocardium. 6,7 In human subjects, these findings were corroborated by Beek et al, 8 who found that in patients with revascularized MI, the extent of hyperenhancement correlated inversely with the likelihood of functional recovery of the myocardium. In segments without hyperenhancement, the likelihood of complete functional recovery was 3.8, 11.1, and 50 times greater than in segments with 26% to 50%, 51% to 75%, and >75% hyperenhancement, respectively.
In summary, early experimental studies and corroborative human subject reports have found that contrast-enhanced CT examinations can detect an acute MI as a localized region of diminished attenuation relative to surrounding normal myocardium. This finding presumably relates to diminished vascular perfusion. With time, the same region will develop areas of hyperenhancement, often in a peripheral distribution, which reflects irreparably damaged myocardium with accumulation of extracellular fluid. These areas are believed to show increased attenuation because the contrast is slow to wash out of regions of such extensive cellular damage.
Diagnosis of MI with CT
In patients who are undergoing diagnostic work-up for acute MI, CT is not routinely used for the evaluation of myocardial perfusion. As developments in MDCT have made noninvasive evaluation of the coronary arteries possible, a renewed interest in the detection of myocardial perfusion abnormalities with this modality has emerged.
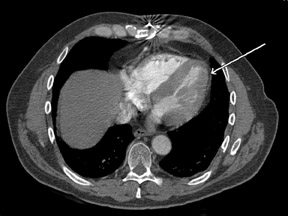
There is an abundance of unrealized information contained in contrast-enhanced thoracic CT examinations performed for noncardiac indications (Figure 1). Gosalia et al 9 retrospectively identified 18 patients who were ultimately diagnosed with acute MI and who had also undergone evaluation with contrast-enhanced thoracic CT for noncardiac indications within a month of presentation. Each patient was paired with a gender- and age-matched control subject who had also undergone enhanced thoracic CT. CT protocols varied according to the clinical indication, but all test subjects underwent evaluation with a single-detector helical CT scanner. Studies were interpreted on the basis of a localized decrease in left ventricular (LV) enhancement as determined by visual inspection and differential HU of at least 20 units. In 50% of cases, an area of decreased enhancement was detected visually. In 33%, an area was detected quantitatively but not visually. In the remaining 17%, a perfusion abnormality was not detected. In all but 1 of the control subjects, no perfusion abnormality was present. The sensitivity, specificity, and negative predictive value of CT in detecting an initial acute MI were 83%, 95%, and 86%, respectively.
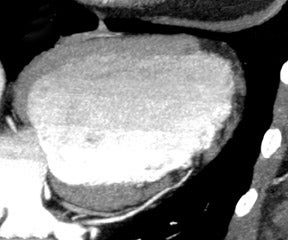
Multidetector coronary CT angiography (CTA) examinations are optimized for the evaluation of the coronary arteries, yet assessment of the myocardium for perfusion defects is possible because images are acquired during the arterial phase of enhancement (Figure 2). MR perfusion defects are known to correlate strongly with areas of MI, and, therefore, MRI is used as a reference standard in evaluating the efficacy of CT detection of infarction. Nikolaou et al 10 retrospectively identified 30 patients who had undergone 16-detector-row coronary CTA and MRI with stress perfusion and delayed myocardial enhancement. Perfusion defects were detected by visual inspection. Of the 17 perfusion defects detected on stress perfusion MRI, 13 were detected by CT. Six of the 17 defects did not correspond to infarctions as determined by delayed-enhancement MRI and, therefore, were thought to represent active ischemia. CT detected 3 of these 6 ischemic areas. The 3 missed defects were located in the cardiac apex. Of the 11 infarctions detected on delayed-enhancement MRI, 10 were identified on CT. Of note, delayed-enhancement CT was not evaluated in this study, as the CT examination was optimized for assessment of the coronary arteries.
Francone et al 11 analyzed data from retrospectively gated 4-detector-row coronary CTA in 187 patients. Of these, 29 patients (30 infarctions) had recent (within 1 month of CT) or remote MI on the basis of specific clinical and laboratory criteria. Multiplanar reconstructions of the heart in diastole were evaluated for regions of diminished attenuation (detected visually) and/or wall thinning. Twenty-five of 30 infarctions were detected, with 12 false-positives. Sensitivity and specificity were 83% and 91%, respectively. Of the 5 false-negative cases, 3 corresponded to non-Q wave MIs. Statistically significant wall thinning (mean thickness 4.1 versus 10.5 mm) was observed in 17 of 21 remote infarctions, while all 9 patients with recent infarctions had no significant wall thinning (mean thickness 7.9 mm). Therefore, early studies demonstrated that coronary CTA can detect most myocardial infarctions but is less reliable in the detection of active ischemia that has not yet progressed to infarction.
As suggested by experimental studies, cellular damage in infarcts produces delayed hyperenhancement on CT by 24 hours. Therefore, inclusion of a delayed CT phase might allow for a more comprehensive evaluation of the infarcted myocardium, although additional radiation exposure remains a consideration. Furthermore, multidetector technology allows for a diminished contrast bolus (at the author's institution, 64-detector-row studies require a dose of 60 to 80 mL as compared with 80 to 100 mL for the 16-detector scanner). In order to detect late enhancement, additional contrast beyond the requirements of coronary artery evaluation may be needed.
Mahnken et al 12 compared retrospectively gated 16-detector-row CT findings to MRI findings in 28 patients who had undergone revascularization for MI. Arterial phase (bolus-tracking method) and 15-minute delayed-phase images were acquired. Readers evaluated for perfusion defects on the arterial phase and hyperenhancement on the delayed- phase and mapped abnormalities to a 16-segment model of the heart. A difference of 20 HU from surrounding myocardium was designated as the threshold for abnormal perfusion. Delayed enhancement on CT had excellent correlation with MRI (agreement in 92.63% of segments). Arterial-phase CT showed agreement with MRI in 83.7% of segments and with delayed-phase CT in 82.36%. Delayed-phase CT and MRI also showed excellent correlation when infarct sizes were considered. Therefore, while studies involving human subjects suggest that contrast-enhanced CT performed for the evaluation of the coronary arteries and other thoracic disease can detect recent and remote MIs by showing perfusion defects, the inclusion of delayed-phase imaging augments sensitivity for infarcts by revealing areas of hyperenhancing myocardium. Acute and remote infarctions can potentially be distinguished by the detection of wall thinning, which may not be a feature of acute infarction. A possible practical application of CT perfusion in acute MI pertains to patients who are undergoing CT evaluation of the coronary arteries. Should a stenotic lesion of questionable significance be found on CTA, additional delayed-phase images could be obtained to complement the arterial-phase images in order to determine whether a corresponding defect or area of delayed hyper-enhancement was present within the territory supplied by this vessel.
Prognosis
In addition to the diagnosis of MI, CT perfusion can contribute valuable prognostic information. Infarction size as determined by nuclear medicine studies has been shown to correlate strongly with mortality. 13 In patients with known MI, CT has an emerging role in providing prognostic information through estimation of infarct size. Paul et al 14 investigated the role of CT in predicting infarct size following successful revascularization of acute MI. Single-photon-emission computed tomography (SPECT) with technetium-99m sestamibi was chosen as the reference standard. The authors prospectively evaluated 34 patients presenting with acute MI. CT with a 16-detector-row scanner was performed within an average of 3 days following presentation. Myocardial perfusion was assessed using a 5-minute delayed phase. Perfusion was evaluated based upon the presence of any late defects, which were localized and assigned positions on a 17-segment model of the myocardium. In addition, late defects involving >25% of the thickness of the left ventricle were recorded. These results were correlated with findings from SPECT imaging performed 6 months following presentation for acute MI. As with the CT evaluation, defects identified on SPECT imaging were localized according to the 17-segment model. In the analysis by segment, the sensitivity, specificity, and accuracy for CT were 78%, 91%, and 90%, respectively. For a defect involving ≥2 contiguous segments, the sensitivity was 100%. When considering only those defects involving >25% of the LV wall thickness, specificity increased slightly to 93%, but sensitivity fell to 58%. Accuracy was 88%. In the analysis by patient, all 27 patients with defects had true-positive findings. 5 patients had true-negative findings, and 2 had false-negative findings. Sensitivity, specificity, and accuracy were 93%, 100%, and 94%, respectively. Finally, the size of perfusion defects identified on CT was highly predictive of the infarct size identified on SPECT. Given that infarct size as determined with SPECT imaging is predictive of mortality and that the 2 modalities show such strong correlation, CT perfusion examinations performed within 3 days following MI might also provide valuable prognostic information.
The prognosis of patients following acute MI depends in large part on the restoration of myocardial perfusion. The preservation of microvascular flow is not evaluated by coronary angiography, as patency of the coronary arteries does not necessarily imply normal flow at the microvascular level. Nuclear imaging is widely used in assessing the status of myocardial perfusion in the evaluation of prognosis following infarction. CT might similarly be used to stratify patients based on expected long-term prognosis.
Koyma et al 15 investigated the use of a 2-phase contrast-enhanced cardiac perfusion protocol as a predictor of long-term ventricular wall function and thickness following successful percutaneous intervention (PCI) for an acute MI. The authors evaluated 58 patients who had suffered an acute MI secondary to occlusion of a single coronary artery and who had undergone successful PCI with residual stenosis of <50%. Each patient underwent 3 CT examinations over the course of 12 months. The acute stage study was performed within 48 hours following PCI. The intermediate stage study was performed at a mean of 28 days following PCI. In the long-term study, imaging was performed at a mean of 12 months following PCI. Imaging was performed with a single-detector-row scanner in 2 phases. The early-phase electrocardiograph (EKG)-gated images were obtained 45 seconds following the start of contrast administration while the late-phase images were obtained 7 minutes following the start of contrast administration.
Three types of perfusion abnormalities were identified. An early perfusion defect was defined as a low-attenuation region within the myocardium that was present on the early-phase images. A residual perfusion defect was defined as a corresponding smaller region of low attenuation on late-phase images surrounded by partially enhancing myocardium. Late enhancement was a zone of higher-than-normal myocardial attenuation seen on late-phase images. As detailed earlier, this enhancement is thought to reflect increased volume in the interstitial space because of myocardial cell damage and decreased cell number following acute MI.
In each patient, 1 of 3 enhancement patterns was identified in the CT examination performed within 48 hours of PCI. In group 1, there was no early or late perfusion defect, but there was a region of late enhancement. In group 2, there was an early perfusion defect and a corresponding area of late enhancement with no late perfusion defect. In group 3, there was an early perfusion defect and a corresponding late perfusion defect with surrounding late enhancement. Creatine kinase (CK) and CK-myocardial band (CK-MB) values were significantly higher in group 3 than in group 2, and values in group 2, in turn, were higher than the values in group 1. The ischemic time (defined as the time from the onset of symptoms to intervention) was greatest in group 3 and shortest in group 1. These data imply a correlation between the degree of MI and the enhancement pattern on CT. The enhancement pattern also correlated with the prognosis.
At the intermediate stage (28 days), ventriculography was performed in all patients. In patients assigned to group 1 in the acute-stage study, left end-diastolic volume (EDV) did not change significantly, while end-systolic volume (ESV) decreased and EF improved. In group 2, EDV, ESV, and EF did not change significantly. In group 3, EDV and ESV increased, while EF decreased from 64% ± 11 to 52% ± 13 ( P <0.001). In the acute-stage study, on the other hand, there had been no significant differences in EDV, ESV, and EF among the 3 groups. Ventriculography was not performed in the long-term stage.
Wall thickness was evaluated for each stage. There were no significant differences in wall thickness among the 3 groups in the acute stage. In the intermediate and long-term stages, group 1 did not experience significant wall thinning. Group 2 experienced 17.6% and 26.5% wall thinning at the intermediate and late stages, respectively. The former value was not statistically significant. Group 3 experienced 44.4% and 56.1% wall thinning at intermediate and late stages, respectively. Therefore, the authors concluded that the enhancement pattern in 2-phase contrast-enhanced CT obtained within 2 days of coronary intervention could serve as a predictor of eventual LV functional recovery and wall thickness. The findings of the 3 patient groups support the belief that coronary revascularization alone is not sufficient to ensure myocardial recovery. Differences in outcome may reflect differences in microvascular status, given that all patients had <50% residual stenosis of coronary arteries following PCI and, thus, had preserved flow on the macro-vascular level. Patients with late perfusion defects (group 3) experienced less ventricular functional recovery than patients without late defects but with early perfusion defects that converted into late enhancement (group 2).
The authors postulated that the enhancement pattern in group 3 reflects extensive myocardial necrosis and capillary damage with resulting poor recovery. These findings would also account for the greater decrease in wall thickness in group 3 in intermediate and long-term stages. The authors concluded that long-term ventricular function and prognosis could be predicted on the basis of the myocardial enhancement pattern detected shortly following acute MI.
Volumetric and ejection fraction estimations
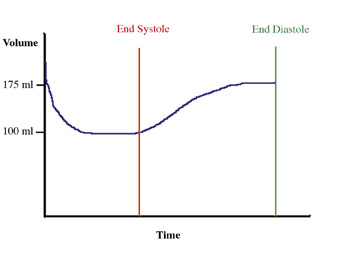
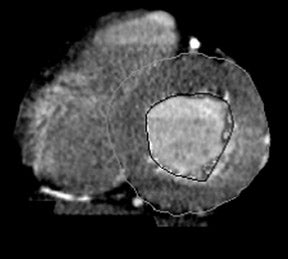
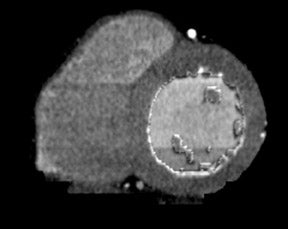
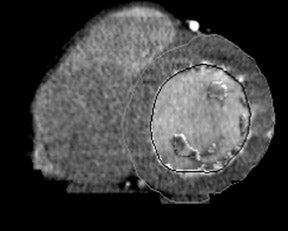
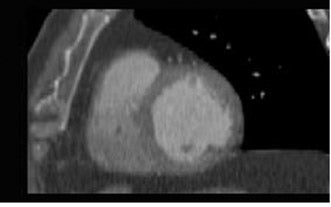
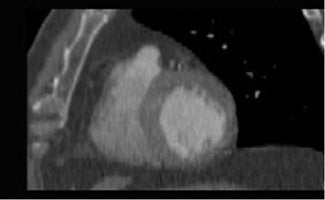
The foremost predictor of long-term survival following an acute MI is the functional status of the left ventricle. 16 Ventricular volumetric measurements and EF serve as the crucial parameters in the evaluation of LV function. White et al 17 performed a multivariate analysis in survivors of acute MI and found that an elevated LV ESV (>95 mL) measured 1 to 2 months following MI was the most important predictor of mortality in 605 patients followed for a mean of 68 months. MRI is currently regarded as the gold standard in the evaluation of ventricular volumetric measurements and EF. The ability of MDCT to estimate these values has not matched MRI, and, with the radiation exposure associated with CT, it is unlikely that it will supplant MRI in the future. However, with the rise in patients who undergo MDCT for coronary angiography, the inclusion of LV functional information would provide a more comprehensive cardiac work-up in patients with coronary artery disease. Coronary CTA usually uses data from the diastolic phase of the cardiac cycle only. Data is acquired via retrospective EKG gating, and information for the entire cardiac cycle is available for reconstruction (Figures 3 and 4). In order to ensure that the acquired data set contains the phase at the state of maximal contraction, 10 phases can be reconstructed from source data to calculate cardiac indices every 10% (0% to 90%) of the R-R interval. Rather than subjecting a patient to the cost, inconvenience, and possible harm from an additional imaging study--such as MRI, SPECT, or echocardiography--the same information can potentially be obtained from the CTA with no additional radiation exposure or contrast administration. Newer scanners with dose modulation may also allow reductions in radiation dose while obtaining the same information. The matter of whether to include endocardial trabeculae when tracing chamber contours was addressed by Papavassiliu et al, 18 who found that in MRI, the inclusion of the trabeculae resulted in reduced interobserver variability with regard to the measurement of LV EDV, ESV, and mass.
Juergens et al 19 investigated the feasibility of calculating LV functional parameters from MDCT coronary angiography data. Subjects were imaged with a 4-detector-row scanner. Utilizing retrospective EKG gating techniques, a transverse test image series through the cardiac cycle at 5% intervals was acquired at the midventricular level. The systolic and diastolic phases were identified on the basis of the minimal and maximal ventricular volumes found in the test series.
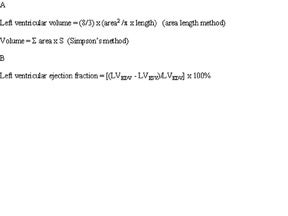
The corresponding time delays from the R peak of the EKG tracing were used for systolic- and diastolic-phase LV reconstructions. The area-length method and Simpson's method were used to calculate LV volumes, and the LVEF was calculated (Figure 5). For the area-length method, the ventricular area in the long-axis view as well as the length from the ventricular apex to the level of the mitral valve are determined. Using Simpson's method, the LV endocardial contours of all short-axis reformations are manually traced. The volume is the summation of the product of the cross-sectional area and the section thickness. The area-length and Simpson's methods yielded similar estimations of the LVEF. When compared with fluoroscopic ventriculography, both tended to underestimate the EF. This discrepancy likely was the result of overestimation of systolic volumes due to limited temporal resolution relative to ventriculography. In particular, studies in patients with heart rates >65 bpm were of lower quality because of motion artifact. Left ventricular functional measurements obtained with CT also correlate well with MRI measurements.
Grude et al 20 performed volumetric analysis using Simpson's method in patients who were undergoing coronary CTA (4-detector row) and correlated findings with MRI findings. Short-axis endocardial contours were traced manually using the scanner's planimetric software. CT and MRI showed good correlation in the measurement of LVEF (r = 0.8, P <0.001). Overestimation of ESV and EDV was significant, as was the resulting underestimation of EF.
Halliburton et al 21 evaluated 15 patients who were undergoing MDCT angiography, all of whom were also imaged with MRI for myocardial assessment on the same day. Diastolic and systolic image sets were obtained in a manner similar to that performed by Jeurgens et al. 22 Endocardial contours were manually traced, and volumes were calculated using Simpson's method. Both EDV and ESV were underestimated. The variability between CT and MRI was 15% for LV EDV, 13% for LV ESV, and 5% for EF.
Juergens et al 22 evaluated the use of standardized analysis software that had been developed for the purpose of semiautomated endocardial contour assessment in MDCT. Endocardial borders in short-axis images were traced semiautomatically in both systolic and diastolic phases, thereby reducing post- processing time. Contours were visually inspected for accuracy and, if necessary, could be manually adjusted by readers. Measurements were compared with MRI findings obtained within 48 hours. Correlation between the 2 modalities was good (EF, r = 0.89; P <0.001). Using standardized analysis software and 16-detector-row CT, Schlosser et al 23 found no significant difference in volumetric measurements with manual tracing of contours. CT overestimated LV volumes compared with MRI, but EFs were not significantly different.
In the above studies, limitations in temporal resolution relative to MRI were cited as likely explanations for overestimation of ESV. The duration of systole is 300 msec, and the minimal ventricular volume is maintained for only 80 to 200 msec. Given that the CT systems used featured temporal resolutions of 125 to 250 msec, the minimal ventricular volume might not be included in the acquired images. Miller et al 24 found that in MRI, a temporal resolution ≤45 msec is required to reliably determine ESV in patients with a normal heart rate. As CT scanners with faster gantry rotation times become available, the resulting improved temporal resolutions are expected to yield improved volumetric measurements.
To help alleviate limitations in temporal resolution, a segmental reconstruction algorithm was developed. Using MDCT coronary angiography, Yamamuro et al 25 evaluated this algorithm in 50 patients and compared findings with standard algorithm MDCT, MRI, echocardiography, and SPECT imaging. The segmental reconstruction algorithm reconstructs 1 image by collecting data from several heartbeats. This process has the effect of improving temporal resolution at the potential expense of spatial resolution. Miller et al 24 reported increased temporal resolution at the expense of spatial resolution in MRI volumetric measurements and found that a pixel size as large as 3 mm was tolerated. 24
Prior studies that evaluated ventricular function using standard reconstruction algorithms tended to overestimate ESVs, particularly at higher heart rates. The resulting EFs were thereby underestimated. By improving temporal resolution, the segmental reconstruction algo- rithm provides more precise estimations of the short-lived ESV. Phantoms and human subjects were imaged with an 8-detector-row scanner for evaluation of coronary arteries. 25 The standard algorithm yielded a temporal resolution of 250 msec. The segmental algorithm yielded temporal resolution that ranged from 100 to 250 msec, depending on the heart rate. Every 5% of the cardiac cycle was reconstructed. Patients also underwent imaging with MRI within 10 days of CT. Forty-one patients also underwent echocardiography, and 27 underwent thallium SPECT imaging. CT images were scored on the basis of blurring and stair-step artifact. When the standard algorithm on phantoms were used, artifacts were observed in subjects with heart rates >65 bpm. Under the segmental algorithm, artifacts were observed only in subjects with a heart rate of 80 bpm (a rate at which temporal resolution re-mained 250 msec). In human subjects, no substantial artifacts were identified when the segmental algorithm was utilized, including those with elevated heart rates. Interobserver variability was 5.7%. Using the standard algorithm, significant artifacts were observed at higher heart rates, and interobserver variability was 7.3%. Ejection fraction calculations revealed no significant measurement bias between segmental algorithm CT and MRI. The standard algorithm underestimated EF by 4.7%, echocardiography overestimated EF by 2.6%, and SPECT underestimated EF by 3.6%. Thus, the segmental algorithm improves measurements relative to MRI and outperformed other modalities.
Wall motion
In 1985, Lipton et al 26 conducted the first series that utilized CT in the evaluation of regional myocardial abnormalities in patients with prior infarction. Flow mode and cine mode protocols were employed in the acquisition of images. Regional motion abnormalities were visualized and graded as normal, hypokinetic, akinetic, and dyskinetic. The in-farcted segments of myocardial wall showed thinning with markedly reduced thickening relative to adjacent normal myocardium during systole. Good correlation was found between CT and angiography, with 90.9% agreement.
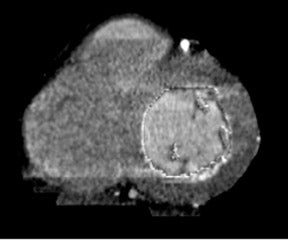
This early study suggested that wall motion abnormalities could be detected with CT by evaluating for visibly disrupted regional motion and noting the loss of wall thickening during systole (Figure 6). These findings have been upheld by recent experimental studies using porcine models. Hoffman et al 27 applied a porcine model of complete coronary occlusion. Subjects were imaged using 4-detector-row CT. Retrospective EKG gating and a segmental reconstruction algorithm yielded end-systolic and end-diastolic image sets. Postmortem examination of the animals revealed regions of infarction as assessed by microsphere-determined blood flow and histologic staining of gross specimens, which showed akinesis as well as absence of systolic wall thickening.
Mahnken et al 28 imaged a coronary occlusion model with a 16-detector-row system. A bisegmental algorithm was used to reconstruct images at every 5% of the cardiac cycle. Short-axis 2-, 3-, and 4- chamber views were reconstructed. Regional wall motion abnormalities were graded as follows: normal, hypokinetic (decreased endocardial excursion and systolic wall thickening), akinetic (ab-sence of endocardial excursion and systolic wall thickening), and dyskinetic (paradoxical outward movement in systole). Compared with MRI, regional wall motion scores as mapped on a 16-segment model of the heart showed a very high level of agreement.
Small studies that involved human subjects who presented with acute infarction suggested that the visual assessment of akinesis and the loss of systolic wall thickening corresponded to wall motion abnormalities in infarcted areas. 29,30 As with volumetric analysis, the evaluation of wall motion is limited by the temporal resolution of CT. In the analysis of wall motion, when performed at rest, a temporal resolution of 80 to 90 msec has been shown to be adequate in MRI. 31 With stress imaging, a resolution of ≤40 msec is required. Electron-beam CT and MRI both offer temporal resolution of up to 50 msec. Resolutions in MDCT systems used initially in cardiac CT were considerably lower.
Earlier, a segmental reconstruction algorithm was discussed that allowed for improvement in temporal resolution in patients who are undergoing volumetric evaluation. Mahnken et al 32 used the segmental image reconstruction algorithm to improve temporal resolution from 125 to 250 msec (a standard reconstruction algorithm provided with the CT scanner) to a mean of 109 msec. The algorithm used more than one R-R interval and gantry rotation for image reconstruction. Temporal resolution was improved at the expense of spatial resolution, leading to a slice thickness of 3.75 mm. In both algorithms, a series of 20 axial images of the cardiac cycle was obtained, with images obtained at every 5% of the R-R interval. Segmental wall motion was evaluated using a 16-segment model. With a total of 15 patients, 240 myocardial segments were evaluated. Wall motion scores (normal, hypokinetic, akinetic, dyskinetic, and not assessable) agreed with MRI in 83.75% using the standard algorithm and 92.5% using the multisegmental algorithm. Seventeen segments were not assessable using the standard algorithm, while 8 were not assessable using the multisegmental algorithm. Neither algorithm resulted in a difference by more than 1 grade. The standard algorithm yielded a significant difference compared with MRI ( P = 0.009) while the difference between the multisegmental algorithm analysis and MRI was not sig- nificant ( P = 0.26). Therefore, for purposes of wall motion evaluation, it appears that, to a certain extent, spatial resolution may be sacrificed in favor of improved temporal resolution.
In 2 studies of subjects presenting with unstable angina, Dirksen et al 33,34 compared regional wall motion abnormalities as assessed by echocardiography and 4-detector-row CT. Retrospective gating with a segmental reconstruction algorithm was used. In evaluating regional wall motion abnormalities as assessed by a graded wall motion score and a loss of systolic wall thickening, the authors found excellent agreement with echocardiography. Schuijf et al 35 found comparably high agreement with echocar- diography using 4- and 16-detector-row CT systems. Comparing 16-detector-row CT with MRI, Mahnken et al 36 found good agreement regarding regional wall motion. In the above studies, regional wall motion agreement by segments ranged from 86% to 91%.
Conclusion
Myocardial perfusion abnormalities, LV volume and EF, and regional wall motion abnormalities can be reliably evaluated using MDCT. MRI maintains an advantage over MDCT in that it offers improved temporal resolution without the risks of ionizing radiation or iodinated contrast. However, the use of MDCT in the noninvasive evaluation of the coronary arteries is expanding. Information concerning ventricular function can be reconstructed from data obtained for coronary artery assessment, thereby providing a more comprehensive cardiac examination. Patients can undergo such examinations in both the acute and nonacute settings. In either case, the knowledge of ventricular function can provide both diagnostic and prognostic utility. In a patient in whom the diagnosis of acute MI is in doubt, a study obtained for coronary artery assessment could also determine whether myocardium supplied by a stenotic lesion featured perfusion or regional wall motion abnormalities. Such information could implicate a stenotic lesion that had been of questionable significance on visual inspection. The care of a patient presenting with acute coronary syndrome could therefore be dramatically altered in such a setting. Alternatively, in patients with a known acute MI, valuable prognostic information can be derived from perfusion, volumetric, and regional wall motion findings. As CT technology progresses and scanning protocols are optimized, providers will be armed with a wealth of vital information.