Sonographic evaluation of abdominal transplants: A practical approach
Images

With advances in surgical techniques and greater understanding of immunosuppressive management, abdominal transplants are becoming a more widespread definitive treatment for otherwise end-stage diseases. The most common abdominal transplants include hepatic, renal, pancreatic, and islet-cell transplants. Implementing ultrasound as a diagnostic tool in the immediate post- and perioperative periods provides an accurate assessment of allograft viability that obviates the need for additional exams, which could subject the patient to unnecessary radiation and contrast exposure or the risks of invasive procedures.
Liver transplants
Approximately 6,000 hepatic transplants are performed annually in the United States (U.S.) and, as of December 2011, > 16,000 patients were awaiting transplantation.1 Postoperative ultrasound evaluation can accurately and effectively detect complications that will affect long-term morbidity and mortality. With increasing demand for liver transplants and for reduction of wait-list mortality rates, the available donorpool has been expanded by the advent of the split-liver transplant technique from cadaveric donors and lobar (right or left) grafts from living related donors in addition to whole liver transplants. It is imperative to recognize and understand the anatomy, variant anatomy, and functionality of these special cases.
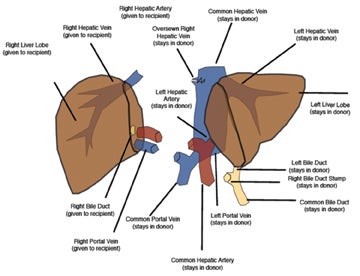
Split-liver transplants increase the recipient pool by dividing a donor liver between an adult and pediatric recipient. Adults most often receive the right lobe segments 5-8 (Figure 1). In larger patients, the medial segment of the left hepatic lobe may be included along with the right lobe (segments 4-8). Pediatric recipients can then be transplanted with the remaining left hepatic lobe (segments 2-3 or 1-4).2 Split-liver transplants may employ vascular conduits and reconstruction, which increases the risk of postoperative complications.2 It is advisable to consult with the surgical team to better understand potentially complicated reconstruction anatomy.
Sonographic evaluation of the hepatic allograft should begin with grayscale imaging of the type of transplant, transplant size, echotexture,and location within the abdomen. Special attention should be paid to the biliary tree. Routine Doppler interrogation of the hepatic vessels should include, when present, the main, right and left hepatic arteries and portal veins, as well as the middle, right, and left hepatic veins.Perihepatic collections are common in the immediate postoperative state, but should decrease over time and exhibit no mass effect to the hepatic parenchyma and vessels.
Hepatic artery
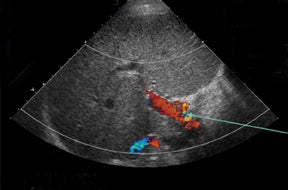
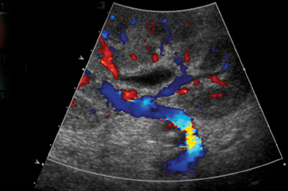
Understanding the anatomy or variant anatomy of the various types of hepatic transplants will help focus examination of the anastomotic channels as well as reveal the complications associated with each and prevent erroneous diagnoses. Approximately 50% of transplant recipients will endure a postoperative complication, 10% of those being vascular complications.3,4 With its accuracy in detecting hepatic artery complications in nearly 92% of cases,5 ultrasound becomes an essential and imperative diagnostic exam. Most often, the donor hepatic artery is anastomosed in an end-to-end fashion to the recipient hepatic artery or between the donor celiac axis and bifurcation points (right and left hepatic orGDA and PHA) of the recipient.2,6,7 A Carrel patch, an aortic patch containing the donor’s aorta, including the origin of the celiac axis, may also be used as an anastomotic channel.8 Oftentimes, a “fish mouth” anastomosis must be performed to overcome size discrepancy between a small-caliber donor artery and a larger-caliber recipient artery.7,8 Alternatively, an interposition graft, often using the donor’s iliac artery, may connect the donor hepatic artery to the recipient supraceliac or infrarenal aorta or other tributary.2,6,7 The discrepancy in size may increase the risk of hepatic artery complications, including stenosis and thrombosis, in the postoperative period, or it may mimic a pseudostenotic appearance.2 It is not uncommon to have the donor celiac artery anastomosed to the recipient hepatic artery at the bifurcation.
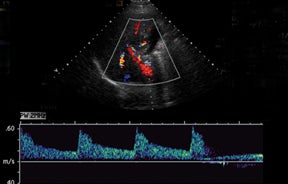
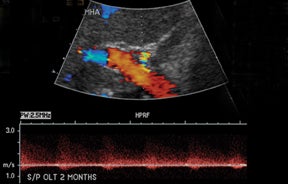
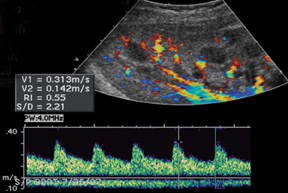
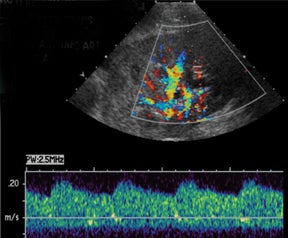
Normal hepatic artery waveforms include the presence of a brisk systolic upstroke with presence of diastolic flow, a resistive index range of 0.5 to 0.7.2,6 (Figure 2). The acceleration time of the peak systolic velocity should be < 80 milliseconds.2,6 It is common to demonstrate decreased diastolic flow and high resistive indices in the immediate postoperative period attributed to edema or vasospasm.2,6,9 These high-resistive indices are not only detected in the main hepatic artery, but parenchymal branches as well, and are apparent within 72 hours of the postoperative period and should be transient, resolving by 2 weeks.6,9
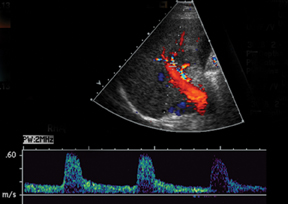
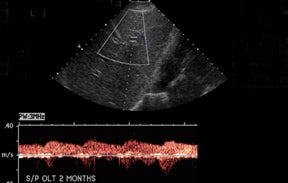
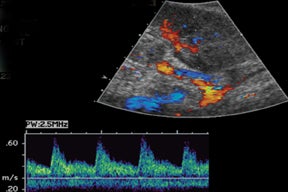
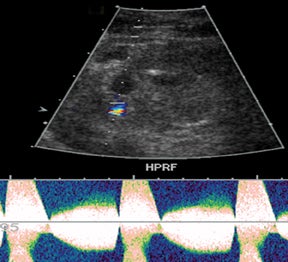
The most common site of significant hepatic artery stenosis is at the donor-recipient anastomotic site, occurring in up to 11% of cases.3,4,8 It often is difficult to visualize, due either to the small caliber of the vessels or to overlying bowel gas. If seen, a focal area of color Doppler aliasing may direct the diagnostician to the site of a subtle or obscured stenosis. Targeted Doppler evaluation of a hemodynamically significant stenosis would demonstrate an angle corrected peak systolic velocity > 2 m/s or a twofold velocity increase when compared to the prestenotic segment.2,3,8 Waveform findings distal to the site of stenosis may reveal a “tardus-parvus” waveform, witha prolonged PSV acceleration time > 80 milliseconds, or diminished resistive indices < 0.5 (Figure 3).2,3,8
The most common postoperative arterial complication is hepatic artery thrombosis, often detected within the first 3 months, and occurs at an even higher rate if arterial reconstruction or grafts are employed.2 The rate of hepatic artery thrombosis is as high as 5% to 12% with one-year reconstruction or graft viability at approximately 73%.2,7,8 The rate is even higher in the pediatric population, with prevalence as high as 42%.4 Hepatic artery thrombosis is associated with significant morbidity and mortality, with mortality rates as high as 58%, and is the second-leading cause of graft failure in the immediate postoperative period.6,7,10 Delayed-hepatic arterial thrombosis can occur many years after transplant, accounting for the majority of vascular complications, and is associated with chronic rejection, pediatric transplants,and sepsis.2 The lack of arterial flow within the porta hepatitis or within the liver parenchyma is the most striking finding.3 Low-resistance arterial waveforms may be detected within the liver despite the presence of a main-hepatic artery thrombosis due to small collateral vascular tributaries.3, 7
Hepatic-artery pseudoaneurysms are a less common vascular complication. They are classified as either intrahepatic or extrahepatic.3 Intrahepatic pseudoaneurysms usually arise as sequelae of infection or postbiopsy complication in a patient with suspected rejection.7 Extrahepatic pseudoaneurysms typically develop at the site of the hepatic-artery anastomosis either from surgical or mycotic etiology.2,7,8 Grayscale imaging will demonstrate an anechoic cystic-appearing structure with the typical color and Doppler findings of the “yin-yang” color swirl and the “to-and-fro” spectral velocity pattern seen in pseudoaneurysms of any cause.2,3 If the recipient hepatic artery or celiac artery is stenosed, an aortohepatic jump graft (usually the donor iliac artery) may be required.2
Portal vein
The portal vein anastomosis is usually performed via an end-to-end anastomosis between donor and recipient.6-8 Similar to hepatic arterystenosis, portal vein stenosis occurs at the anastomotic site and can be identified by a focal area of luminal narrowing (< 2.5 mm) on grayscale orby focal-color aliasing on color imaging.2 Doppler interrogation of a hemodynamically significant stenosis will reveal a peak systolic velocity> 150 cm/s at the anastomosis, or a 3- to 4-fold peak systolic velocity increase when compared to the prestenotic segment.2,3,8 Portal-vein thrombosis can also often occur at the site of anastomosis and can be seen as an echogenic or isoechoic (acute) intraluminal-filling defect on grayscale with absent or partial flow on color Doppler imaging.3 With chronic thrombosis, revascularization or cavernous transformation may be seen inthe adjacent porta hepatis. Additional secondary signs of portal vein thrombosis include ascites, edema, splenomegaly, and collateralization of shunts.7,8 If the portal vein is completely thrombosed, an SMV or splenic vein jump graft using the donor iliac vein, superior mesenteric vein, or splenic vein may be used as a bypass.2,6,7
Hepatic vein
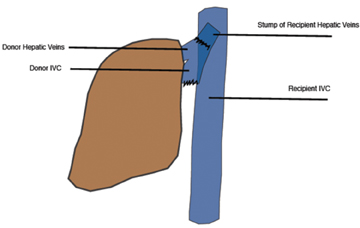
The IVC has traditionally been anastomosed in an end-to-end fashion, but with increasing frequency an end-to side or side-to-side anastomosis known as the “piggyback” technique is performed. This technique connects by anastomosis the donor supra-hepatic IVC to the recipient hepatic venous confluence while the donor infra-hepatic IVC, if present, is tied off (Figure 1).2,6-8 This method obviates the need for veno-venous bypass and caval reconstruction. “Piggyback” reconstruction is often employed in split-liver transplants and is required for left lateral segment transplants (segments 2-3), since the donor IVC does not accompany the allograft.2 When evaluating an end-to-end anastomosis, Doppler evaluation of venous velocities and waveforms should include both supra- and infrahepatic anastomoses.2
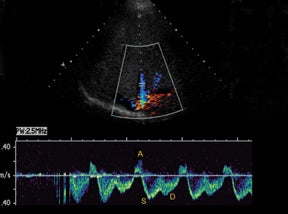
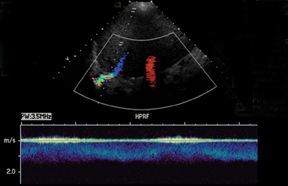
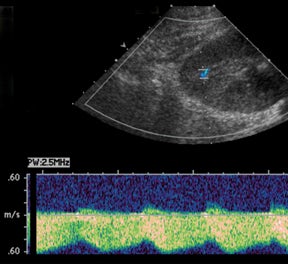
IVC and hepatic venous waveforms should demonstrate the normal triphasic pattern reflecting the dynamics of blood flow during the cardiac cycle.6 The normal waveform demonstrates 2 hepatofugal peaks reflecting right atrial filing during ventricular systole and diastole,followed by a hepatopetal peak from retrograde flow into the hepatic veins during atrial contraction. (Figure 4).11
IVC complications are rare, but include stenoses and thromboses at the anastomotic site, and occur more commonly in pediatric populations, retransplantation, and when end-to-end anastomoses rather than “piggyback” anastomoses were employed.2,8 Grayscale depiction of IVC stenosis, which more commonly occurs at the suprahepatic anastomosis, will demonstrate an area of focal narrowing and color aliasing.2,3 A hemodynamically significant stenosis will demonstrate a 3- to 4-fold increase in peak systolic velocity when compared to the prestenotic cava.2,8 Downstream intrahepatic venous waveforms will lose phasicity and demonstrate flattening of the normal triphasic waveform. (Figure 4).3,8 In severe cases, there may be flow reversal in the intrahepatic veins.3,8 Pseudostenosis is often caused by kinking at the vascular pedicle and can mimic a hemodynamically significant stenosis; however, maneuvers such as scanning in expiration, or in the standing position may differentiate between the two.2 IVC thrombosis is uncommon, but when present, also occurs at the sites of anastomosis. Grayscale will demonstrate isoechoic to echogenic intraluminal clot with color images demonstrating partial or absent venous flow.3 Additional secondary signs indicating IVC occlusion include ascites, hepatomegaly, edema, and pleural effusions.2,7 Full liver transplants require evaluation at the site of anastomosisas well as individual interrogation of the right, middle, and left hepatic veins. Normal hepatic venous waveforms demonstrate a triphasic pattern reflecting the various phases of the cardiac cycle. Similar to the IVC, loss of normal phasicity should prompt a search for a suprahepatic IVC narrowing.
Bile duct
Approximately 15% to 25% of liver transplant recipients will experience a biliary complication, and usually within the first 3 months.3,7,8 While cholangiography remains the gold standard for diagnosing biliary complications, sonography is a vital screening tool.
The gallbladder is removed during transplantation; however, it may be common to visualize a cystic duct remnant.3,8 The biliary anastomosisis usually performed in an end-to-end fashion connecting the donor common bile duct to the recipient common hepatic duct, a choledochocholedochostomy, in an attempt to preserve the functionality of the sphincter of Oddi, thus decreasing the risk of enteric reflux.6,7 In instances where the recipient’s common hepatic duct is diseased, absent, or too short, a choledochojejunostomy is performed.6-8 This is also the preferred biliary anastomosis in pediatric patients, in which case resultant pneumobilia is often present.
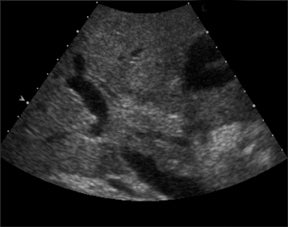
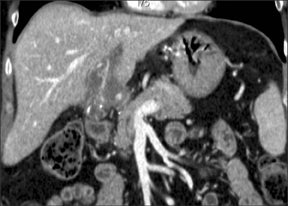
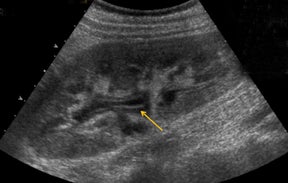
Bile leaks are the most common biliary complications and often present as peritransplant anechoic or hypoechoic fluid collections.8 Biliary strictures most often occur at the site of anastomosis.8 A common duct diameter measuring > 4 mm should raise high clinical concern for a downstream stricture, whether it be from ischemia, rejection, or infection.3 The biliary system in a transplanted liver is dependent purely on the arterial system for vascular supply.7,8 Therefore, areas of bile-duct strictures, dilatation (Figure 5), and leaks, especially remote from the anastomotic site, may indicate biliary ischemia and should prompt a careful survey of the hepatic artery, particularly at the anastomotic site.7,8 It is then imperative to focus the exam to uncover the underlying etiology resulting in the biliary abnormality.
Postoperative fluid collections
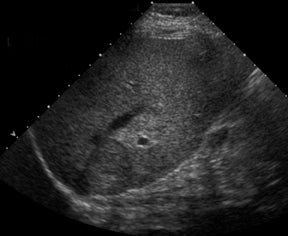
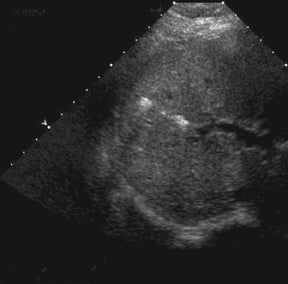
It is common to have several small peritransplant fluid collections or hematomas (Figure 6), which are expected to gradually shrink and resolve within days to weeks.7,8 A transient small right pleural effusion is also a common finding.7 Bilomas, lymphoceles, and abscesses are other considerations.
PTLD
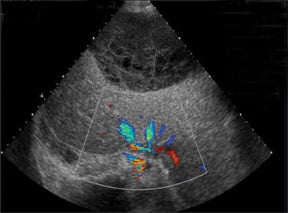
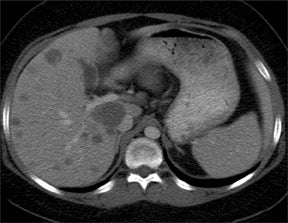
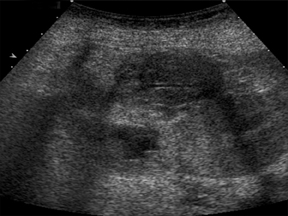
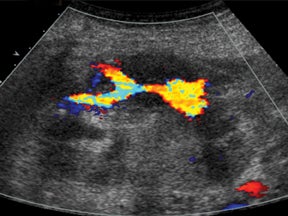
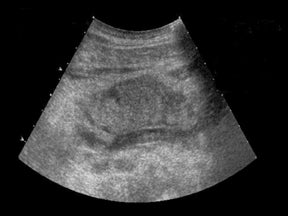
Due to chronic immunosuppression of liver transplant recipients, posttransplantation lymphoproliferative disorder (PTLD), which is often associated with infection from Epstein-Barr virus (EBV), and non-Hodgkin’s lymphoma are becoming more common.3,7 Autoimmune hepatitis and Langerhans cell histiocytosis have been suggested as posing an increased risk of PTLD. The anatomic distribution of PTLDis related to the type of allograft itself. A common spectrum of findings in the liver is focal intraparenchymal masses (Figure 7), ill-defined infiltrative pattern and heterogeneous porta hepatis masses (Figure 8).12 Differential diagnoses for intrahepatic masses in a posttransplant recipient includes abscess, infarction, postsurgical hematoma or contusion, biloma, lymphoma, or carcinoma.
Renal
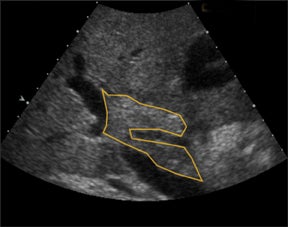
Grayscale evaluation of the renal allograft should begin with size and position of the transplant within the abdomen. Due to its superficial location within the abdomen, fine detail may be more apparent than retroperitoneal native kidneys, such that visualization of cortico-medullary differentiation may be a normal finding.
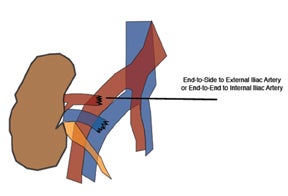
The most common location for the renal allograft is extraperitoneal in the right iliac fossa; however, intraperitoneal (pediatric patients)and contralateral transplants may also be encountered. Cadaveric transplants are often harvested with a portion of the donor aorta, which is anastomosed in an end-to-side fashion to the recipient’s external iliac artery.13 Living related donor transplants are often anastomosed in an end-to-side fashion, which ligates the donor main renal artery to the recipient external iliac artery or an end-to-end fashion to the recipient internal iliac artery (Figure 9). The venous anastomosis is usually an end-to-side connection between the donor main renal vein recipient external iliac vein. The donor ureter is often times implanted into the dome of the recipient bladder, uerteroneocystostomy.13 Variations of these surgical techniques exist in which it becomes important to consult with the surgical team.
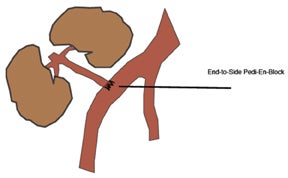
Paired pediatric cadaveric kidney transplants are termed pediatric en bloc (EBK) and are an alternative type of transplantation intended to increase the number of available donors. The donor aorta and inferior vena cava are anastomosed end-to-side to the recipient iliac vessels or in-line with an end-to-end anastomosis between the recipient aorta and IVC and the divided ends of the recipient external iliac artery and veins (Figure 10). Despite higher rates of graft thrombosis than standard adult cadaveric donors (5% versus 1.8%), graft survival rates are similar.14
A small amount of fluid within the renal pelvis can also be expected (Figure 11), allowing for incompetence at the ureterovesicular junction anastomosis and increased urine production by the sole transplant kidney, ultimately producing the same volume of urine produced by two native kidneys.15 When imaging with a full bladder, and fluid is present within the renal pelvis, it is important to reimage the kidney after having the patient void. Fluid that persists extends and distends the infundibula and calyces should prompt a careful survey for the cause of obstruction. Mechanical obstruction most often occurs within the first 6 months and usually involves the distal third of the ureter near the bladder implantation site.13 The possible causes of ureteral strictures or obstruction are numerous and include ischemia, rejection, faulty surgical technique, pelvic fibrosis, extrinsic compression by a pelvic fluid collection, or intrinsic obstruction caused by fungus balls, clot, calculi, and papillary necrosis among others.13
Peritransplant fluid collections are a common postoperative finding, reported in up to 50% of cases.13 The differential diagnosis includes hematoma, seroma, abscess, urinoma, or lymphocele.3 Hematomas and seromas usually present in the immediate postoperative period andare often sonolucent, although internal complexity is common in hematomas. Abscesses usually occur within days 7-10, while lymphoceles develop within months.3,15 Urinomas are rare, but usually occur within the first few weeks and result from the breakdown of the ureterovesicular junction and may form near the bladder apex or cause an intraperitoneal leak.13,15 Regardless of the etiology of the fluid collection,it is important to discern whether there is significant interval increase in size or mass effect upon the allograft and if vascular compromise is evident warranting emergent interventional or surgical exploration and evacuation.
Vascular complications of renal transplants are not uncommon, occurring up to 12% of all cases.3 Normal Doppler interrogation of the intrarenal arteries should demonstrate sharp systolic upstrokes with a slow decay during diastole, and resistive indices < 0.7 (Figure 11).15,16 The acceleration time of the peak systolic velocity should measures < 0.07 sec, with a pulsatility index of < 1.15 The main renal vein should demonstrate a monophasic waveform with lower velocities and minimal respiratory variation (Figure 11).16
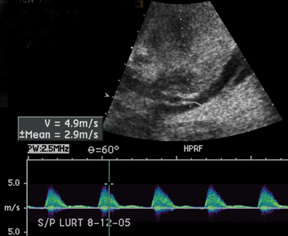
Renal artery stenosis is usually a late complication and most often occurs at the site of anastomosis or just distal to it and often demonstrates an area of turbulence as well as peak systolic velocities > 2 m/s or a peak systolic velocities> 2 times the peak systolic velocity measured in the external iliac artery, proximal to the anastomosis.3,13,15 Spectral waveform findings in the downstream interlobar arteries will often show a tardus-parvus waveform with prolonged acceleration time (> 0.07 sec) (Figure 12) and low resistive indices (< 0.56).13
Renal vein thrombosis is a rare, but serious complication, usually occurring within the first 4 weeks of the postoperative period.3,15 Characteristic findings include visualization of thrombus and absent flow in the main renal vein with swelling of the allograft.3,13 However, secondary signs, such as increased resistance in the arterial waveform, diastolic flow reversal, with preservation of a brisk systolic upstroke,may be the main finding to suggest renal vein thrombosis.3, 13,15-16
Likewise, renal artery thrombosis is also a rare, but serious complication (< 1%) occurring in the immediate postoperative period and can lead to graft loss, if not recognized in a timely manner.16 Grayscale imaging may demonstrate segmental infarcts as ill-defined peripheral hypoechoic areas without detectable color flow.13 Global infarcts will manifest as diffuse swelling of the allograft, which will often appear abnormally hypoechoic and without detectable color flow.13
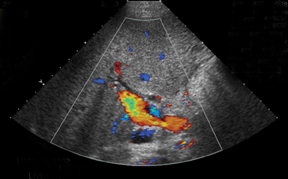
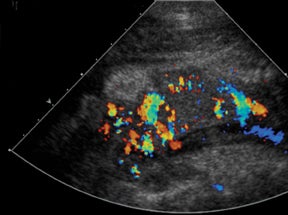
Similar to hepatic allografts, renal pseudoaneurysms can be either intraparenchymal, often a complication of a prior percutaneous biopsy, or extrarenal, usually at the site of anastomosis or sequelae of infection.3 Color Doppler will demonstrate the “yin-yang” and “to-and-fro” flow at the pseudoaneurysm neck (Figure 13).15
Arteriovenous fistulas are another postbiopsy complication. These are almost exclusively diagnosed on color Doppler imaging with the presence of aliasing color flow, high velocity, low-resistance arterial spectral waveforms, and arterialization of the venous waveform, which persists even on high Doppler scale settings (Figure 14).3,13,15-16
The diagnosis of allograft rejection on ultrasound is often an elusive one and may be deferred to the clinical history as well as a percutaneous biopsy. However, certain sonographic grading criteria exists in the attempt to elucidate the potential of transplant rejection based on grayscale and color Doppler findings, such as allograft swelling, loss of renal sinus fat, prominence of medullary pyramids, pelvi-infundibular wall thickening (Figure 15), and elevated resistive indices.17 In addition, Doppler analysis may reveal elevated resistive indices > 0.8, and sometimes even reversal of diastolic flow.13 These Doppler findings can also be seen in the setting of vascular thrombosis, acute tubular necrosis (ATN), and drug nephrotoxicity. Lack of arterial or venous flow will confirm the diagnosis of vascular thrombosis. ATN is common in the early postoperative period and almost exclusively occurs with cadaveric allografts. A differentiating feature from acute rejection is that ATN gradually resolves over the first few weeks, whereas acute rejection often peaks within the first 3 weeks of the postoperative period. Tissue sampling is necessary to distinguish between these 2 entities.
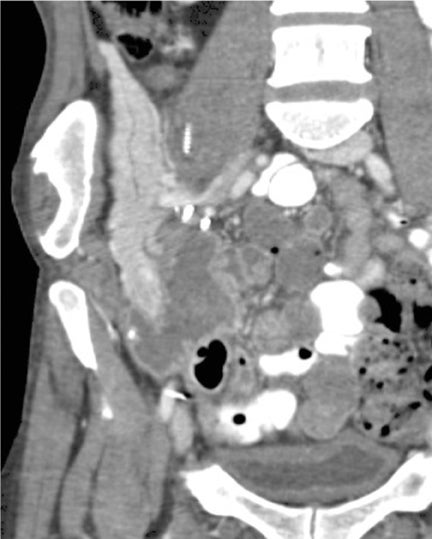
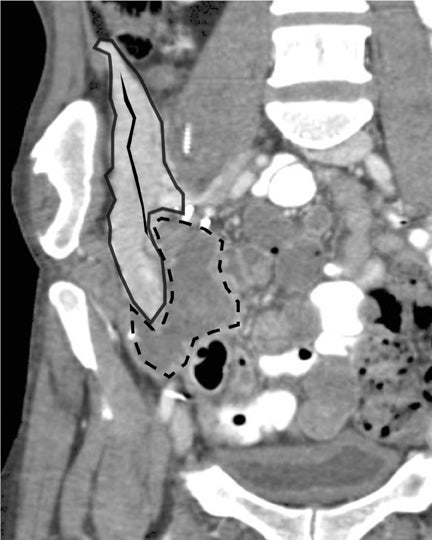
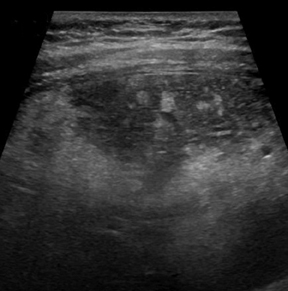
Prolonged immunosuppression often places the recipient at risk for development of malignancy, including renal cell carcinomas and urothelial malignancies, as well as lymphoma and post transplant lymphoproliferative disease (PTLD).13 The development of a suspicious solid intrarenal mass (Figure 16) should raise concern for any one of these complications. PTLD in renal transplant populations will often manifest as pathologic lymphadenopathy; however, PTLD can infiltrate the allograft parenchyma or present as a heterogeneous mass surrounding vessels in the renal hilum, which can lead to vascular compromise.13
Pancreas
More than 35,000 pancreas transplants had been performed worldwide as of December 201018 in diabetic patients. Pancreas transplants are categorized as simultaneous pancreatic kidney transplant (SPK) in those with concomitant end-stage renal nephropathy (75%), pancreas transplantation after previous kidney transplant (PAK) (18%), and pancreas transplant alone (PTA) (7%).18
Sonographic evaluation of the pancreatic transplant begins with grayscale imaging of the allograft and is usually the first-line modality in the evaluation for clinically suspected graft dysfunction. The pancreatic allograft is typically placed in the extraperitoneal right iliac fossa and renal allograft placed in the extraperitoneal left iliac fossa for SPK (Figure 17).
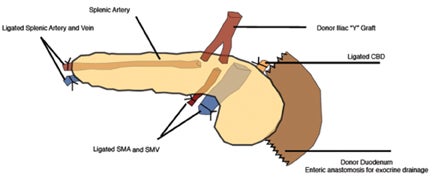
Prior to 1995, 90% of all pancreas transplants had pancreatic exocrine drainage via the bladder. Exocrine bladder drainage has the advantage of being able to follow urine amylase as a nonspecific rejection marker especially for solitary pancreatic transplants, PAK and PTA, where serum creatinine cannot be followed for rejection as in SPK. However, alkaline pancreatic excretions can result in metabolicacidosis in addition to urologic complications such as graft pancreatitis from reflux and urinary tract infections. The more physiological enteric pattern of exocrine drainage is currently the most commonly used whereby the allograft exocrine duct drains via an end-to-side or side-to-side anastomosis between donor duodenum and recipient jejunum.
The arterial anastomosis involves creating a donor iliac Y-graft to the donor splenic and superior mesenteric arteries which are the anastomosed in an end-to-side fashion to the recipient right common iliac artery or external iliac artery (Figure 18).
The predominant method of pancreatic venous drainage utilizes systemic venous drainage (SVD) with forming an anastomosis of the donor portal vein in an end-to-side fashion to the recipient right external iliac vein.19 The distal aspects of the donor splenic and superior mesenteric vessels are blind ending. Alternative portal venous drainage (PVD) connects the donor portal vein to the recipient superior mesenteric vein or its major branch vessel, which creates a more physiologic efflux of insulin towards the liver. No significant long-term differences have been seen in SVD versus PVD.20
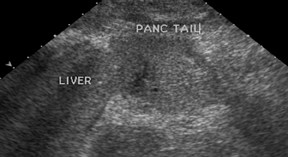
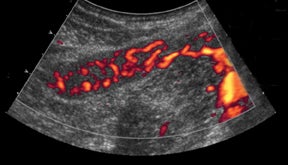
If there is a living donor segmental graft, it comprises the pancreatic body and tail. The donor splenic artery and vein are anastomosed to the recipient external iliac vessels. Exocrine drainage can be done via bladder anastomosis or enteric Roux-en-Y loop to the graft.21 The normal pancreatic allograft is homogeneous and hypoechoic to the surrounding fat (Figure 19). Color Doppler and power Doppler increase detection of intraparenchymal and anastomotic vasculature. The majority of graft failures in the first 6 months are due to technical factors, such as vascular thrombosis, infection, anastomotic leak, or bleeding. Acute rejection typically occurs between 6 and 12 months and chronic rejection12 months after transplantation.22
Rejection can be seen as a swollen allograft and parenchymal heterogeneity. Ultrasound has a limited role in the diagnosis of acute rejection due to a wide range of sensitivities, 13% to 82%.23-24 These imaging features are nonspecific, as they can also be seen with pancreatitis and vascular thrombosis. No specific serum marker has yet to be found which can distinguish between these entities. And unlike renal transplantation, no reliable resistive index measurement has been established for acute rejection in pancreatic transplantation. Sonographically-guided pancreatic allograft biopsy has been shown to be superior to both grayscale and spectral Doppler findings in the diagnosis of rejection.23
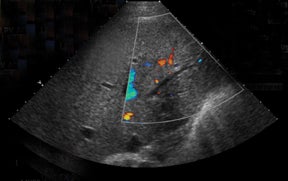
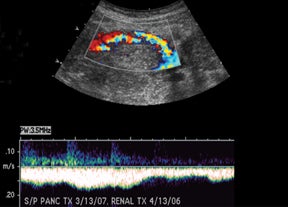
The most common cause of vascular-transplant dysfunction is vascular thrombosis, venous slightly greater than arterial.25-26 Clinically,patients may have hyperglycemia, graft pain, and hyperamylasemia. The blind-ending distal splenic and superior mesenteric stumps are prone to thrombosis, which necessitates careful documentation of patency or evaluation for extent of clot burden, since thrombosis is the most common cause for early graft failure.25 The lack or decrease of color flow, absence of appropriate spectral tracings, and visualization of echogenic intraluminal thrombus (Figure 20) lead to the diagnosis of vascular occlusion. Reversal of diastolic flow in the pancreatic transplant arteries is highly specific for venous thrombosis.27 Venous clots can propagate to occlude draining vessels and can be treated with anticoagulation, catheter-directed pharmacologic thrombolysis/mechanical thrombectomy, or surgical thrombectomy. Slow flow in the splenic vein through the graft can cause a pseudothrombosis appearance. Recognition of this entity and further evaluation with Doppler or delayed contrast-enhanced CT can help avoid this pitfall.28 Short-segment peripheral thrombi can be seen and do not necessarily require treatment.
Contrast-enhanced MRA has had some promising results for diagnosing vascular complications. However, the role of MRI may be limited as the pancreas transplant population with its high rate of concomitant renal morbidity is at risk for gadolinium-induced nephrogenic systemic fibrosis. Additional vascular complications include anastomotic turbulent flow or elevated velocities indicative of stricture, pseudoaneurysm with swirling color pattern and turbulent to-and-fro spectral tracing, and postbiopsy arteriovenous fistulas.
Postsurgical peritransplant fluid collections may represent hematomas, pseudocysts, abscesses, seromas, urinary leaks, ascites, or anastomotic leaks. These appear as anechoic or complex fluid collections.
Long-term PTLD in pancreas transplants is associated with Epstein Barr virus infection and ranges from benign B-cell hyperplasia to malignant lymphoma. The incidence is highest in the first year and seen in up to 6% of patients from a series of 212 recipients.29 The greatest number affected were those who underwent solitary pancreas transplant, PAK or PTA, over SPK. Patients present with nonspecific symptoms, including malaise, fevers, chills, mild elevation of pancreatic enzymes, nausea, and vomiting. The findings of PTLD typically manifest in the allograft, either alone or with additional extra-allograft findings, and rarely extra-allograft only. PTLD may manifest as diffuse or focal allograft enlargement, extra-allograft lymphadenopathy, and rarely or ganomegaly.30 These findings are nonspecific as they can are also seen in rejection and overlap temporally in presentation.
Islet cell transplantation
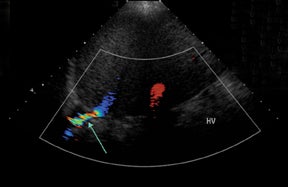
Islet cell transplantation has an emerging role in the treatment of type I diabetes in those with severe recurrent hypoglycemia associated with unawareness and early secondary complications refractory to medical management. Between 1999 and 2008, there were 412 recipients of islet cell transplantations.31 The most successful islet cell transplantation with respect to insulin independence is the Edmonton protocol,whereby highly purified cadaveric donor islet cells are infused through a cannula into the main portal vein via a percutaneous anterior or midaxillary puncture of a branch right portal vein performed under fluoroscopy. After delivery, the hepatic tract is embolized with a variety of materials, including coils, fibrin glue, and gelatin sponge, to minimize the risk of hemorrhage. Posttransplant imaging demonstrates anechogenic linear tract along the embolization path (Figure 21). The protocol also calls for a potent steroid-free immunosuppression protocol of dacluzimab, sirolimus, and tacrolimus.32
The most common early complication is hemorrhage, either hepatic subcapsular or parenchymal, or bleeding into the peritoneal or pleural spaces. Second most common complication is portal venous thrombosis, which is seen as echogenic thrombus, typically in a right portalvein branch, with decreased or lack of color flow and absent venous spectral pattern. Less common complications include arteriovenous fistulas, trauma to the adjacent biliary system, and interruption of the pleura.33
Interestingly, a late complication seen after 6 months is the development of periportal hepatic steatosis without steathohepatitis.34-35 Periportal echogenities (Figure 22) develop representing microvesicular fat and are seen on MR as signal drop off on opposed-phase imaging. It is thought to be a benign local effect of insulin from grafted islet cells and is not associated with graft dysfunction. Long-term immunosuppression afte rislet transplantation has also resulted in a significant percentage of premenopausal females (70%) developing sirolimus-associated ovarian cysts with a mean ovarian cyst size of 6 cm.36 Some of these cysts can be symptomatic leading to pelvic pain from torsion or rupture. Withdrawal of sirolimus results in regression of cyst size.
Conclusion
As the number of abdominal transplants increases, knowledge of transplant anatomy and timely recognition of complications are imperative to increase transplant survival and decrease unnecessary procedures. Ultrasound remains the modality of choice in most institutions and determines the need for intervention or further evaluation with CT or MRI.
References
- US Department of Health and Human Resources. Organ procurement and transplantation network website. http://optn.transplant.hrsa.gov. Accessed December 20, 2011.
- Vaidya S, Dighe M, Kolokythas O, Dubinsky T. Liver transplantation: Vascular complications. Ultrasound Q. 2007;23:239-253.
- Little AF, Dodd G. Postoperative sonographic evaluation of the hepatic and renal transplant patient. Ultrasound Q. 1995;13:111-119.
- Wozney P, Zajko AB, Bron KM, et al. Vascular complications after liver transplantation: A 5 year experience. AJR Am J Roentgenol. 1986; 147: 657-663.
- Flint EW, Sumkin JH, Zajko AB, Bowen A. Duplex sonography of hepatic artery thrombosis after liver transplantation. AJR Am J Roentgenol. 1988;151: 481-483.
- Brody M, Rodgers SK, Horrow MM. Spectrum of normal or near-normal sonographic findings after orthotopic liver transplantation. Ultrasound Q. 2008;24:257-265.
- Quiroga S, Sebastia MC, Margarit C, et al. Complications of orthotopic liver transplantation: Spectrum of findings with helical CT. Radiographics. 2001;21:1085-1102.
- Nghiem HV, Tran K, Winter TC, et al. Imaging of complications in liver transplantation. Radiographics.1996;16:825-840.
- Chen W, Facciuto ME, Rocca JP, et al. Doppler ultrasonographic findings on hepatic arterial vasospasm early after liver transplantation. J Ultrasound Med. 2006;25:631-638.
- Quiroga J, Colina I., Demetris AJ, et al. Cause and timing of first allograft failure in orthotopic liver transplantation: A study of 177 consecutive patients. Hepatology. 1991;14:1054-1062.
- Shin D, Jeffrey R., Desser T. Pearls and pitfalls in hepatic ultrasonography. Ultrasound Q. 2010;26: 17-25.
- Borhani AA, Hosseinzadeh K, Almusa O, et al. Imaging of posttransplantation lymphoproliferative disorder after solid organ transplantation. Radiographics. 2009;29:981-1000.
- Park SB, Kim J., Cho KS. Complications of renal transplantation ultrasonographic evaluation. J Ultrasound Med. 2007;26:615-633.
- Bhayana S, Kuo YF, Madan P, et al. Pediatric en block kidney transplantation to adult recipients: More than suboptimal? Transplantation. 2010;90:248-254.
- Cosgrove DO, Chan KE. Renal transplants what ultrasound can and cannot do. Ultrasound Q. 2008;24:77-87.
- Gao J, Ng A, Shih G, et al. Intrarenal color duplex ultrasonography: A window to vascular complications of renal transplants. J Ultrasound Med. 2007;26:1403-1418.
- Townsend RR, Tomlanovich SJ, Goldstein RB, Filly R. Combined Doppler and morphologic sonographic evaluation of renal transplant rejection. J Ultrasound Med. 1990; 9:199-206.
- Gruessner AC. 2011 update on pancreas transplantation: Comprehensive trend of 25,000 cases followed up over the course of twenty-four years at the International Pancreas Transplant Registry (IPTR). Rev Diabet Stud. 2011; 8:6-16.
- Nikolaidis P, Amin RS, Hwang CM, et al. Role of sonography in pancreatic transplantation. Radiographics. 2003;23:939-949.
- Lo A, Stratta RJ, Hathaway DK, et al. Long term outcomes in simultaneous kidney-pancreas transplant recipients with portal-enteric versus systemic-bladder drainage. Transplant Proc. 2001;33:1684-1686.
- Han DJ, Sutherland DE. Pancreas transplantation. Gut Liver. 2010;4:450-465.
- International pancreas transplant registry. http://www.med.umn.edu/iptr. Accessed November 15, 2011.
- Wong J, Krebs T, Klassen D, et al. Sonographic evaluation of acute pancreatic transplant transplant rejection: Morphology-doppler analysis versus guided percutaneous biopsy. AJR Am J Roentgenol. 1996;166:803-807.
- Yuh WTC, Wiese JA, Abu-Yousef MM, et al. Transplant imaging. Radiology. 1988;167:679-683.
- Norman SP, Kommareddi M, Ojo AO, Luan FL. Early pancreas graft failure with inferior late clinical outcomes after simultaneous kidney-pancreas transplantation. Transplantation. 2011;92:796-801.
- Troppmann C, Gruessner AC, Benedetti E, et al. Vascular graft thrombosis after pancreatic transplantation: univariate and multivariate operative and nonoperative risk factor analysis. J Am Coll Surg. 1996;182:285-316.
- Foshager MC, Hedlund LJ, Troppmann C, et al. Venous thrombosis of pancreatic transplants: Diagnosis by duplex sonography. AJR Am J Roentgenol. 1997;169:1269-1273.
- Gupta R, Rottenberg G, Taylor J. Pseudothrombosis of the iliac vein in patients following combined kidney and pancreas transplantation. Br J Radiol. 2002;75:692-694.
- Issa N, Amer H, Dean PG, et al. Posttransplant lymphoproliferative disorder following pancreas transplantation. Am J Transplant. 2009;9: 1894-1902.
- Meador TL, Krebs TL, Cheong JJ, et al. Imaging features of posttransplantation lymphoproliferative disorder in pancreas transplant recipients. AJR Am J Roentgenol. 2000;174:121-124.
- Collaborative islet transplant registry. http://www.citregistry.org. Accessed November 15, 2011.
- Shapiro AM, Lakey JR, Ryan EA, et al. Islet transplantation in seven patients with type I diabetes mellitus using a glucocorticoid-free immunosuppressive regimen. N Engl J Med. 2000;343: 230-238.
- Low G, Hussein N, Owen RJ, et al. Role of imaging in clinical islet transplantation. Radiographics. 2010;30:353-366.
- Markmann JF, Rosen M, Siegleman E, et al. Magnetic resonance-defined periportal steatosis following intraportal islet transplantation: A functional footprint of islet graft survival? Diabetes. 2003;52:1591-1594.
- Ryan EA, Lakey JR, Rajotte RV, et al. Clinical outcomes and insulin secretion after islet cell transplantation with the Edmonton protocol. Diabetes. 2001;50:710-719.
- Alfadhli E, Koh A, Albaker W, et al. High prevalence of ovarian cysts in premenopausal women receiving sirolimus and tacrolimus after clinical islet transplantation. Transpl Int. 2009;22:622–625.