CT angiography of the lower extremities
Images
Dr. Rubin is an Associate Professor of Radiology and Section Chief of Cardiovascular Imaging, and Dr. Fleishmann is an Assistant Professor of Radiology at Stanford University School of Medicine, Palo Alto, CA.
Computed tomography (CT) is a simple and robust method for evaluating the peripheral arterial system and for diagnosing peripheral arterial disease. Advances in technology and variability in patient physiology make contrast administration challenging, however. This article will review patient preparation for CT angiography (CTA) of the lower extremities, as well as optimal scanner settings, contrast administration, and visualization techniques.
The essentials
A multirow scanner is essential for CTA of the lower extremities; however, the number of detector rows the scanner is equipped with (4, 8, or 16) is of less importance. In fact, all of the clinical studies of lower-extremity CTA reported in the scientific literature to date have been conducted on 4row scanners, with impressive results. 1-5
Several very practical details are important in ensuring the success of lower-extremity CTA. It is recommended that tape be used to keep the patient's knees and feet together. (Usually, at our institution, we wrap a pillowcase or towel around the knees and feet first.) Without tape, the patient's natural inclination is to let the knees fall away from one another. If that happens, the field-of-view in the reconstruction must be opened substantially in order to include the proximal anterior tibial arteries, and in-plane resolution is lost. The patient must not have a pillow under the knees, however, as the arterial system will move up and down relative to the table, which creates a similar problem for the reconstruction field-of-view.
The patient should be positioned near the isocenter of the scanner. Centering the patient provides the best in-plane and through-plane resolution for visualizing what are frequently very tiny vessels.
We use a 20-gauge antecubital intravenous line for contrast delivery, and nonionic iodinated contrast material. The scanning range for most studies is from the celiac artery through the toes, a total of 105 to 130 cm, depending on the height of the patient. The entire study takes about 20 minutes to perform. Three-dimensional (3D) visualization is essential. Volume renderings, maximum intensity projections (MIPs) and curved planar reformation (CPRs) are all useful visualization methods.
Scanner settings
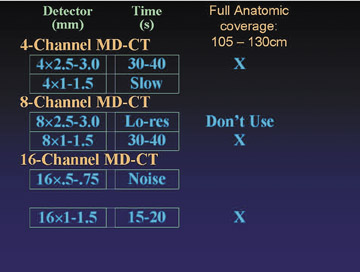
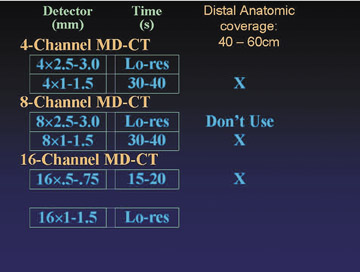
There are a range of approaches to image acquisition, depending on the detector configuration and the desired coverage. Full anatomic coverage, from the celiac arteries through the toes (105 to 130 cm), is generally indicated for the evaluation of atherosclerotic occlusive disease. More limited distal coverage (40 to 60 cm) is typically indicated prior to reconstructive surgery, including fibular transfer grafts and pectoral flap mobilization for revascularization of an area of osteomyelitis or tissue injury secondary to trauma.
Figure 1 describes available detector configurations for full anatomic coverage, using a 4-, 8-, or 16-row scanner. In each case, only 1 configuration emerges as an acceptable choice. For example, with a 4-channel scanner, a 2.5- to 3.0-mm collimation will accomplish the study in 30 to 40 seconds, whereas a 1.0- to 1.5-mm collimation will result in an unacceptably slow image acquisition. With an 8-channel scanner, by comparison, a detector collimation of 2.5 to 3 mm is seldom used, because a higher-resolution alternative is available (8 × 1.0 to 1.5 mm). With the 16-row scanner, a 0.5- to 0.75-mm collimation results in excessive image noise, particularly in the abdomen and pelvis. A 1.0- to 1.5-mm collimation accomplishes the study in 15 to 20 seconds, with an acceptable noise level.
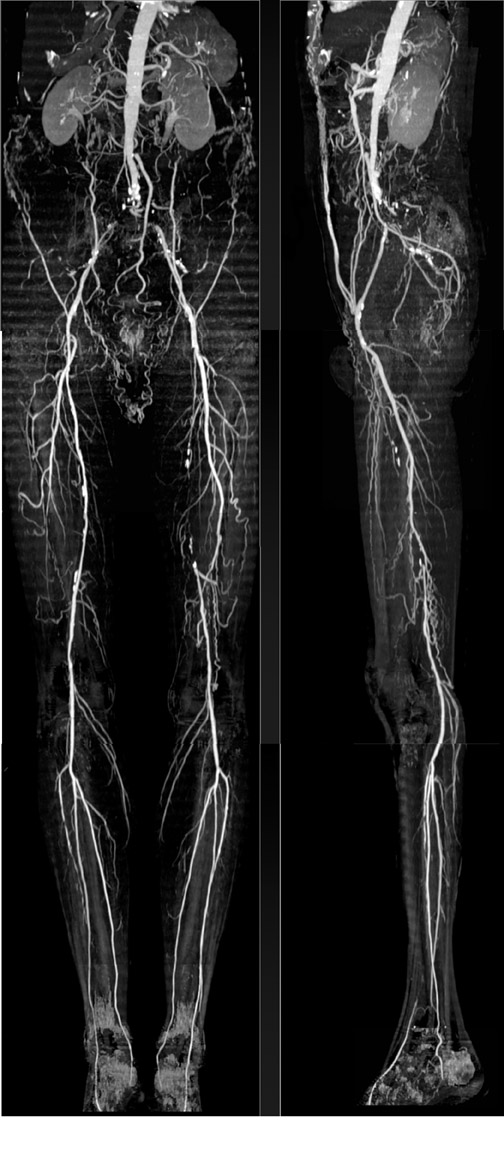
Figure 3 shows a full-coverage acquisition from above the celiac arteries through the feet, using a 4 × 2.5-mm detector collimation. The patient had claudication, and femoral pulses were absent. The scan reveals occlusion of the distal abdominal aorta, proximal common iliac, and left superficial femoral arteries, with extensive collateralization reconstituting the lower extremity arterial system.
The study took approximately 70 seconds to complete. With 2.5-mm-thick sections, the vessels are a little less distinct than they are with thinner sections, but image quality is more than adequate for making important observations on vessel patency and stenosis, and for guiding routine therapy.
Figure 4 demonstrates a study of distal anatomy, acquired with a 4-row scanner and a 1.5-mm detector collimation. This patient had osteomyelitis and was preparing to undergo surgery to revascularize the distal calf. The MIPs depict the arterial system with the intricate detail necessary for surgical planning.
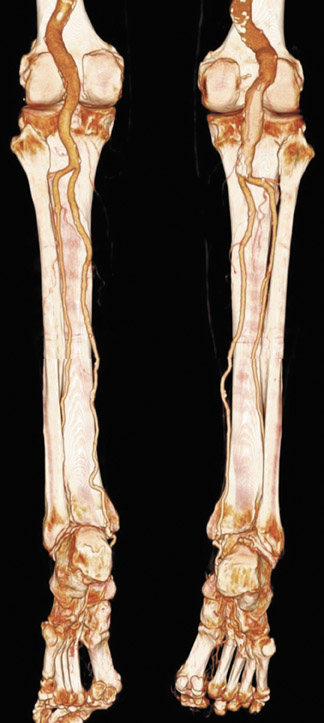
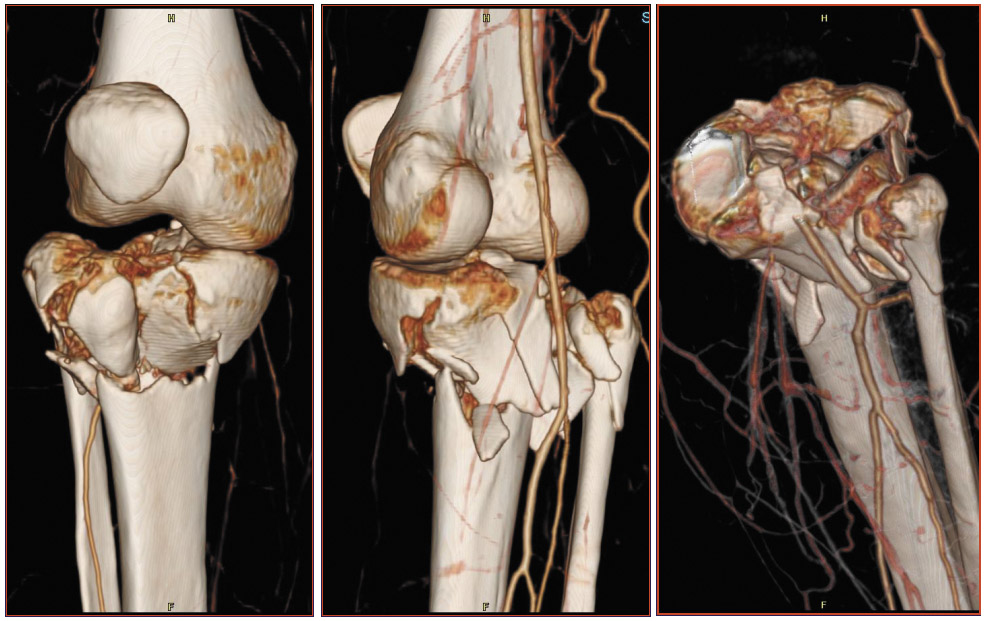
The images in Figure 5 were acquired with 16-row scanner and a 0.625-mm detector collimation. In this patient with a tibial plateau fracture, CTA was performed to determine whether the popliteal artery had been injured. There is no occlusion and no extravasation of contrast material. Such studies have become a common application of CTA in our practice.
Contrast delivery
For all their advantages, fast scan acquisitions can complicate contrast delivery. Table 1 outlines three protocols we have used for peripheral runoff studies performed on 4-, 8-, and 16-row scanners. A total of 89 patients are represented. (Unpublished data.) There is an almost 4-fold reduction in image acquisition time when comparing a 4-row scanner with a 16-row scanner. Enhancement is not nec
essarily better with the 16-row scanner, however. Defined as the average arterial attenuation from the aorta to the feet, enhancement increases substantially when going from a 4-row to an 8-row scanner, because contrast delivery is much faster. Similarly, contrast efficiency, defined as average enhancement divided by the iodine load and normalized to the coverage distance, goes up by about 50%.
Contrast efficiency improves further with the 16-row scanner. Average attenuation drops, however, because there is not as much time for the contrast bolus to fully develop and opacify the vessels. Whether such differences in attenuation affect the accuracy of diagnosis or clinical management decisions is yet to be determined.
Certain aspects of contrast utilization are unique to imaging the peripheral vasculature. A separate study, as yet unpublished, by Dominik Fleischmann, MD, at our institution, examined peripheral arterial enhancement in 20 patients with peripheral arterial occlusive disease.
After injecting a small test-bolus, Fleischmann observed an aortic contrast transit time of 14 to 28 seconds, with a mean of 20 seconds-standard findings for aortic CTA. To measure the contrast transit time between the aorta and the popliteal artery, he injected a second contrast bolus and documented its arrival in the popliteal artery. The aortopopliteal transit time averaged 10 seconds, representing an average contrast flow rate of 65 mm/sec. There was substantial variability among patients, however, with a minimum of 4 seconds (177 mm/sec) and a maximum of 24 seconds (30 mm/sec)- almost a 4-fold difference. What is intriguing is that it confirms angiographic experience, as there was no correlation between contrast flow rate and clinical stage of disease. Therefore, contrast transit times are not predictable by any means other than direct measurement.
Table 2 presents the effect of contrast flow rates on scanning parameters. With a slower scan (detector collimation: 4 × 2.5 mm, 8 × 1.25 mm, or 16 × 0.625 mm), table speed is 30 mm/sec. The time it takes to scan from aorta to ankle, or a distance of about 1200 mm, is 40 seconds. In a patient with a low blood flow rate (30 mm/sec), contrast flows in perfect synchrony with the table speed. In a patient with an average blood flow rate, however, contrast flow from aorta to ankle outpaces the table speed. The contrast bolus must be at least 22 seconds long to ensure that opacification is still adequate as the foot is being scanned. In a patient with a fast blood flow rate (177 mm/sec), the contrast bolus must be at least 33 seconds in length.
With faster scans (detector collimation: 8 × 2.5 mm or 16 × 1.25 mm), the time it takes to scan from aorta to ankle is only 20 seconds. In a patient with a slow blood flow rate, the scanner can outrun the contrast bolus, rather than lagging behind it. In some patients, this has created a challenge when attempting to examine vessels in the feet using a 16 × 1.25-mm detector collimation. In such cases, it is necessary to wait 20 seconds after contrast arrival in the aorta to begin the scan, so that the vessels of the feet are opacified at the time of data acquisition. (The goal is to image the tail of the bolus in the abdomen and the head of the bolus in the feet).
Because there is substantial and unpredictable variability among patients in lower-extremity flow rates, the best approach appears to be the use of a long contrast bolus-30 to 35 seconds-in all cases. In short, bolus duration is driven not by the speed of the scan but by the need to ensure that the entire arterial system, from aorta to feet, is opacified at the time of image acquisition.
Determining the optimal time to begin image acquisition is more complex than merely fitting the contrast bolus into the scan range, however. It may not be desirable to image just as the bolus arrives. The intensity of enhancement builds up over time, so the distal end of the bolus is far more enhancing than it is at the proximal end. 6
How the scan will be triggered is another important consideration in determining how much contrast to deliver. There are two fundamental ways to determine the delay from venous injection of contrast material to enhancement of the abdominal aorta. The first is to use a preliminary test bolus. With this approach, the time to peak contrast enhancement directly measures contrast medium transit time. Direct bolus triggering is the other approach. Automated or visual detection of contrast arrival, defined by a predetermined attenuation threshold, triggers scanning.
The length of the contrast bolus will depend on whether scan timing is determined by a test bolus or bolus triggering. Assume that a 30- to 35second injection is needed to ensure adequate opacification of the entire periphery in the majority of patients. That bolus size will be sufficient if scan timing is determined by a preliminary test injection. A longer bolus will be necessary, however, if scan timing is determined by bolus triggering, because of the delay between the time of contrast arrival at the abdominal aorta and the actual triggering of the scan. This delay varies from one scanner to another, but it can be up to 8 seconds. If the delay is 8 seconds, then a 38- to 43-second contrast bolus will be needed.
With fast scanning, scanning should be delayed by 20 seconds, even if a test bolus or bolus triggering is used. (It is not necessary to add 8 seconds to the bolus length to account for the delays associated with bolus triggering, however.) The benefit of the 20-second delay is that imaging takes place later in the rising contrast enhancement curve, which potentially results in more homogeneous and intense opacification throughout the acquisition.
A further complication of contrast delivery is that blood flow in the legs may be asymmetric if, for example, there is a tight stenosis or aneurysm on only one side. In such cases, use of an even longer contrast bolus may be warranted.
Venous opacification may make it more difficult to evaluate the arterial system in certain cases. Early venous opacification almost always occurs in cases of ipsilateral inflammation, resulting from cellulitis or ischemic ulceration. Both are common in patients with peripheral vascular disease. Occasionally, venous opacification is attributable to spontaneous arteriovenous shunting, which in patients with atherosclerotic occlusive disease is likely due to plaque rupture in small vessels.
Visualization techniques
Maximum-intensity projections provide a useful overview of the peripheral vessels. To effectively use MIPs in the periphery, however, bone must be edited out. This is a time-intensive endeavor, although tools are becoming available to make it more efficient. In addition, calcification can obscure underlying vessels.
Curved planar reformations are longitudinal sections along the length of the vessel. A CPR enables visualization of both soft and hard plaque and is especially useful in cases of circumferential calcium, where it permits examination of the lumen adjacent to the calcium, including regions of stenosis. In addition, no bone editing is necessary.
A CPR does not provide as good an overview of the peripheral vasculature as does the MIP, however. In addition, this technique is insufficient unless window and level settings are optimized. When evaluating calcification in peripheral arteries, for example, it is important to use a bone window to avoiding "blooming" and overestimation of calcification size. In very small vessels, such as the peroneal artery, even a CPR may not be able to discriminate arterial lumen from calcification.
Conclusion
CT has become a simple and robust method for assessing the peripheral arterial system and diagnosing peripheral arterial disease. Optimization of contrast administration is increasingly challenging as scanner speeds increase. New ways to evaluate each patient's circulatory physiology and compensate for it when administering contrast material are needed.
Advances in scanner speed are unlikely to reduce the volume of contrast used during examination of the peripheral vascular system but will improve image resolution. Finally, additional detector rows create additional data to analyze. We must continue to find more effective and automated ways to manipulate and process such large data sets.
Discussion
LEO P. LAWLER, MD, FRCR: Geoff, thank you; it was a very good talk. I agree that nothing exposes our deficiency in terms of our understanding of contrast dynamics as much as multidetector CT. It seems to me, however, that as we go forward with peripheral vascular imaging, it will require some way of knowing what the Hounsfield units are doing both in the arteries and the veins as you scan, knowing what is happening both proximally and distally. Then, somehow, you could feed that back to the table pitch. That seems to me the only way forward to stop venous contamination and to make sure asymmetric inflow disease is imminent. What are your thoughts?
GEOFFREY D. RUBIN, MD: With respect to venous contamination, I think we are in much better shape with CT than with MR. It seems to me that venous contamination typically only occurs in a pathologic setting in which we have abnormal arteriovenous shunting. In many respects, I like to be able to know that it is there and to see it. So I am not sure that it is a big problem moving forward.
But what you have said about being able to somehow detect and compensate for the variations in flow is very, very intriguing. The question is, can we really do that on the fly? We know that what is happening at the injector will influence local arterial opacity sometime, perhaps 20 seconds, in the future at least; in some cases, even more. I am not absolutely certain that there is a way that we can monitor the progression of the injection and feedback to have any effect on the scan. But, I do wonder if there are routines that we might develop to preliminarily test a person's circulation, to spot-check the aorta or the popliteal artery. Then we could use that to come out with the appropriate strategy. But, at this stage, that is a rather cumbersome thing to do.
Nevertheless, I think it should be our goal to develop an algorithmic approach to at least understand these contrast dynamics. If we do know what these aortopopliteal transit times are, then we should understand the optimum way to deliver contrast for that individual.
LAWLER: It is a very small area and it is highly selective. So, perhaps, it is not a major issue for a lot of people. But I do think the question really arises in cases such as in the posttraumatic leg that is hyperemic or perhaps if they are going to fix an ulcer with a free flap. This is reflected by the lack of literature below the calf: the question is: Can I sacrifice this vessel to make a free flap? I think you would be very courageous to make that decision when you have venous contamination, and you cannot confidently say that all three vessels running into the foot are clearly open.
RUBIN: It has been our experience that, even in the setting of venous contamination, we always look at the transverse sections and we believe we can visualize arterial anatomy in spite of venous contamination. We have a paper submitted specifically addressing those issues. The surgical plan was always in agreement with what was demonstrated on imaging, and the outcomes of the operations were viable at least 3 months down the line, which suggests that CT does adequately provide the information.
However, in particular, in acutely traumatized patients in whom there is massive soft-tissue injury, you can see remarkable venous opacification, particularly in the upper extremities. I think there we see more venous contamination than in the legs, and it really just requires some diligence to examine the transverse sections and mentally filter out the veins. As long as you are paging through, it works pretty well. But you are right, the volume renderings can be very confusing.
U. JOSEPH SCHOEPF, MD: I believe the images that you show are much more impressive than anything that we have available with MR these days, for example. But where exactly do you see CT as opposed to MR in its indication for doing that kind of study?
RUBIN: Right now it is pretty clear that the rate of voxel acquisition for an equally sized voxel on CT is far outstripping MR. As I have indicated, we are getting to the point at which CT may be getting too fast and we have to wait for the bolus anyway. I think MR's great hope right now is the successful development of parallel imaging, which is going to require more widespread use of higher field-strength magnets, like 3T. A high field-strength magnet will compensate for the signal-to-noise limitations that come about from parallel imaging while allowing for the improved spatial resolution that is possible with parallel imaging.
So, who knows? If there is widespread deployment of 3T MR scanners or maybe higher field-strength scanners and successful implementation of parallel imaging, then maybe MR will give images like this. But at this stage, you are right. We try to do peripheral MRA as frequently as possible, but at this stage, CTA is almost always a better quality study.
SCHOEPF: Also, I was really intrigued by the data that you showed on hemodynamics in the lower extremity runoff studies. One of the arguments that is brought against the use of CT, over digital subtraction angiography, for example, is exactly that point, that you are not able to visualize or assess a phenomenon, such as arterial inflow, to determine whether the lesion within the lower runoff is really hemodynamically significant. Do you believe that some of those developments might come in handy to overcome those limitations?
RUBIN: In general, what our vascular surgeons like to repeatedly remind us is that they treat patients, not scans; or they treat patients, not angiograms. Therefore, they are going to perform bypass on a patient based on that patient's symptoms. They know that if there appears to be a high-grade stenosis downstream and there is a high-grade stenosis upstream, they need to fix them both. Otherwise, their graft is ultimately going to be less viable and potentially thrombose.
So these issues of using the contrast dynamics in the setting of occlusive disease to lead to treatment have been less relevant for us. There are situations, such as in arterial venous fistulae, which obviously are very specialized. In those cases, the contrast dynamics may be more useful. As we move ahead to 64-row CT scanners, chances are, we will be able to park ourselves at the nidus of an arteriovenous malformation and really ob-serve these sorts of phenomena. But I do not think that comes up very frequently at this stage.
ELLIOT K. FISHMAN, MD: At least in my experience with peripheral imaging of both upper and lower extremities, saline chasers have worked really well. I think it really helps in terms of getting good homogeneous opacification, especially of the lower extremities. Do you have any experience doing that?
RUBIN: Yes. We are using saline chasers on the dual-chamber injector. Although, I must say that I do not have a really good intuition that our opacification is any more homogeneous. Typically, what it does is prolong the bolus, which gives us a little more usable bolus.
I am not sure that homogeneous opacification is necessarily what we are after here in the periphery. In a sense, the proximal vessels are big and the distal vessels are small and are more susceptible to volume averaging. So, in some respects, I think it is a good thing that the vessels get brighter as you go along, because you have a harder time detecting small vessels than you do big ones. I am sure that using a saline chaser is an advantage. It is definitely an advantage to return pooled contrast in the veins into the central circulation. I think we need more investigation as to what ultimate impact it has on the quality of the CTA data set.
FISHMAN : Right, but I think it has made a very big difference in terms of getting smaller vessels in, say, the legs. We have been using a 50 mL saline chaser. That seems to have made a major difference, at least for us.
W. DENNIS FOLEY, MD: Geoff, I was interested in your different transit times. You said that it was unrelated to the patient's clinical symptomatology.
RUBIN: Yes, unrelated even to the severity of their disease.
BRIAN R. HERTS, MD: Was it correlated with heart rate?
RUBIN: It was not correlated with anything that we measured.
LAWLER: You are filling the tube of the aorta with so much contrast, and it is a big elastic artery that is so highly variable. So, before the contrast even gets to the lower extremities, there is going to be a massive variation. It will vary even if you use a constant because of the rate that ends up feeding into the inflow vessel of the iliac. Again, it is going around the whole lungs, as well, before it comes to the left side. There are so many variables before you even get there.
RUBIN: There are a tremendous number of variables in terms of the relative vascular resistance of different major beds and what percentage of the cardiac output is being directed to the legs or not. That is difficult.
FOLEY : You probably have to determine the transit time from the aorta to the ankle.
RUBIN: But, how are we going to do that? You notice that I made a big assumption here, which is that it is a constant rate. Dominik measured from the aorta to the popliteal and I just assumed that it is the same rate down to the ankle. I think it is going to be very difficult because if you just give a 16-mL bolus, you are not going to be able to see that in those tiny vessels down there.
So I think it is probably not unreasonable to consider that the aortopopliteal transit time is very closely linked to the aortoanterior tibial or dorsalis pedis transit time. I think we are going to have to begin operating on the assumption that measuring aortopopliteal and not aorto-ankle arterial transit times probably would get us pretty close and just see what limitations are associated with those measurements.
Related Articles
Citation
CT angiography of the lower extremities. Appl Radiol.
July 29, 2004