Breast MRI at 3T
Images
Breast magnetic resonance imaging (MRI) is recommended for women at high risk for breast cancer1,2 and is increasingly being used for surgical planning3 and treatment monitoring.4,5 The current state of breast MRI focuses on collecting morphologic and dynamic information at a 1.5T magnetic field strength. High-resolution images yield information regarding tumor morphology, while rapidly collected images acquired after contrast injections generate dynamic contrast-enhanced (DCE) information. These 2 techniques are used to improve the sensitivity and specificity of breast MRI. Many malignant tumors tend to present with a spiculated border as well as with faster contrast uptake and clearance than benign tissue. Thus, morphology and DCE information are both important. At 1.5T, publications note breast MRI sensitivities between 77% and 100% and specificities between 81% and 99%.2
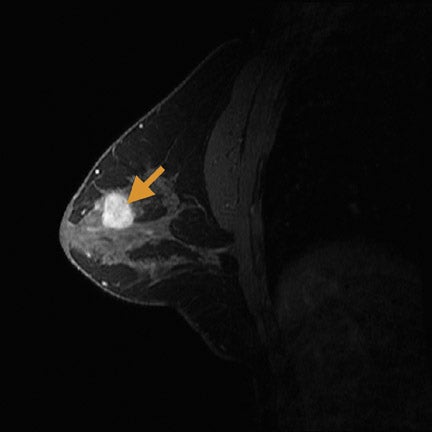
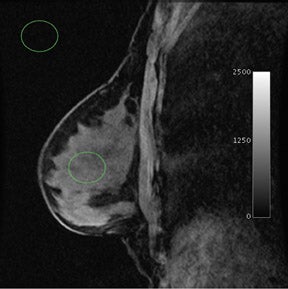
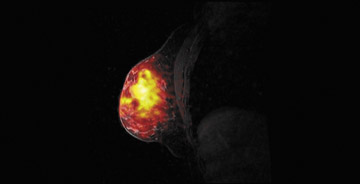
When compared with more standard protocols at 1.5T, breast MRI at a 3T magnetic field strength (Figure 1) provides several opportunities for improving diagnostic image quality. At 3T, breast MRI also opens new paths for investigating novel techniques. By doubling the magnetic field strength, the signal-to-noise ratio (SNR) approximately doubles (contingent on the coil efficiencies being the same and ignoring relaxation effects). In practice, with a finite repetition time (TR), the SNR gains are <2. Overall, the SNR gain at 3T allows for potential improvements over the 1.5T protocol in image resolution and faster data collection. In addition, the greater spectral dispersion of fat and water at 3T may improve and/or reduce the duration of fat-saturation pulses. In addition, at 3T, exploratory techniques such as spectroscopic imaging and blood-oxygen-level-dependent (BOLD) contrast imaging become more feasible (Table 1).
Physics of transitioning from 1.5T to 3T
The SNR is directly related to the main magnetic field, B0. As noted above, the SNR at 3T is nearly double that at 1.5T. Increased SNR is the main motivation for 3T breast MRI. By increasing field strength, however, there are other important considerations. First, when increasing B0, it is ever more challenging to keep the magnetic field homogeneous throughout the entire object. B0 homogeneity specifically suffers at interfaces between soft tissue and air, known as a magnetic susceptibility effect.6 The nonspherical shape of the breast over the sternum exacerbates this effect. For example, most brain imaging does not suffer as significantly from susceptibility effects because the head is mostly spherical and in the center of the bore. Susceptibility artifacts manifest when the shape of the imaged object no longer maintains its spherical and symmetric shape; the air-tissue interface causes an artifact because of the sharp change in magnetic field. For breast imaging, this problem persists as each nonspherical breast is offset from the center of the field, with a large air-tissue surface area in the center of the field. Beyond the center of the field, this artifact also manifests around the breast’s circumference at the breast-body junction. These approximately perpendicular “corners” share the property of a nonuniform change in magnetic field. The susceptibility artifact scales linearly from 1.5T to 3T; thus, susceptibility artifacts at 3T are twice as prominent at 1.5T. Particularly in breast imaging if fat saturation fails at one of the corners, the displacement artifact at 3T is twice that at 1.5T. The increased spectral separation of fat and water (see below) improves the robustness of frequency-selective pulses, such as fat saturation, potentially mitigating this effect. Also, there are techniques, such as shimming, that can mostly correct for susceptibility artifacts by locally modifying the magnetic field in the volume being imaged. Shimming depends on the shim coil shape and should not be different between 1.5T and 3T. The necessity for optimal shimming, however, becomes more obvious at 3T.
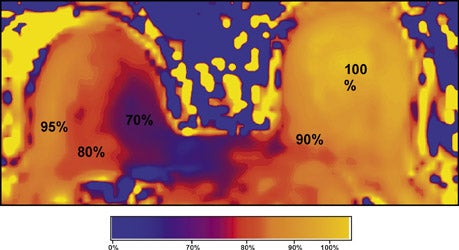
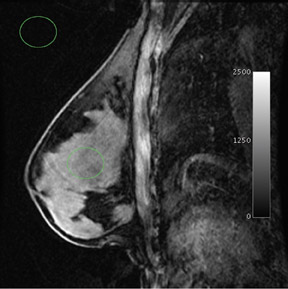
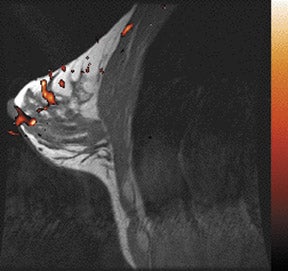
The radiofrequency magnetic field (B1) also suffers decreased homogeneity at 3T. B1 inhomogeneity is a consequence of an interaction between the coil inducing and receiving the signal and the electromagnetic properties of the tissue being imaged.7 This effect, known as the dielectric effect, causes the flip angle and signal measured in the breast to be nonuniform (Figure 2). This manifests as areas with heterogeneous signal intensity. There are techniques under development to correct for these inhomogeneities, such as dielectric pads8 and transmit parallel imaging,9,10 but no results have been published to date that specifically apply to breast imaging.
A third concern with higher field strength is the increase in the radiofrequency specific absorption rate (SAR). The SAR is a value that quantifies the power deposition the imaged subject undergoes during an MRI. At 3T, the SAR is nominally 4 times stronger than at 1.5T. In order not to exceed SAR limits at 3T, MRI pulse sequences are often modified to reduce power deposition either by decreasing the amplitude of the radiofrequency pulses and compensating by extending their duration (thus keeping the same flip angle) or by simply decreasing the flip angle of the radiofrequency pulses. Either option may lead to a loss of SNR and contrast modification. For most breast sequences at 3T, SAR limits have not posed a major concern. For those sequences for which SAR does affect the pulse sequence, other solutions may be applied, including parallel imaging to shorten echo trains (with a small reduction in optimal SNR),9-11 and tailored RF pulse shapes or flip angles (variable-rate selective excitation, hyperecho-turbo spin-echo, transition between pseudo steady-states).12-14
Lastly, with increasing field strength the T1 relaxation rates of breast tissue increase, which affects image contrast and SNR. In breast glandular tissue T1 increases by approximately 100 msec from 1.5T to 3T, while T2 does not significantly vary.15 In order to maintain the tissue signal and similar T1-weighting, the time taken to acquire each k-space line (TR) can be increased slightly. This consequently increases scan time slightly. Alternatively, for short TR T1-weighted sequences, such as fast 3-dimensional (3D) T1-weighted imaging, the flip angle can be reduced slightly to maintain similar T1-weighting as 1.5T images, without scan time penalty. In DCE breast MRI, the rates of contrast uptake and washout are very important because these rates are used to predict malignancy.16,17 If the TR is increased to maintain T1 contrast, the ability to accurately characterize these rates may be slightly compromised because of a longer duration of each image acquisition. Thus, each breast MR pulse sequence requires optimization to determine how to compensate for increasing T1 relaxation rates of glandular breast tissue.
Imaging improvements at 3T
Morphology and dynamic information
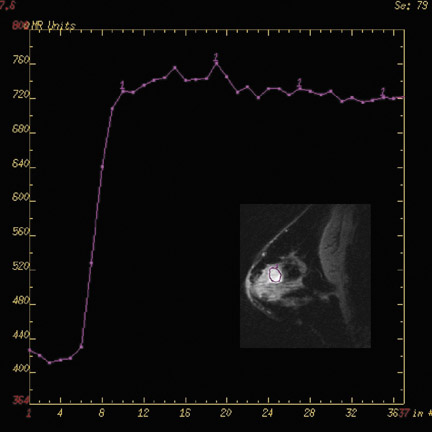
Currently, clinically relevant diagnostic information provided by breast MRI mostly depends on tumor morphology and dynamic contrast uptake.17 With the increase in SNR between 1.5T and 3T (Figure 3), breast imaging at 3T provides the opportunity for higher spatial resolution and faster data collection. Studies at 1.5T18,19 have characterized breast tumors anatomically, with a high likelihood of malignancy indicated by spiculated contours. In order to visualize the spicules, high spatial resolution imaging is required. At 3T, the higher resolution imaging provides more anatomic information than does imaging at 1.5T, which may help better characterize breast tumors.20,21 Complementing an improvement in spatial resolution at 3T, faster time resolution is also a potential benefit. A rapid rate of contrast uptake and washout correlates with the malignancy of a tumor.16,17 With the additional benefit of increased time resolution at 3T, more information can be obtained regarding the contrast time course. As with the morphology information, the additional dynamic information may better characterize breast tumors. This potential increase in specificity with the already high sensitivity of MRI may help decrease the number of unnecessary biopsies.
Gadolinium contrast
Breast tissue T1 relaxation rates increase with field strength.15 At 3T, the T1 of breast fat is approximately 24% longer, and the T1 of fibroglandular tissue is 14% longer than at 1.5T. However, the T1 of gadolinium does not increase as significantly as that of breast tissue.22 As a consequential benefit, theory predicts there will be greater T1 contrast between areas of the breast that take up gadolinium (eg, breast tumors) compared with those that do not. However, realizing this benefit requires 3T imaging with equivalent T1-weighting as performed with conventional 1.5T imaging. Unfortunately, because of the SAR limitations at 3T, some authors have been unable to achieve similarly T1-weighted images.20 In addition, B1 inhomogeneity and associated spatial flip angle variations have been reported to cause localized areas of reduced contrast, particularly in the medial right breast,7 which reduce overall sensitivity of contrast-enhanced 2-dimensional imaging at 3T. However, other investigators have reported success with 3D images at 3T that may be more robust to B1 variations23 and, consequently, allow for improved contrast-enhanced images.
Fat saturation
Due to the prevalence of fat in the breast, most breast MR pulse sequences saturate fat or selectively excite water, as the signal from the fat may obscure an area of interest. At 1.5T, fat and water are spectrally separated by 220 Hz, while at 3T the frequency separation doubles to 440 Hz. The increased separation provides a potential benefit for either better spectral excitation profiles or shorter pulses. Regarding the improved excitation profile, the increased separation allows for more targeted saturation of fat without compromising the desired water signal, especially in areas where fat saturation fails at 1.5T because of local B0 field inhomogeneities. For water-selective excitations, pulse sequences better envelop the water signal without as much overlap of the fat signal, yielding images with minimal fat content. Alternatively, the increased separation allows for pulses to be reduced by 50% duration. Thus, the spectral effects are identical to 1.5T but the pulses are half as long, providing the benefit of shorter pulses such as reduced echo time and faster scanning. The greater spectral separation of fat and water also benefits phase-based fat-water separation techniques, such as 3-point Dixon24 or iterative decomposition of water and fat with echo asymmetry and least-squares estimation (IDEAL)25 images because smaller echo-shifts can be used.
Metabolic imaging (choline and sodium)
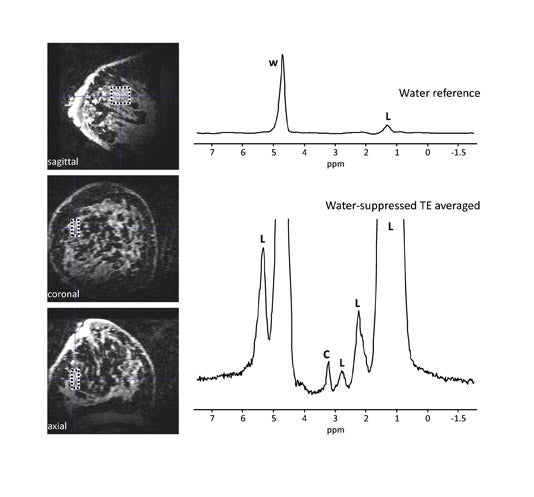
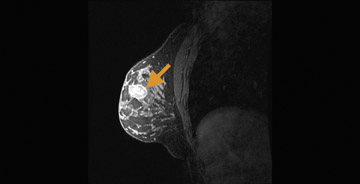
Choline and sodium are 2 metabolites that may be indicative of breast malignancy and are being evaluated for their potential in improving breast MRI specificity.26-29 Choline levels have been found to increase with malignancy and provide a marker for breast cancer26,27 (Figure 4). An increase in sodium indicates the disruption of the sodium-potassium pump in malignant cell membranes and is a newer area of interest in spectroscopy28,29 (Figure 530). In MRI, these metabolites can be quantified with the use of dedicated coils and pulse sequences and are better detected at higher field strengths. The spectroscopic peaks of choline and sodium are smaller by several orders of magnitude relative to the water peak. Thus, the SNR provided by higher field strengths, such as 3T, permit these metabolites to emerge with a more readily quantifiable peak.
BOLD contrast
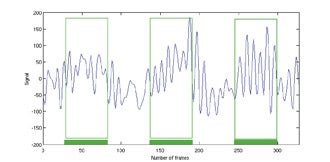
Blood-oxygen-level-dependent) contrast imaging is a method often used to evaluate brain function with functional MRI (fMRI). Blood-oxygen-level-dependent contrast fMRI works by detecting a variation in tissue oxygen caused by changes in local metabolism in the organ. In the brain, metabolic changes can be caused by external stimuli that include flashing lights, music, or finger tapping. These stimuli cause an uptake of oxygen and reduction of deoxyhemoglobin in the relevant parts of the brain such as the visual, audio, or motor cortices. Deoxyhemoglobin is paramagnetic and thus alters the nearby magnetic field, which can be detected by T2*-weighted MRI, and is a positive result of the previously discussed susceptibility effect. As noted earlier, susceptibility effects increase with field strength, thus BOLD contrast is more detectable at 3T than at 1.5T. This same concept can be applied to tumor imaging31-37 and is a new area of research for breast imaging.38 In the breast, the stimulus can be the inhalation of gases such as pure oxygen or carbogen (95% O2, 5% CO2 ), which results in a vasomotor reaction that alters the local hemoglobin levels characteristic of the regional vascularity. A tumor’s oxygen consumption may help predict therapy, gauge therapeutic response,and differentiate between malignant and normal tissue. Initial studies have been conducted on breast tissue of healthy volunteers at 3T (Figure 6).
Conclusion
Breast MRI at 3T is an emerging application. Initial clinical results indicate the potential of 3T breast MRI to accurately detect breast cancer with higher SNR. However, optimal methods for performing contrast-enhanced imaging at 3T have not been achieved, given potential problems from decreased B1 homogeneity.7 Developing an improved breast protocol for 3T requires further research as 3T breast imaging becomes more widely used. Also, there are new opportunities for evaluating breast cancer at 3T that were not robust or feasible at lower field strengths including metabolite imaging and breast BOLD contrast imaging. More studies are expected in the near future that will confirm the benefits of 3T breast MRI and will document methods to overcome the current technical challenges that accompany this advance.
References
- Kriege M. Brekelmans C, Boetes C, et al. Efficacy of MRI and mammography for breast-cancer screening in women with a familial or genetic predisposition. N Engl J Med. 2004;351:427-437.
- Saslow D, Boetes C, Burke W, et al. American Cancer Society guidelines for breast screening with MRI as an adjunct to mammography. CA Cancer J
Clin. 2007;57:75-89. - Houssami N, Ciatto S, Macaskill P, et al. Accuracy and surgical impact of magnetic resonance imaging in breast cancer staging: Systematic review and meta-analysis in detection of multifocal and multicentric cancer. J Clin Oncol. 2008;26:3248-3258.
- Lorenzon M, Zuiani C, Londero V, et al. Assessment of breast cancer response to neoadjuvant chemotherapy: Is volumetric MRI a reliable tool? Eur J Radiol. May 8, 2008. [E pub ahead of print.]
- Mameri CS, Kemp C, Goldman SM, et al. Impact of breast MRI on surgical treatment, axillary approach, and systemic therapy for breast cancer. Breast J. 2008;14:236-244.
- Schenck JF. The role of magnetic susceptibility innmagnetic resonance imaging: MRI magnetic compatibility of the first and second kinds. Med Phys. 1996;23:815-850.
- Kuhl CK, Kooijman H, Gieseke J, Schild HH. Effect of B1 inhomogeneity on breast MR imaging at 3.0 T. Radiology. 2007;244:929-930.
- Kataoka M, Isoda H, Maetani Y, et al. MR imaging of the female pelvis at 3 Tesla: Evaluation of image homogeneity using different dielectric pads. J Magn Reson Imag. 2007;26:1572-1577.
- Katscher U, Börnert P, Leussler C, van den Brink JS. Transmit SENSE. Magn Reson Med. 2003;49:144-150.
- Zhu Y. Parallel excitation with an array of transmit coils. Magn Reson Med. 2004;51:775-784.
- Liu Y, Feng K, McDougall M, et al. Reducing SAR in parallel excitation using variable-density spirals: A simulation-based study. Magn Reson Imaging. 2008;25:1122-1132.
- Hargreaves BA, Cunningham CH, Nishimura DG, Connolly, SM. Variable rate selective excitation for rapid MRI sequences. Magn Reson Med. 2004;52:590-597.
- Tetzlaff RH, Mader I, Kuker W, et al. Hyper echoturbo spin-echo sequences at 3T: Clinical application in neuroradiology. Am J Neuroradiol. 2008;29:956-961.
- Hennig J, Weigel M, Scheffler K. Multiecho sequences with variable refocusing flip angles: Optimization of signal behavior using smooth transitions between pseudo steady states (TRAPS). Magn Reson Med. 2003;49:527- 535.
- Rakow-Penner R, Daniel B, Yu H, et al. Relaxation times of breast tissue at 1.5T and 3T measured using IDEAL. J Magn Reson Imag. 2006;23,87-91.
- Daniel B, Yen Y, Glover G, et al. Breast disease: Dynamic spiral MR imaging. Radiology. 1998;209:499-509.
- Kuhl C. The current status of breast MR imaging. Part I. Choice of technique, image interpretation, diagnostic accuracy, and transfer to clinical practice. Radiology. 2007;244:356-378.
- Leong CS, Daniel BL, Herfkens RJ, et al. Characterization of breast lesion morphology with delayed 3DSSMT: An adjunct to dynamic breast MRI. J Magn Reson Imag. 2008;11:87-96.
- Nunes LW, Schnall MD, Siegelman ES, et al. Diagnostic performance characteristics of architectural features revealed by high spatial-resolution MR imaging of the breast. AJR Am J Roentgenol. 1997;169:409-415.
- Kuhl CK, Jost P, Morakkabati N, et al. Contrast enhanced MR imaging of the breast at 3.0 and 1.5 T in the same patients: Initial experience. Radiology. 2006;239:666-676.
- Schmitz AC, Peters NH, Veldhuis WB, et al. Contrast-enhanced 3.0-T breast MRI for characterization of breast lesions: Increased specificity by using vascular maps. Eur Radiol. 2008;18:355-364.
- Rohrer M, Bauer H, Mintorovitch J, et al. Comparison of magnetic properties of MRI contrast media solutions at different magnetic field strengths. Invest Radiol. 2005;40:715-724.
- Mountford CE, Stanwell P, Ramadan S. Breast MR imaging at 3.0 T. Radiology. 2008;248:319-320.
- Glover GH, Schneider E. Three-point Dixon technique for true water/fat decomposition with B0 inhomogeneity correction. Magn Reson Med.
1991;18:371-383. - Reeder SB, Pineda AR, Wen Z, et al. Iterative decomposition of water and fat with echo asymmetry and least-squares estimation (IDEAL): Application with fast spin-echo imaging. Magn Reson Med. 2005;54:636-644.
- Bolan PJ, Meisamy S, Baker EH, et al. In vivo quantification of choline compounds in the breast with 1H MR spectroscopy. Magn Reson Med. 2003;50:1134-1143.
- Bartella L, Morris EA, Dershaw D, et al. Proton MR spectroscopy with choline peak as malignancy marker improves positive predictive value for breast cancer diagnosis: Preliminary study. Radiology. 2006;239:686-692.
- Ouwerkerk R, Jacobs M, Macura K, et al. Elevated tissue sodium concentration in malignant breast lesions detected with non-invasive 23Na MRI. Breast cancer research and treatment. 2007;106:151-160.
- Jacobs MA Ouwerkerk R, Wolff AC, et al. Multiparametric and multinuclear magnetic resonance imaging of human breast cancer: Current applications. Technol Cancer Res Treat. 2004;3:543-550.
- Gurney PT, Hargreaves BA, Nishimura DG. Design and analysis of a practical 3D cones trajectory. Magn Reson Med. 2006;55:575-582.
- Lüdemann L, Förschler A, Grieger W, Zimmer C. BOLD signal in the motor cortex shows a correlation with the blood volume of brain tumors. J Magn Reson Imag. 2006;23:435-443.
- Rijpkema M, Schuuring J, Bernsen PL, et al. BOLD MRI response to hypercapnic hyperoxia in patients with meningiomas: Correlation with Gadolinium-DTPA uptake rate. Magn Reson Imaging. 2004;22:761-767.
- Kuperman, VYU, River JN, Lewis MZ, et al. Changes in T2*-weighted images during hyperoxia differentiate tumors from normal tissue. Magn Reson Med. 1995;33:318-325.
- Hoskin PJ, Carnell DM, Taylor NJ, et al. Hypoxia in prostate cancer: Correlation of BOLD-MRI with pimonidazole immunohistochemistry—Initial observations. Int J Radiat Oncol Biol Phys. 2007;68:1065-1071.
- Taylor NJ, Baddeley H, Goodchild KA, et al. BOLD MRI of human tumor oxygenation during carbogen breathing. J Magn Reson Imag. 2001;14:156-163.
- Gilad, AA Israely T, Dafni H, et al. Functional and molecular mapping of uncoupling between vascular permeability and loss of vascular maturation in ovarian carcinoma xenografts: The role of stroma cells in tumor angiogenesis. Int J Cancer. 2005;117:202-211.
- Dunn JF, O’Hara JA, Zaim-Wadghiri, et al. Changes in oxygenation of intracranial tumors with carbogen: A BOLD MRI and EPR oximetry study. J Magn Reson Imag. 2002;16:511-521.
- Rakow-Penner R, Pisani L, Daniel BL, et al. BOLD Contrast in the Breast at 3T. Presented at the 16th Scientific Meeting and Exhibition of the International Society of Magnetic Resonance in Medicine. Toronto, Ontario: May 2008.
Related Articles
Citation
Breast MRI at 3T. Appl Radiol.
March 8, 2009