Use of computer-aided detection in thoracic CT
Images
Dr. Roberts is an Associate Professor of Radiology, Department of Medical Imaging, University of Toronto/University Health Network, Toronto, Canada.
Computer-aided detection (CAD) software tools have been developed to support radiologists and help them cope with the ever-increasing number of images that need interpretation. The demand for computer assistance emerges from both increasing indications and technologic developments. The prototypical example of increasing CAD indications is mammography. Screening mammography is recommended in a large number of patients, and, even though the number of images per patient remains limited, the number of studies is continually rising. As such, mammography has been the first area in which companies have developed CAD software and, to date, most are working on this indication. Technologic advances, particularly the development of multidetector computed tomography (MDCT), permit CT of the chest with thin, overlapping axial slices, which results in several hundred images per study. In chest imaging, the demand for CAD has grown with new MDCT indications, such as low-dose lung cancer screening. More recently, CAD has been applied to established areas of chest CT, such as the diagnosis of acute pulmonary embolism (PE) and interstitial lung disease.
This article addresses CAD software tools in use for chest CT. Several companies have CAD software in different stages of development. Based on the findings of a multireader study, 1 R2 Technology, Inc. (Sunnyvale, CA) was the first company to receive FDA approval for a lung CAD product, ImageChecker CT CAD Software System. This software targets the detection and follow-up of lung nodules and the detection of pulmonary arterial filling defects. Medicsight (London, England) offers LungCAD, Siemens Medical Solutions (Malvern, PA) has syngo LungCARE, and Philips Medical Systems (Bothell, WA) has a CAD product in development that is not yet commercially available in North America. Other companies are also developing CAD software for lung CT or digital radiography, including MEDIAN Technologies, Inc. (Brookfield, WI), EDDA Technology, Inc. (Princeton Junction, NJ), and Riverain Medical (Miamisburg, OH). The author has ac-cess to the most recent software releases from R2 Technology and Medicsight; information from the other vendors is available in the literature. Assessing the performance of CAD
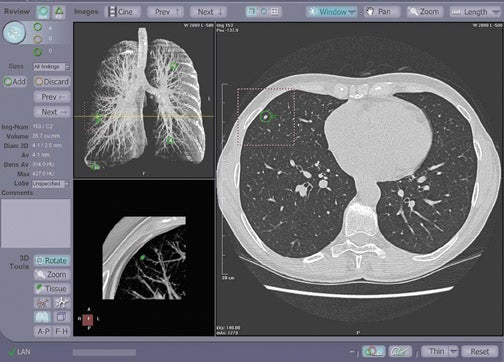
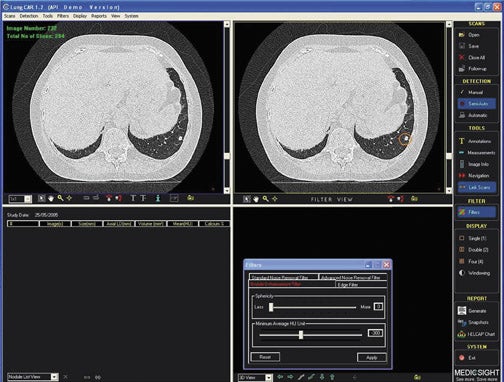
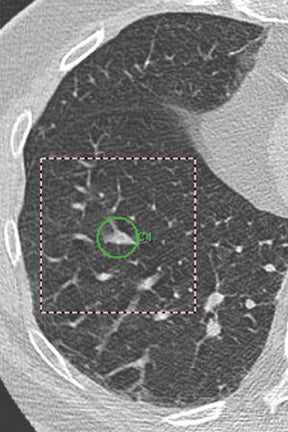
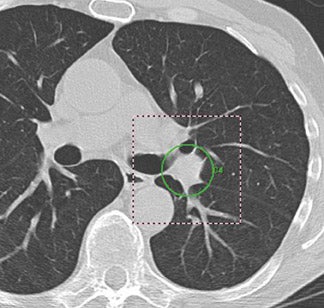
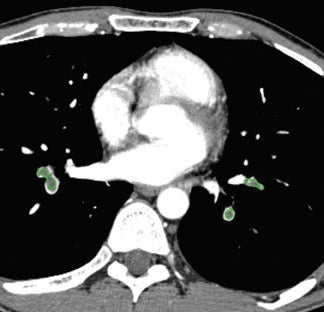
In general, CAD results are displayed as prompts or markers on the pre-existing axial CT images (Figures 1 and 2) or 2-dimensional (2D) or 3-dimensional (3D) reconstructions of the lungs (Figure 1). These marks, most commonly in the form of a circle, draw the reader's attention to a suspected target lesion. The CAD performance is assessed by how much its use improves the radiologist's diagnosis of the target lesion while maintaining or even reducing interpretation time and thus improving workflow. The CAD algorithms are "trained" to select target lesions-those found and those missed by the radiologist. The sensitivity of CAD is determined by the number of true-positive results divided by the number of true-positive and false-negative (missed) findings. If all lesions are found by CAD, (ie, if there is a high number of true-positive CAD markings), its sensitivity is high. Traditionally, sensitivity has been used in the literature as a performance measure for CAD. 2-6 However, the requirement for high sensitivity is actually dependent on the way in which CAD is used--as a second reader or as a concurrent reader.
If CAD is used as a second reader (as R2 Technology, for example, promotes the use of their product), radiologists tend to use the CAD system to indicate nodules they may have overlooked, rather than as an adjudicator for questionable nodules. 7 As such, it is not necessarily required that all target lesions are found; the overall sensitivity might be quite low yet still be sufficient as long as the lesions that were missed by the radiologist are found. 8 In the second-read model, sensitivity might not be a sufficient performance measure for CAD. A second read with CAD inevitably increases the interpretation time for the radiologists and impairs workflow.
If, on the other hand, CAD is used as a concurrent reader (as Medicsight's product is promoted), sensitivity generally needs to be much higher. If radiologists immediately have CAD marks available, they could rely on CAD's ability to find lesions and may decrease their attention. On the other hand, this simultaneous CAD reading has a much lower impact on interpretation time and workflow.
The impact on interpretation time is not only affected by the second versus concurrent reading approach, but also by the number of false-positive readings, which are defined as any CAD marks that are not target lesions. The rejection of false-positive marks increases the radiolo-gist's interpretation time, negatively impacting overall reading time and workflow. The term true negative is generally not defined in the assessment of CAD performance, because there is no gold standard that shows all nodules. Consequently, the specificity of CAD is not caluclated. However, it has been suggested that the term true negative be used to describe a case with no lesions for which no CAD marks are generated. This definition would potentially be useful if a first-reader paradigm were ever implemented. In this paradigm, the CAD would be applied before the radiologist reading; in cases in which no CAD marks were generated, the radiologist would not have to perform a detailed nodule search. Clearly, this requires close to 100% sensitivity for CAD, and no system has yet reached this level of performance. Nevertheless, this would be a promising CAD implementation, particularly for screening databases. While it is already difficult to define the parameters to describe CAD performance, the re-quirements for CAD performance vary with the database under evaluation and with the experience of the user. 9
The database under evaluation determines the need for sensitive detection of small nodules. In screening cases, nodules <5 mm are unlikely to be of clinical significance, 10 and a low sensitivity for such small nodules may be acceptable. On the other hand, any nodule (particularly a new nodule) in an oncologic patient is primarily suggestive of a metastasis and must be detected regardless of its size; therefore, a high sensitivity is required even for small nodules in these patients. To date, most CAD systems have a detection rate that decreases with decreasing nodule size. 11- 13 This effect and the larger number of false-positive results contribute to impaired CAD performance when targeting smaller nodules. Since a radiologist's performance also deteriorates when he or she is looking for small nodules, there is still an overall incremental improvement in diagnostic accuracy even when CAD is used for small nodule detection. 12,13
Reader experience is another factor that influences the evaluation of CAD software. If nonexperienced readers interpret a chest CT, they might appreciate any mark pointed out by the CAD, as they are more likely to miss a target lesion than would a more experienced radiologist. They might not mind the additional time required to interpret the study. In a study of the incremental effects of CAD on the performance of readers with different levels of experience, there was a significant difference in detection rates between radiologists and nonradiologists before CAD; but, after CAD, there was no significant difference in detection rates between these readers. 7 In other words, the effect of CAD on sensitivity was larger in an inexperienced reader. This tendency helps support the use of CAD to assist a relatively inexperienced on-call resident to identify pulmonary arterial filling defects. Given these factors, a good CAD performance can be defined as a high sensitivity (de-tection rate) combined with a low number of false positives.
CAD of pulmonary nodules
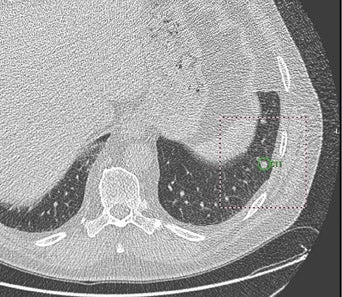
To date, the use of CAD in chest CT has been focused primarily on the detection of pulmonary nodules. Most manufacturers develop software for this indication, and many studies have been published in this area. 1-6 The target lesion or true-positive CAD mark is any pa-renchymal nodule, benign or malignant (Figure 3); false-positive marks would be any other anatomical or artifactual structure that is not a nodule. False-positive findings are to be expected from artifacts from respiratory or cardiac motion, vessel bifurcations, hilar vessels, and parenchymal scars. 14
The author has had experience with the ImageChecker software from R2 Technology, which is designed as a second reader to be implemented after the radiologist's initial read. In an analysis of 250 low-dose CT scans (60 mA, 140 kV, 1.25-mm slices) from a lung cancer screening study, the radiologists found 83 nodules. 15 The CAD system found an additional 21 nodules that had been previously missed in the radiologists' read. Thus, the radiologists had a sensitivity of 80% (83 of 104). Overall, CAD found 76 nodules, for a sensitivity of 73% (76 of 104). This result was based on noncalcified, solid nodules with a cutoff size of 5 mm. In this study, the results of CAD and the radiologists' results are complementary, since the use of CAD as a second reader tends to find some nodules that are different from those that the radiologist identifies and can indeed improve lung-nodule detection in a screening population.
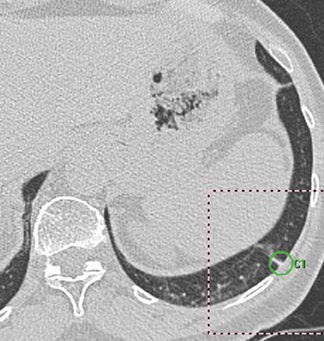
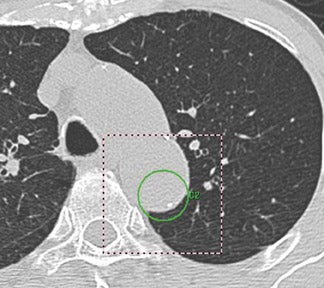
The complementary results of a radiologist's read and CAD results have also been found by other studies. 8,16 On the other hand, in the author's study, 739 CAD entries were false positives, which was 86% of all CAD entries for an average of 0.01 per section, or 3 per patient. 15 Most false-positive results fell into the expected categories (noted above), but there were also marks made in normal mediastinal organs and in osteophytes (Figure 4). All false-positive marks were easily dismissed by glancing at the image or scrolling up and down a few anatomic levels, but this still required a considerable amount of time for the second read with CAD. Clearly, the CAD software cannot yet achieve the differentiating ability of the radiologist's "glance" in these cases.
There is general agreement in the literature that the addition of CAD improves a radiologist's nodule detection rate. 7,8,15-19 If a slightly different approach is used to evaluate the incremental improvement when CAD is used in cases that were previously reported as normal, 20 or in cases of previously missed cancers, 21,22 results show that CAD improves diagnostic yield.
However, individual studies are difficult to compare, since they have been performed with different CAD systems, on different databases, using different CT scanning parameters, and with different size thresholds for computing sensitivity and false positives (Table 1). Lee et al 23 studied the influence of radiation dose on the use of CAD and reported that a decrease in dose results in a higher false-positive rate. In order to create a standardized image database of MDCT lung images as a resource for CAD researchers, the National Cancer Institute has formed the Lung Image Database Consortium (LIDC). This database will be available to researchers and is expected to lead to the publication of comparative studies. 24
Most published studies to date have used the second-read model. If CAD is designed as a concurrent reader, as in Medicsight's LungCAD, CAD highlights potential areas of nodules that the radiologist must accept or dismiss in real time. The challenge with this approach is to limit the number of false-negative marks to an absolute minimum. When CAD is used for joint reading, a radiologist will be more likely to rely on the computer algorithm to point out any potential nodule and, thus, would be expected to decrease their effort to detect additional nodules not pointed out by the software. A recent study supports this expectation. 25 Comparing both sensitivity and reading time when CAD was used simultaneously and as a second reader, the mean sensitivity was 68% for reading without CAD, 68% for concurrent reading, and 75% for a second reading. The mean reading time without CAD was 294 seconds, was reduced with concurrent reading (274 seconds), and was longer with a second-read approach (337 seconds). 25 Most of these results confirm the expected effects of concurrent CAD reading. Interestingly, the authors found that sensitivity was unchanged when they compared reading without CAD (68%) with reading concurrently with CAD (68%). This is likely explained by the decrease in attention of the radiologist during concurrent CAD application, which is supported by the decreased reading time. The authors concluded that CAD could either decrease interpretation time or improve nodule detection, but not both. These results require verification.
"CADx" of pulmonary nodules
In addition to the detection of pulmonary nodules, a second area of potential CAD application is for the characterization of nodules as possibly malignant or likely benign lesions. With the current use of MDCT, the sensitivity for the detection of lung nodules is high, but the specificity for diagnosing malignant nodules is low. Additional features must be included in CAD tools to detect malignant nodules, the so-called CADx software tools, 14 which would point out malignant nodules only and would allow true-negative values and, hence, specificity to be computed.
CADx software, in general, has a variety of indications, including the quantification of microvascular parameters derived from con-trast-enhanced dynamic CT perfusion studies 26 and the quantification of positron-emission tomography (PET) data. With the use of CADx in MDCT scanning, analysis options are based on a more detailed evaluation of morphology or, if studies from several time-points are available, the evaluation can quantify any nodule growth. Incorporating morphology into decision analysis seems to be the most basic approach. Ideally, morphologic features (such as shape, density, and location) would be used to rank a nodule into cancer probabilities and display them with different symbols. Li et al 27 successfully trained CADx software to determine the likelihood of malignancy of lung nodules based on various objective features, which confirmed this promising approach.
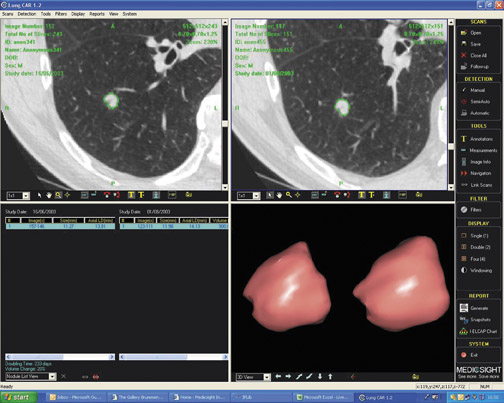
The inclusion of nodule growth has been evaluated in more detail. Most vendors offer a "temporal comparison" tool that displays any change in any given nodule, which is commonly reported as growth rate in days and as percent of volume change (Figure 5). This information seems to be highly valuable for the characterization of nodules as possibly malignant or likely benign, and, moreover, provides prognostic information in the case of cancer. This information may also be useful in monitoring treatment responses. Thin-slice (1 to 1.25 mm) MDCT scanning protocols with isotropic voxels are used in displaying a nodule, which may allow accurate measurements of 3D lung-nodule volumes. The volume approach promises to be more sensitive to change than the previously used diameter measurements. The actual doubling of a sphere volume would imply a diameter change of only 26%, which can easily be overlooked, particularly in smaller nodules. The most commonly used threshold for a benign lesion is a volume doubling time (VDT) >400 days, which is equivalent to the absence of lesion growth in a 2-year period. An average VDT in lung cancer has been reported to be 163.7 days. 28 This definition has been challenged in the literature and might need to be revised. In screening populations, the mean VDT is higher (mean 452 ± 381 days, range 52 to 1733 days), which is attributable to a higher proportion of slow-growing adenocarcinomas in screening populations. 29 Morphologic considerations, particularly the density or proportion of ground-glass opacities, should be used in combination with growth assessment.
In addition to the limited definition of a VDT that indicates malignancy, there are several technical problems that can impair a correct volume measurement. Even assuming thin-slice MDCT scanning with consistent parameters, volume measurements are influenced by attached structures (such as vessels and pleura) that might be included in the volumes to different extents and by different inspiration. 30 Most of the preliminary studies have concluded that, for solid nodules, only computer-assisted volumetry is accurate, robust, repeatable, and consistent. 14 However, this must be validated, and reliable thresholds for the definition of growth must be defined.
In addition to comparing the volume of nodules on studies from different time points, CADx tools offer automated registration and nodule matching to decrease the time required for comparison. 14 This approach is impaired by changes in respiratory state, patient po-sition, and possible interval changes in lung anatomy due to surgical or other factors, such as infection. According to the author's own unpublished experience, this approach can result in misregistrations that frequently require "unlinking" of the current and former CT scans, which makes automated registration still somewhat impractical (HC Roberts, unpublished data, 2006).
Current limitations of nodule CAD and CADx in clinical practice
Most CAD studies have been performed with thin slices (1 to 2 mm). Some algorithms allow for the processing of thicker (5 mm) slices, but others do not. For example, the ImageChecker algorithm will not execute if slices are thicker than 3 mm. Thicker slices (5 to 10 mm) allow partial volume effects if the nodules are smaller than the slice thickness, which results in an apparent subsolid density. Increasing the slice thickness decreases the sensitivity for nodule detection. 31 Since the algorithm is designed not to reject subsolid foci, even more false-positive entries result 19,31 and small nodules may be obscured by adjacent vessels. 32 Fiebich et al 32 conducted a study of the use of CAD in 10-mm slice CT scans and reported sensitivities of 38% with 6 false positives per patient or 72% sensitivity with false positives per patient. Similarly, volume assessments are quite inaccurate due to the partial volume effect of small nodules, making accurate growth analyses impossible. 33
Most clinical protocols, however, still include a 5-mm slice thickness. A general change in protocol would have an unacceptable impact on picture archiving and communication systems (PACS) and radiologists' workload. Consequently, such CAD approaches should be used only with thin-slice protocols, not in routine clinical settings, if CT scans with slice thicknesses ≥5 mm are reviewed.
CAD for the analysis of diffuse lung disease
The assessment of diffuse, interstitial lung disease is a major clinical topic in chest CT but has not caught the interest of CAD developers. In the same way that software tools help to detect lung nodules, CAD could help to detect diffuse lung disease, and CADx could help to characterize and define the type of disease. Uchiyama et al 34 studied the use of CAD and reported a sensitivity of 99.2% for identifying any abnormal lung patterns (ground-glass opacities, reticular or linear opacities, nodular opacities, honeycombing, emphysematous changes, or consolidation). They also reported a specificity for a normal area of 88.1%. Although these early results suggest that CAD may eventually be able to assist radiologists in their assessment of diffuse lung disease, the necessary software tools are still in the theoretical development stage.
CAD for detection of vascular filling defects
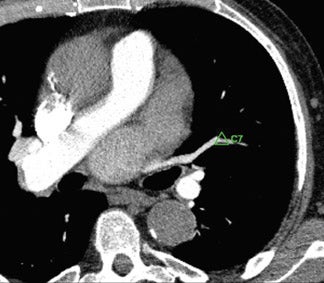
Contrast-enhanced CT scans have become the standard tool for the detection or exclusion of PE. Given the high number of patients with suspected PE and the ever-increasing number of CT angiograms performed with several hundred sections per scan, CAD is expected to improve the accuracy and efficiency of radiologists' interpretation. Target lesions or true-positive CAD marks include any vascular filling defect (Figure 6). False-positive marks would be those outside or within a patent pulmonary artery. The definition of true negative exists in the assessment of PE; thus, specificity can be computed.
R2 Technology was the first company to launch a CAD tool that assessed pulmonary artery patency. Their new Pulmonary Artery PE Tool can be used with the ImageChecker CT software and is designed to help physicians detect potential filling defects such as emboli. Das et al 35 studied the use of this tool in CT scans that were positive for PE. They reported a CAD sensitivity of 88% for segmental PE and 78% for sub-segmental PE, with an average of 4 false-positive CAD marks per case. Zhou and colleagues 36 tested proprietary software on a similar set of CT scans that were positive for PE. They reported sensitivities of 92% for proximal PE and 77.8% for subsegmental PE, with an average of 18.3 false-positive CAD marks per case. The case sensitivity was 92.9%. 36
The author participated in the study by Colak et al 37 that assessed the utility of a first-generation CAD algorithm (ImageChecker CT) for pulmonary arterial filling defects in an unselected group of 100 patients who subsequently underwent CT angiograms performed to exclude PE. All scans were performed with a 1- or 1.25-mm slice thickness. Sensitivity for a positive or negative result was 67% (of 18 PE positive scans, 12 had at least 1 CAD mark) and specificity was 55% (of 82 PE negative scans, 37 had at least 1 CAD mark). Unfortunately, the false-positive CAD marks are not as easily dismissible as they are in the case of lung nodule CAD. In this study, the majority of marks were in pulmonary veins (which accounted for 75% of all false-positive CAD marks), frequently in the periphery, and they required correct anatomic localization (Figure 7). The positive-predictive value was 24%, and the negative-predictive value was 88%. Given the high negative-predic-tive value, there seems to be immediate utility and important practical relevance of this software, even in its first version, to help junior radiology residents exclude PE. Using CAD, resident interpretation of pulmonary CT angiograms increased from an average of 4.5 minutes per case to 5 minutes per case; however, the in-terpretation confidence also increased. Without CAD, the resident indicated little confidence in the result in 10 cases, moderate confidence in 17, and high confi-dence in 78 cases. With CAD, the confidence numbers were 5 (little), 21 (moderate), and 77 (high). 38 Resident diagnostic accuracy also improved. Without CAD, the presence or absence of PE was correctly reported in 88 cases with 4 false-positive results and 6 false-negative results. With CAD, 91 cases were reported correctly, with 3 false-pos-itive and 4 false-negative results. The next iteration of vascular-filling-defect CAD is available and has been tested. 39
Conclusion
Developers of CAD software face a great challenge in creating products that will mark enough suspicious areas to enhance the radiologists' interpretation without overwhelming the reader with false-positive marks. The challenge is even greater since the determination of how many marks are "enough" without being "overwhelming" is highly subjective. This may cause some readers to react emotionally with frustration and, perhaps, reject the product. Assuming that the future of chest CT CAD resembles the development of CAD in mammography, we are not likely to see early, widespread use, and there is no immediate danger that CAD will replace the radiologist.
When all of these issues are resolved, when the influence of radiation dose and slice thickness on CAD performance are clear, and when comparison thresholds are defined and morphologic features incorporated, developers will still need to have their products integrated into existing PACS reading workstations before widespread use is likely. But, even at this point in thoracic CAD development, the benefits of CAD systems- as concurrent or second readers-seem worth the effort required to overcome these challenges.