Tissue elasticity imaging using ultrasound
Images


Dr. Garra is a Radiologist at the Washington DC VA Medical Center, Washington, DC.
Diagnostic ultrasound, the oldest of the cross-sectional imaging modalities, has struggled in recent years to stay competitive with the technical advancements in computed tomography (CT) and magnetic resonance imaging (MRI). But now, the ability to image an entirely new tissue property, elasticity or tissue stiffness, promises to reinvigorate ultrasonic imaging much as color Doppler did during the early 1980s.Ultrasonic imaging of elasticity, or elastography as it is commonly known, has come into the mainstream, with nearly all major and smaller manufacturers incorporating some form of it on their machines in 2010. Yet, for all its promise, elastography is still an immature technology with many variants and pitfalls. To use it effectively, one must understand what is being measured and what technical factors can affect image quality and diagnostic accuracy.
Tissue elasticity estimation
Estimation of tissue elasticity using palpation is one of the oldest methods of disease diagnosis, having been reported by the Egyptians as long ago as 2100 BC. Palpation of a mass relies on the fact that tumors most often are harder or stiffer than the tissue in which they are embedded. Pressure receptors in the examiner’s fingers pick up the increased pressure required to displace a tumor as compared to the surrounding tissue. Elastographic methods function by applying pressure to displace tissue and then monitoring the movement produced in the tissue. The use of ultrasound to measure displacement of tissue found its first application in m-mode ultrasound of the heart in the mid-1950s, but work to quantify tissue movements using computer analysis did not begin until the early 1980s. Two different methods of measuring the movement of tissue in response to external pressure for detection of masses emerged in the early 1990s. Sonoelasticity imaging, which uses color Doppler instrumentation to monitor tissue movement in response to applied external vibration was reported by Lerner,Parker and others in 1987 as a method to detect prostate cancer. Static elastography, the other method, was reported in 1991 by Ophir and colleagues for detection of breast and prostatic tumors.
These exemplify the two major methods of elasticity measurement; they are quasistatic systems (also known as “static”), where the response of tissue to a single slow compression is used to measure tissue stiffness; and dynamic systems, where the response of tissue to rapid compressions or vibrations is used.
Static elastography
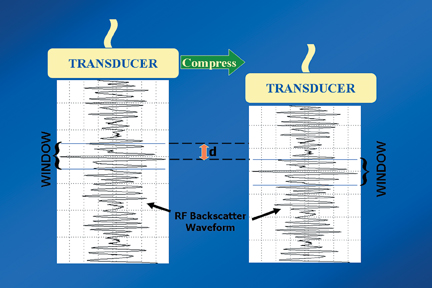
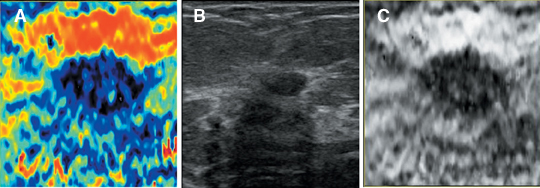
Static elastography is the more common form of elastographic imaging available today. In this method, a single, very small compression is applied (usually less than 0.5 mm), typically by pressing with the ultrasound transducer itself, and the displacement of tissue is measured at each depth or distance from the transducer using a cross-correlation function (Figure 1). The rate of change in the amount of tissue displacement as a function of distance from the transducer is termed “tissue strain” and is displayed as an image. In soft materials, the rate of change in displacement is large with the material closest to the transducer displacing most and that farthest away displacing least. In very hard materials, such as in a steel block, pressure causes the entire block to move as a unit with that portion of the block far from the transducer moving the same as the part closest to the transducer. Thus, the rate of change in displacement from the near edge of the block to the far edge is nearly zero (Figure 2). Therefore, hard materials exhibit very low strain values and soft materials exhibit larger strain values. On an elastogram, low strain values are usually displayed as dark and large strain values as bright (Figure 3).Tumors typically are harder or stiffer than their surroundings so they appear as a dark mass embedded in a brighter background. On machines using a color display, low strain values are often displayed as greens or blues and large strain values as yellows or reds (Figure 4). The colors are often overlaid on the b-scan image of the lesion.
The strain image, or elastogram, is an image of relative hardness, since the amount of pressure applied by the transducer will change the amount of tissue displacement and the rate of change in displacement. It is theoretically possible to compute a more objective measure of stiffness called the elastic (Young’s) modulus from the strain values, but to make a reliable estimate one must know how much pressure and displacement was applied and what conditions existed at the tissue boundaries. The equation relating elastic Young’s modulus (E) and shear wave velocity is: E = nρV2 where n is a proportionality constant related to the Poisson’s ratio that is approximately 3 for most tissues.Gathering this information has proved extremely difficult, and as a result, elastic modulus reconstruction is not performed clinically.
Since becoming widely available, static elastography has been applied to many different organs and pathologies. The first reported application for elastography was in the differentiation of benign from malignant breast masses and breast elastography remains the most widely practiced form of elastography today. For a breast elastogram, the patient is placed in an oblique decubitus supine position and the breast tissue is compressed by the transducer against the chest wall. Initial computer-controlled compressions were replaced by a freehand technique that can be easily performed during a breast ultrasound examination; compression usually is not even necessary. Normal breathing motion of the patient produces enough compression against the transducer to generate a good quality elastogram. Multiple static images or short cine loops are acquired for later review. Because many relatively dark areas that have no clinical significance may appear on the elastogram, the elastogram is always viewed alongside the sonogram from precisely the same position; or the elastogram is superimposed on the sonogram as a color overlay. This procedure facilitates comparison of a lesion revealed by sonography with its elastographic appearance.
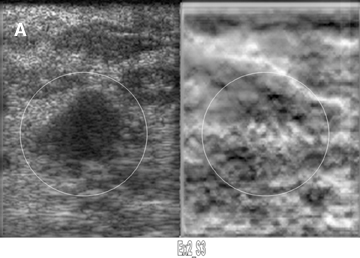
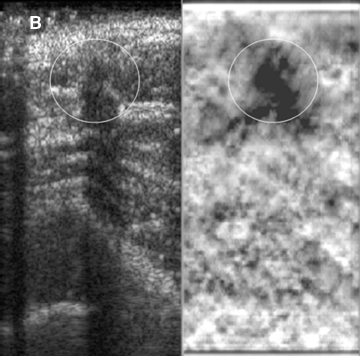
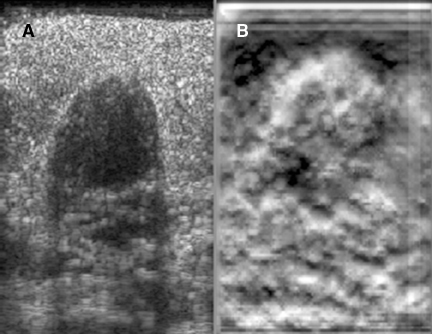
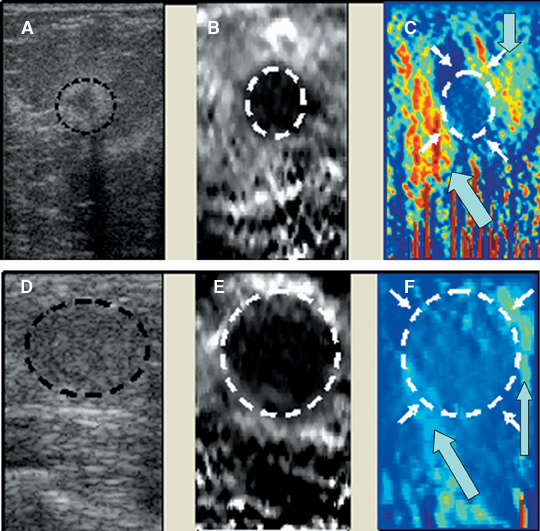
Elastograms are usually used to evaluate a mass seen sonographically as benign or malignant. The two most useful features in making the distinction are the relative stiffness of the lesion and the size of the lesion on the elastogram compared to the sonogram. Cancers tend to be much stiffer (darker) than the surrounding tissues (Figure 5), whereas benign lesions tend to have stiffness similar to surrounding tissue. A benign lesion well seen sonographically may be almost invisible on the elastogram (Figure 6). Because cancers often involve the surrounding tissues, producing an echogenic thick border, the elastogram will very often show a lesion significantly larger than seen on the sonogram(Figure 7). Using these two features, most researchers have been reporting ROC curve areas in the 0.90 – 0.95 range, which represents good performance. Instead of diagnosing cancers, elastography is often used to increase the clinical confidence that a lesion is probably benign,meaning that biopsy can be avoided in favor of follow-up. In our experience, biopsy can be avoided in approximately 15% of lesions that would ordinarily be biopsied without increasing the rate of missed cancers.
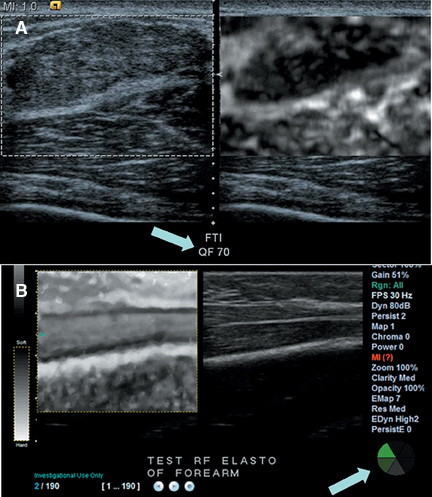
Elastograms can be difficult to interpret because a number of factors can lead to noisy or misleading images. Applying too much pressure to the transducer causes stiffening of surrounding tissue and results in cancers not being very different from their surroundings. Too much pressure also causes sideways movement of a mass, which leads to noise and artifacts in the elastogram, making interpretation much more difficult. Too much or too little movement of the transducer during compression can cause the cross-correlation method used to detect tissue displacement to fail, producing artifacts and misleading “dark” areas. Most manufacturers now place a quality indicator on the elastogram image to aid users in selecting the proper images for interpretation (Figure 8). The quality indicator, which may be displayed as a numerical value or as a color bar, estimates the accuracy of the strain values in the image. Some manufacturers will “gray out” low-scoring images to prevent their use in diagnosis. The methods by which elastogram quality are estimated are still quite variable and most have not yet been proven clinically since the machines are so new.
Plenty of practice is therefore required to produce and interpret elastograms. Lack of sufficient training may be the cause of sporadic reports of poor performance of clinical elastography units. A standardized training system does not yet exist, but would be very helpful for improving the usefulness of elastography.
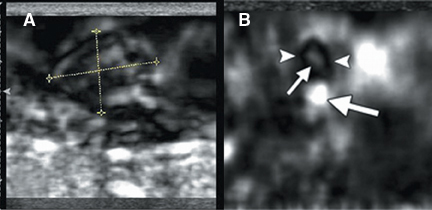
In addition to distinguishing benign from malignant solid masses, breast elastography has proved useful for diagnosing debris-containing cystic lesions, which often masquerade as solid masses. When fluid is compressed the scattering particles in it move more randomly than do the scatterers in solid tissue, producing artifacts on the elastogram that should make it easy to diagnose a debris-filled cyst. Unfortunately,the exact type of artifact produced depends on how the software handles the decorrelation that occurs inside a cyst, as there is no standard appearance that applies to all US systems in clinical use (Figure 9). For the time being, users have to learn the appearance of a cyst on each different system they may use.
A new addition to the elastographic analysis of breast lesions is a technique termed axial shear strain elastography (ASSE). In this method, the sideways movement of the lesion against its surrounding tissues is analyzed using a variant of elastography. This method is sensitive for the detection of lesions bound to the surrounding tissues (such as cancers) compared to benign lesions, whose boundaries are freely moveable against the surrounding tissue. ASSE images may be easier to interpret than elastograms and may prove to be a powerful additional tool for distinguishing benign from malignant lesions (Figure 10).
With the widespread availability of static elastography on commercial systems, elastography has been tried in many organs with variable success. Lymph nodes, thyroid nodules, and prostate cancers have been successfully characterized using elasticity imaging. Strain imaging of atheromatous plaques and blood vessel walls have been produced using the natural pulsations of blood vessels instead of applying direct pressure. Attempts to make the strain estimates more quantitative by using the ratio of strain in a lesion to the strain in an adjacent tissue have been helpful in lesion characterization, but there is no real consensus yet on which ratios to use or what values represent useful diagnostic thresholds. Further improvements in both image quality and quantification can be expected.
Dynamic methods
Although static elastography has been widely implemented and applied to superficial organs, the method is more difficult to use deeper in the body, and the qualitative images have not been demonstrated to have value in detection of diffuse organ diseases, such as hepatic cirrhosis.
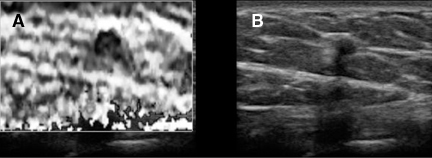
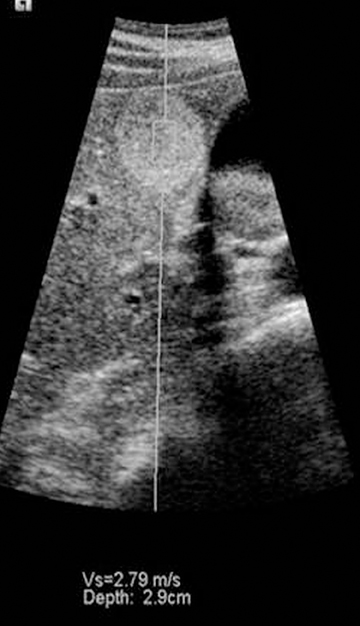
It is possible to use a vibratory stimulus or a singe rapid push to produce shear waves, which travel through tissue slowly enough to be tracked using ultrasound. The rate of propagation of shear waves depends on the shear modulus of tissue, which is usually directly proportional to the Young’s modulus. Thus it is possible to quantify tissue stiffness either within a focal mass or in tissue without a mass using this method. The first ultrasound system to apply this method to diffuse organ disease is the Fibroscan™ by Echosens (Figure 11). This tool is held against the skin over the liver. A piston at the center of the probe sends shear waves into the liver and the velocity of the shear waves is used to estimate the shear modulus. This device has proved useful for the noninvasive diagnosis of cirrhosis and severe fibrosis, though mild changes are not yet reliably detected.
Other systems such as the Siemens S2000 use acoustic radiation force imaging (ARFI) to push on organs using a high-powered ultrasound pulse. A standard elastogram can be created by tracking the displacement caused by the pulse, but the stiffness in a lesion or other area of tissue can also be quantified, since the pulse creates shear waves whose velocity can be estimated (Figure 12). ARFI systems have not yet been granted regulatory clearance by the FDA, but extensive research on the method is being conducted. One other system generates shear waves by rapidly transmitting successive normal power beams with different focal points. This approach has been cleared by the FDA.
Despite the advent of static elastography and ARFI, there is still interest in using vibratory stimuli to produce high-quality stiffness images of various organs. Vibratory stimuli of course may also be used to produce images of organ and lesion stiffness using shear wave velocities as is commonly done with MRI, although this particular approach has not been implemented on any clinical ultrasound scanner.
Conclusion
In summary, ultrasound estimation of tissue elasticity, either qualitative— as with static elastography—or using dynamic methods involving tracking of shear waves, is a rich and rapidly developing technique that promises to improve diagnosis of many different diseases. As with most new technologies, diagnostic criteria and quality control mechanisms are still being established. Interested clinicians are encouraged to begintraining themselves on the proper use of this emerging methodology.
References
- Garra BS. Imaging and estimation of tissue elasticity by ultrasound. Ultrasound Q. 2007;23:255-268.
- Hall TJ. Beyond the basics: Elasticity imaging with US. Radiographics. 2003:23:1657-1671.
- Lerner RM, Parker KJ. Sono-elasticity imaging in ultrasonic tissue characterization and echographic imaging. In: J.M. Thyssen, Editor, Proceedings of the 7th European Communities Workshop, European Communities, Luxembourg (1987) Nijmegen, The Netherlands.
- Ophir J, Cespedes I, Ponnekanti H, et al. Elastography: A quantitative method for imaging the elasticity of biological tissues. Ultrason Imaging. 1991;13:111-134.
- Garra BS, Cespedes I, Ophir J, et al. Analysis of breast lesions using elastography: Initial clinical results. Radiology. 1997:202:79-86.
- Lyshchik A, Higashi T, Asato R, et al. Cervical lymph node metastases: Diagnosis at sonoelastography—initial experience. Radiology. 2007;243:258-267.
- Lyshchik A, Higashi T, Asato R, et al. Thyroid gland tumor diagnosis at US elastography. Radiology. 2005;237:202-211.
- Bae U, Dighe M, Dubinsky T, et al. Ultrasound thyroid elastography using carotid artery pulsation. J Ultrasound Med. 2007;26:797-805.
- Alam SK, Feleppa EJ, Kalisz A, et al. Prostate elastography: Preliminary in vivo results. In: Medical imaging 2005: Ultrasonic imaging and signal processing. Eds: Walker WF, Emelianov SY. Proc SPIE. 2005;5750:339-345.
- Rubens DJ, Hadley MA, Alam SK, et al. Sonoelasticity imaging of prostate cancer: In vitro results. Radiology. 1995;195:379-383.