The Essentials of Quality Improvement in Radiology
Images

In 1999 the Institute for Medicine published To Err is Human, 1 bringing a high level of public attention to errors occurring within the US healthcare system. As a follow-up to this landmark publication, a second report, titled, Crossing the Quality Chasm: Health Care in the 21st Century was released in 2001 which outlined the foundation for healthcare delivery improvement in the United States and around the world. The report identified and recommended improvements in the six dimensions of quality in US healthcare: Safety, Timeliness, Effectiveness, Efficiency, Equity, and Patient Centeredness (“STEEEP”).2
To meaningfully engage in improvement activities, radiologists must comprehend and apply the principles of quality improvement (QI) science and be familiar with the relevant tools.
The goal of this article is to provide a practical guide for radiologists leading or engaging in QI activities. We first present three models of improvement. Thereafter, we discuss the application of select tools commonly used to conduct QI within the radiology setting.
Models of Improvement
In the words of W. Edwards Deming, “It is not enough to do your best; you must know what to do, and then do your best.” Three major models of improvement share certain basic elements of the PDSA (Plan, Do, Study, Act) cycle, which was originally conceived by Deming. This cycle is essentially a restatement of the scientific method, wherein a hypothesis for a change intervention is formed (Plan), tested (Do), and analyzed (Study), allowing for conclusions to be drawn (Act).3,4 Each model also shares a common philosophy centered on continuous data collection and rapid testing of proposed changes.
When selecting a model for a QI project, matching the problem to the appropriate model may achieve the best result. Note that the choice of model of improvement could also be influenced by the overall approach adopted by your department, practice, or organization.5 Keep in mind, however, that the tools and concepts within each are not mutually exclusive. Many principles and applications are shared among the models, which are described here in detail.
Model for Improvement
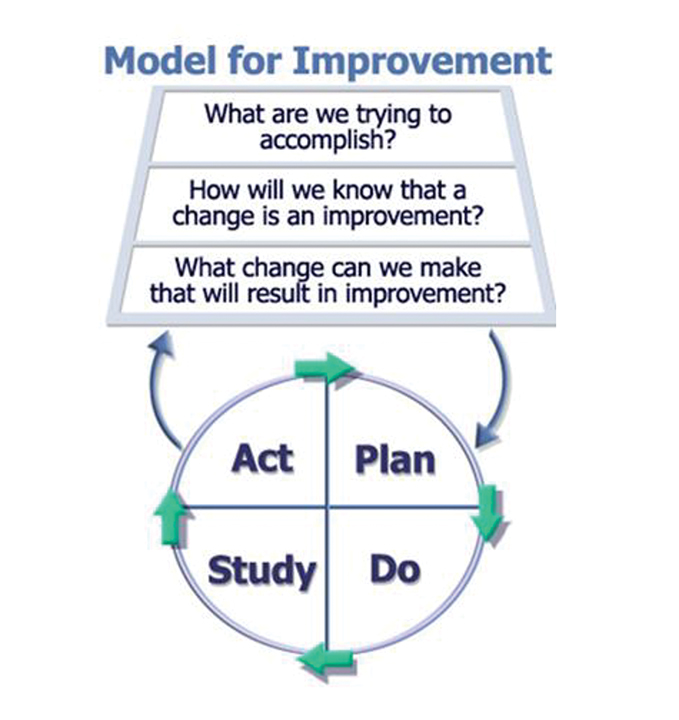
The Model for Improvement (MFI) was developed by the Institute for Healthcare Improvement6 to accelerate improvement by testing changes on a small scale and then rapidly scaling up using multiple PDSA cycles. At the heart of MFI is the SMART aim, an explicit statement designed to reflect the goal of a project; it must be Specific, Measurable, Applicable, Realistic, and Time-bound. The MFI is framed as three questions: 1) What are we trying to accomplish? (ie, SMART aim statement), 2) How will we know a change is an improvement? (ie, battery of metrics), 3) What changes can we make that will result in improvement? (ie, change concepts to be tested with PDSA cycles). 1
In this model, proposed process changes are iteratively tested and results analyzed, similar to scientific hypothesis testing. After analysis of the various metrics (outcome, process, balancing), the results drive the subsequent action, which may be acceptance, rejection, or modification of the proposed change for retesting. The MFI assumes that proposed changes will not be immediately successful or optimized and will require refinement and revision. Rapid-cycle testing is made possible by this model, and testing of changes can be run either in sequence or in parallel.3,5 In keeping with the three central questions of the MFI, implementation only occurs when there is confidence the change will result in improvement, and readiness to make the change has been assessed and confirmed (Figure 1).5
Six Sigma
Six Sigma was developed by Motorola and most famously adopted by Jack Welch of General Electric. The model focuses on reducing variation within a system, which can decrease defects and improve overall quality. Six Sigma utilizes DMAIC, an acronym for Define, Measure, Analyze, Improve, and Control (Figure 2). The approach is data driven and designed to cut the error rate to 3.4 defects per 1 million opportunities, or to limit defects to six standard deviations. Run charts and control charts (discussed later) are often employed to evaluate processes by separating true signal or “special cause” variation from random, “common cause” variation attributed to noise in the data. This method has been successfully applied in radiology to reduce create more consistent and reproducible workflows.5
Lean
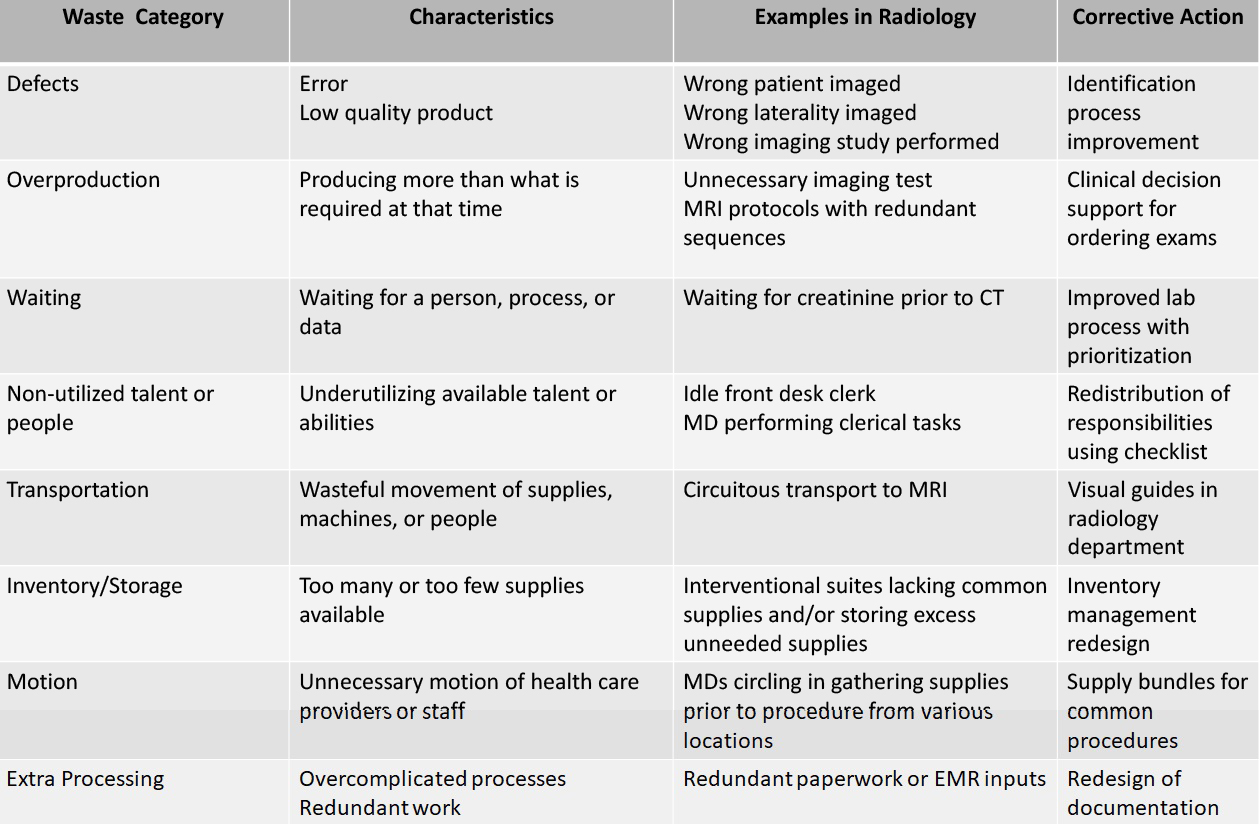
The Lean methodology was developed as part of the Toyota Production System.7,8 Elimination of waste is the foundation of Lean. Waste is further categorized as: Mura, waste related to the presence of unevenness in workload; eg, only scheduling MRI scans during daytime/mid-week); Muri, waste resulting from overstressed staff, equipment, or processes; eg, overbooking outpatient CT scans; and Muda, waste resulting from non-value-added processes; eg, requiring patients to register multiple times during a mammogram visit.
Lean focuses on efficiently providing high value to customers and involves evaluating the current state by directly observing the workplace (“going to the Gemba”), defining the ideal future state (process redesign), and identifying measures to close the gap between the two. Lean has been successfully applied in radiology, which relies on continuous patient throughput and high quality, efficient application of imaging technologies.9
Quality Improvement Tools for Radiology
W Edwards Deming also famously said, “In God we trust. All others must bring data.” Various tools in radiology QI can support project planning, process redesign, and data analysis.
Donabedian Model
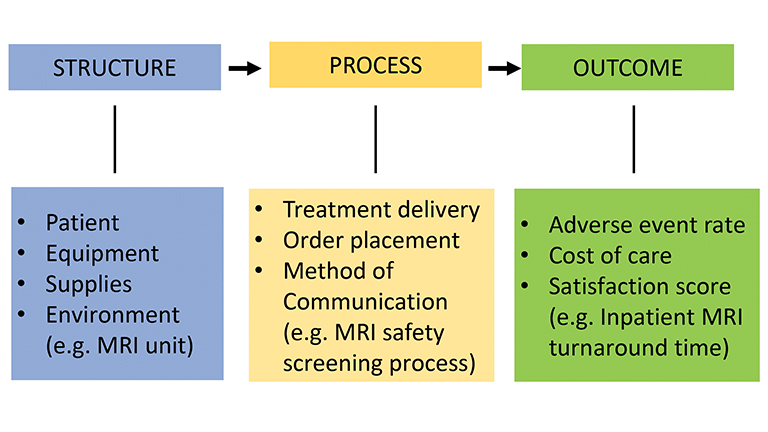
In planning a project, the Donabedian model (Figure 3) can provide a framework and help define the project scope.10 The model is nearly identical to the SIPOC (Suppliers, Inputs, Process, Output, and Customers) methodology used in Lean. The basic components of the Donabedian model are inputs (structure), outputs (outcome), and the key processes between them. The template is best completed backwards, by first identifying an outcome to be achieved, followed by the processes resulting in that outcome, and then by outlining the inputs (structural components of the system) that are required to execute those processes. Including measurable processes is particularly important; failure to do so is the most common mistake in designing and executing a QI project. By engaging with this model at the start of a project, all critical inputs and processes will be taken into account.
Key Driver Diagram
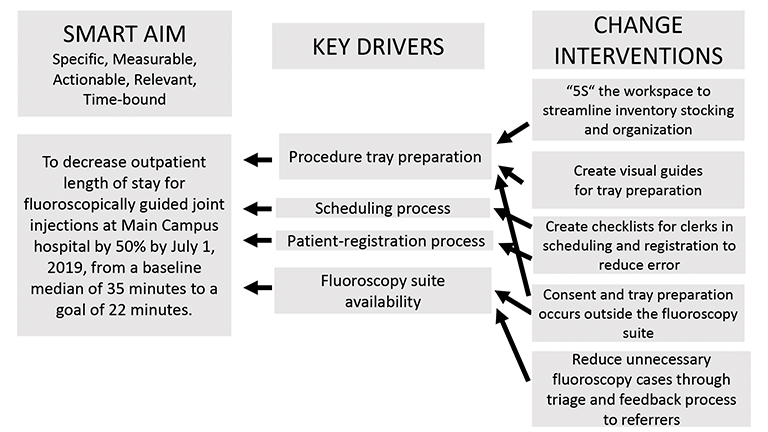
A Key Driver Diagram (Figure 4) is used in the early phases of a project. It begins with identifying the project SMART aim which, again, must be Specific, Measurable, Achievable, Relevant, and Time-bound. The key drivers are identified during brainstorming sessions by the QI team members most familiar with the work, drawing from their clinical experience or other aspects of the workflow. Because they help achieve the aim, these drivers are commonly referred to as the “leading indicators,” while the outcomes are referred to as “lagging indicators.” Both must be measurable. Design changes to the system are identified as change interventions.11 These changes are deliberately intended to improve performance of the key drivers, not the outcome. Importantly, no changes can directly improve the outcome without improving the key processes. Without knowing how the key drivers are performing; ie, without measurement), it is impossible to know why the outcome is improving or getting worse.
PICK Chart
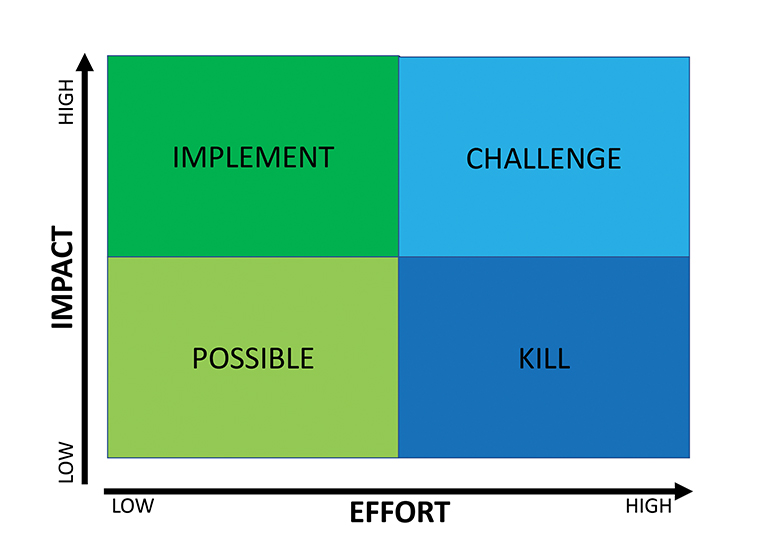
The PICK (Possible, Implement, Challenge, Kill) chart (Figure 5) is used to help determine which changes should be prioritized. This tool incorporates two dimensions: the degree of impact, and the difficulty of implementation (Figure 5).12 The team can review the suggested change interventions together and use sticky notes or a smartboard to place the proposed changes into the quadrants of the chart. High-impact, low-effort changes should definitely be implemented (“Implement”), whereas low-impact, high-effort changes should be avoided (“Kill”). Those that are easy to implement but have low impact may be considered based on time and resources (“Possible”). Those of high impact but high difficulty to enact (“Challenge”), such as creating a new program, may be considered, but they require significant investment in resources to achieve a long-term return aligned with an organization’s overall strategy.
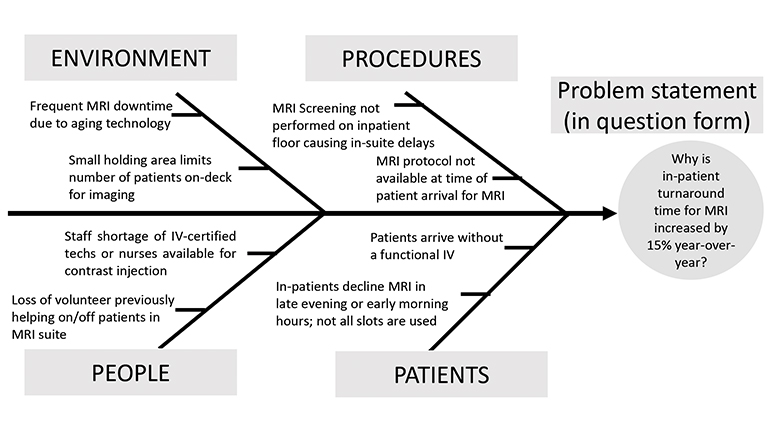
Fishbone Diagram
The Fishbone diagram (Figure 6), also known as a cause and effect or Ishikawa diagram, maps the possible causes of problems into categories. It is useful for identifying all aspects of a particular process or workflow. The tool was designed as a template for root-cause analysis, whereby a manager could ask “why” five times in order to arrive at the cause of a problem. Categories are modified according to the project and may include materials, machines, methods, measurement, environment, and people. 13
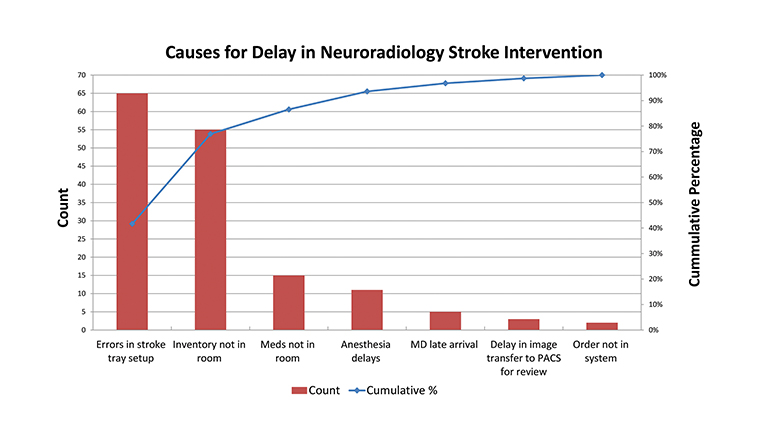
Pareto Chart
The Pareto principle, also known as the 80/20 rule, arose from an observation that approximately 80 percent of a problem derives from approximately 20 percent of the causes. Similar to the PICK chart, the Pareto chart (Figure 7) organizes factors by those that contribute the most to a particular problem; separating the “vital few” from the “trivial many.”14
Waste Walk Tool
Eliminating waste is the central tenet of Lean. The waste in a system may be identified by taking a “waste walk” (or several) through the workplace to record observations of the people, processes, and environment. Wasted time, effort, and other resources can then be categorized and corrective actions developed to eliminate that waste. Corrective actions (change interventions) can then be tested with a PDSA cycle (Figure 8).15
5S
5S is a tool commonly used with Lean to redesign a work environment. The five S’s stand for “sort, set, shine, standardize, and sustain.” A 5S redesign can create a more efficient workflow, saving time and energy, and ultimately eliminating waste. 5S is not a cleaning exercise, but a goal-oriented task designed to achieve a more efficient work environment. The “sustain” component is critical: a workflow process must be sustainable to preserve the changes and avoid reversion to the earlier state (Figure 9).4,9 Recently, health care and other industries, have added a sixth “S” to represent safety priorities when redesigning the workplace.
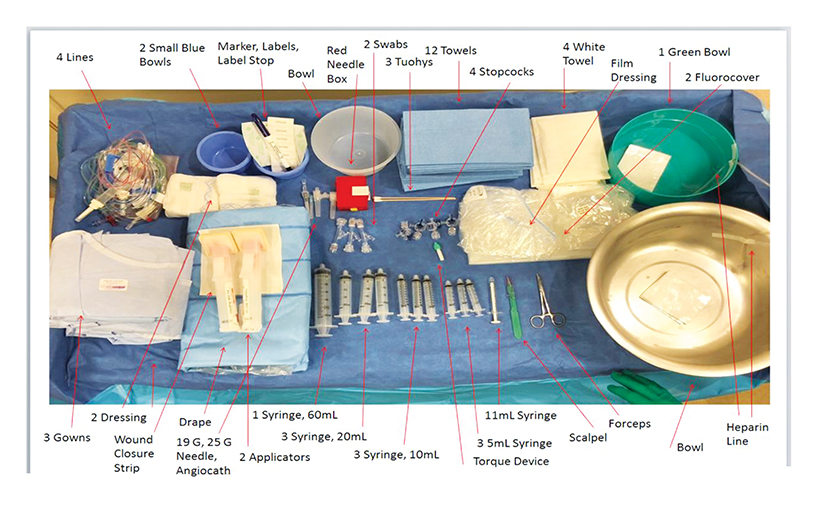
Visual Guides
Visual guides(Figure 9) are extremely powerful tools to support work standardization.4,9 They serve as cognitive aids for both provider and patient, and may be very simple, such as adhesive floor tape for guidance through a facility, or large displays, scoreboards, and/or mounted checklists. For example, a guide featuring a labeled image of a procedure tray may be created to support consistent and reproducible urgent stroke care in neuro-interventional radiology.
Checklists
Checklists are used in many industries to reduce errors. Common examples in radiology include the timeout checklist required by the Joint Commission to be used prior to procedures; checklists used by support staff for patient appointment confirmations; and the structured reporting templates used by radiologists to support adherence to guidelines BI-RADS, LI-RADS, and other scoring systems.9,16,17
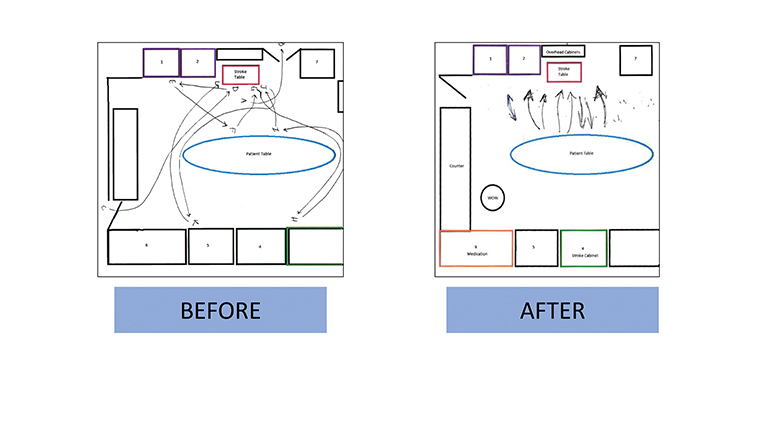
Spaghetti Diagram
Process flow maps are often relied on to precisely delineate the series of events in a process to produce a given result. Creating a flow map includes brainstorming all required steps and defining the sequence of those events, The spaghetti diagram is a specific type of process flow map used specifically to analyze movements within a workspace; it can highlight unnecessary or wasteful movement of people and/or materials.4 Diagrams showing the before and after of Lean QI interventions can highlight the degree of improvement occurring secondary to a change in process.
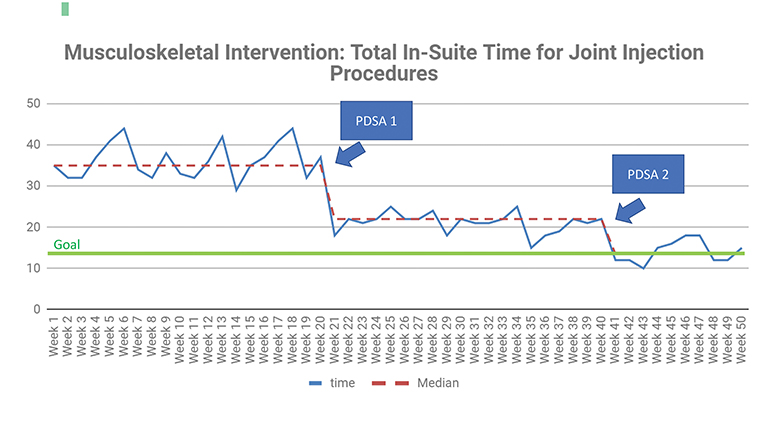
Run and Control Charts
Several tools are available to analyze the performance of a particular process. Run Charts (Figure 10) distinguish between common-cause variation, which is inherent to a system or results from ordinary causes; eg, random variation or “noise,” from special-cause variation, which may be the result of a change intervention that leads to an unstable, unpredictable process. For example, in a Run Chart with enough data points, a true shift indicating special-cause variation is seen if six or more consecutive points appear above or below the baseline median. This is evidence that the change is leading to an improvement.13 Control Charts (aka Shewhart Charts, not shown), which similarly separate random from special-cause variations, can be used to measure change, setting upper and lower control limits to identify non-random variation.
Other tools to be considered are histograms, which can demonstrate variation in continuous data over time, or scatter plots, which serve as graphic representations of the relationships between two variables.4,13
Countless Opportunities to Improve Radiology
Current QI systems allow for nearly countless opportunities for process improvement in radiology. Indeed, the continuous application of QI science can not only greatly enhance patient care, but at the same time also create more effective, efficient, and happier workplaces for all medical imaging professionals.
For, as a quote also attributed to Deming puts it, “It would be better if everyone worked together as a system, with the aim for everybody to win.”
References
- Institute of Medicine. 1999. To Err Is Human: Building a Safer Health System. Washington, DC: National Academies Press.
- Institute of Medicine. 2001. Crossing the Quality Chasm: A New Health System for the 21st Century. Washington, DC: The National Academies Press.
- Lee CS, Larson DB. Beginner’s guide to Practice quality Improvement using the model for improvement. J Am Coll Radiol. 2014; 11:1131-1136.
- Rawson JV, Kanna A, Furman M. Use of process improvement tools in radiology. Curr Probl Diagn Radiol. 2016; 45:94-100.
- Lee CS, Wadhwa V, Kruskal JB, Larson DB. Conducting a successful practice quality improvement project for the American Board of Radiology Certification. Radiographics. 2015; 35:1643-1564.
- Institute for Healthcare Improvement. How To Improve. Available at: http://www.ihi.org/resources/Pages/HowtoImprove/default.aspx. Accessed March 31, 2021.
- Womack JP, Jones DT, Ross, D, et al. The Machine that Changed the World. New York: Free Press; 1990.
- Deming WE. Out of the Crisis. Cambridge MA: MIT Press; 1986.
- Kruskal JB, Reedy A, Pascal L, Rosen MP, Boiselle PM. Lean approach to improving performance and efficiency in a radiology department. Radiographics. 2012;32:573-587.
- Donabedian A. The quality of care: how can it be assessed? JAMA. 1988; 260(12):1743-1748.
- Larson DB, Mickelson LJ. project management for quality improvement in radiology. AJR. 2015;205 W470-477.
- Moran JW, Riley B. Pick Chart. Available at: http://www.phf.org/resourcestools/Documents/PICK_Chart.pdf. Accessed March 13, 2021.
- Kruskal JB, Eisenberg R, Sosna J, ShamYam C, Kruskal JD, Boiselle PM. Quality improvement in radiology: basic principles and tools required to achieve success. Radiographics. 2011; 31:1499-1509.
- Institute for Healthcare Improvement. Focus Your Time and Energy on What Matters Most with Pareto Charts. Available at: http://www.ihi.org/communities/blogs. Accessed March 10, 2021.
- Perfecting Patient Journeys: Waste Walk. Available at https://www.lean.org. Accessed March 13, 2021.
- Larson DB, Towbin AJ, Pryor RM, Donnely LF. Improving consistency in radiology reporting through the use of department-wide standardized structured reporting. Radiology. 2013; 267(1): 240-250.
- Shea LAG, Towbin AJ. The state of structured reporting: the nuance of standardized language. Pediatric Radiol. 2019; 49:500-508.
References
Citation
S C, S G.The Essentials of Quality Improvement in Radiology. Appl Radiol. 2021; (5):26-36.
September 10, 2021