Evaluation of the solitary pulmonary nodule: A practical approach
Images


Dr. Nicholas is an Instructor of Radiology, University of Vermont College of Medicine, Department of Radiology and Fletcher Allen Health Care, Burlington, VT; Dr. Braff is a Resident in Radiology, University of Vermont College of Medicine and Fletcher Allen Health Care, Burlington, VT; and Dr. Klein is an A. Bradley Soule and John P. Tampas Green and Gold Professor of Radiology, University of Vermont College of Medicine and Fletcher Allen Health Care, Burlington, VT.
There has been a dramatic increase in the last decade in the utilization of multidetector computed tomography (MDCT) in the evaluation of chest disease, resulting in an increased detection of solitary pulmonary nodules (SPNs).1 Additionally, the recent preliminary results from the National Lung Screening Trial (NLST) showing the effectiveness of low-dose MDCT screening in reducing lung cancer mortality in high-risk patients will almost certainly lead to increased utilization of chest MDCT, with a resultant marked increase in the detection ofSPNs in asymptomatic patients.2 Proper evaluation and management of SPNs requires integration of clinical information with consideration of the cost and availability of advanced imaging studies and invasive diagnostic and therapeutic procedures. The primary goal of imaging the SPN is to confidently determine if the lesion is benign, suspicious for malignancy, or if indeterminate, whether it requires biopsy or follow-up. The purpose of this article is to review the imaging features of benign and malignant SPNs, and to provide a simplified management algorithm for radiologists and clinicians who evaluate patients with SPNs.
SPN definition
A solitary pulmonary nodule (SPN) is a rounded or oval lesion measuring <3 cm in maximum diameter and completely surrounded by lung parenchyma.3 In order to be classified as an SPN, the lesion cannot be associated with lymph node enlargement, atelectasis or pneumonia. SPNs have a broad differential diagnosis (Table 1).
Artifacts and mimics of SPNs
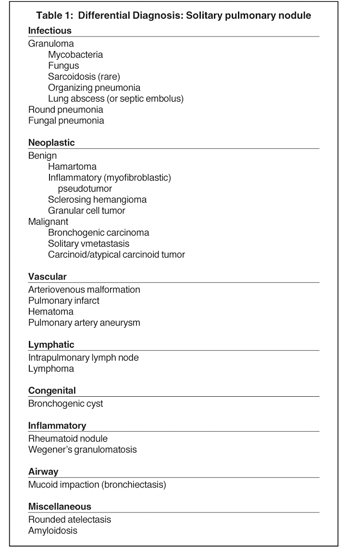
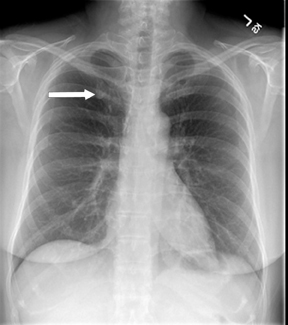
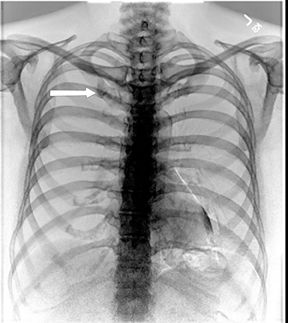
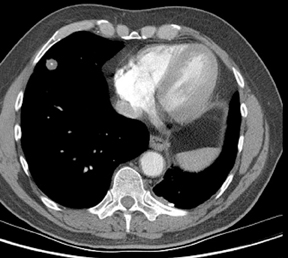
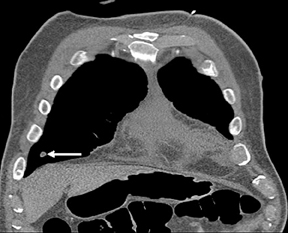
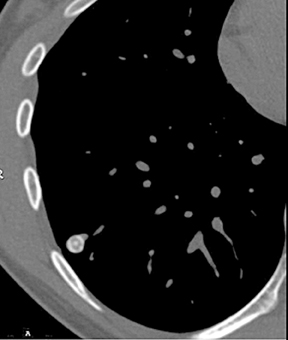
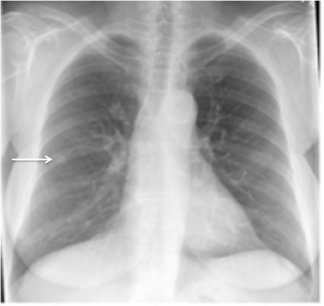
Not all focal densities seen on chest radiography or CT are SPNs. Common focal densities seen on radiography that may simulate an SPN include overlying echocardiography (ECG) leads (Figure 1), skin lesions, bony abnormalities, and pleural lesions. Skin features, commonly the nipples, can mimic intrapulmonary lesions. Correlation with physical examination and repeat radiography, perhaps with nipple or skin markers,may be helpful in distinguishing these from SPNs. Dual-energy subtraction chest radiography can be helpful in distinguishing calcified densities, such as bone islands, costochondral osteophytes (Figure 2), and healing rib fractures from lung nodules, and can more readily identify calcification within SPNs, obviating the need for CT characterization.4
Benign features
Benign calcification
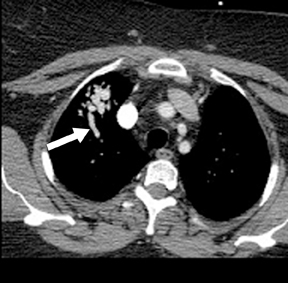
Four patterns of calcification seen within smoothly marginated pulmonary nodules on thin-section CT are specific for benign etiologies.These are central, laminated, or diffuse calcification as seen within granulomas, and popcorn calcification seen in pulmonary hamartomas (Figure 3).5 All other calcification patterns, including eccentric and amorphous calcification, are indeterminate, as up to 10% of bronchogenic carcinoma can demonstrate dystrophic calcification, and rarely a pre-existing granuloma engulfed by malignancy can produce eccentric calcification within a nodule (Figure 4). Rarely, solitary metastases from osteogenic sarcoma or chondrosarcoma can demonstrate a benign calcification pattern, although the correct diagnosis is usually readily evident from the clinical history.
Flat lesions
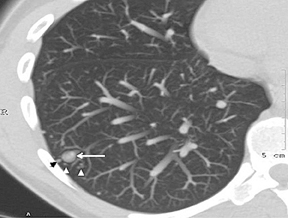
By definition SPNs have a relatively spherical shape. Focal densities with a flat or disk-like morphology can simulate an SPN when oriented in the axial plane. Flat densities typically reflect plaque-like areas of fibrosis or intrapulmonary lymph nodes (Figure 5). One study has shown that a 3-dimensional ratio of >1.78 (ratio of greatest axial dimension divided by greatest cranio-caudal dimension) has a 100% specificity for benign etiologies.6 Benign perifissural nodules on screening CT in current or former smokers are recognized by their flat shape, multiplicity, distribution (ie, typically inferior to the carina), triangular configuration, small diameter averaging 3 mm, and the presence of an interlobular septal connection on thin-section CT.7 Subpleural nodes are also commonly seen along the costal pleural surfaces and demonstrate similar characteristics as perifissural nodules. Multiplanar reconstructions and 3-dimensional volumetric renderings can be helpful in characterizing the shape or sphericity of these benign lesions.
Hamartoma
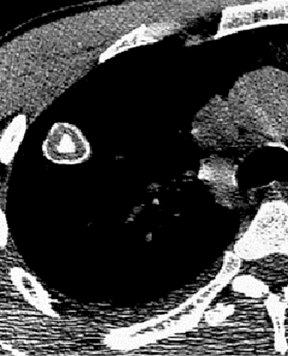
Approximately 60% of hamartomas will contain macroscopic fat, while only a minority will demonstrate popcorn-type calcification. The identification of fat attenuation within a smooth or lobulated SPN on thin-section CT is diagnostic of a pulmonary hamartoma (Figure 6).8
Cysts
A well-circumscribed, thin-walled fluid attenuation nodule without central enhancement represents a benign cyst.
Pulmonary arteriovenous malformation (PAVM)
The identification of a smooth or lobulated SPN with feeding and draining vessels extending toward the hilum from the medial aspect ofan SPN allows for a confident diagnosis of a PAVM (Figure 7).9
Mucocele
A mucocele is recognized as a tubular or branching opacity reflecting mucus within an ectatic bronchus. This should be distinguished from a nodule and is a relatively specific feature for benignity, as tumors very rarely grow longitudinally within a central airway.
Rounded atelectasis
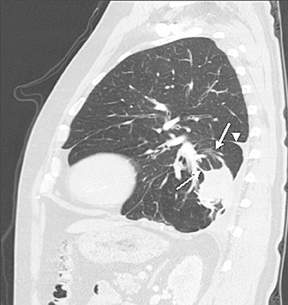
A bundle of curvilinear bronchi and vessels extending from the hilar aspect of a peripheral nodule or mass that lies adjacent to an area of pleural thickening (the “comet tail” sign) and is associated with lobar volume loss with displacement of an interlobar fissure on CT is characteristic of rounded atelectasis (Figure 8). Rounded atelectasis represents an unusual form of lung collapse that develops upon resolution of an exudative pleural effusion, classically a benign effusion due to asbestos exposure.10,11
Polygonal shape (concave margins)
The finding of a nodule with concave interfaces with the surrounding lung on thin-section CT has been shown to have 100% specificity for benign etiologies, although it is an unusual finding (sensitivity = 20% to 28% (Figure 9).6 Most often these polygonal lesions are also nonspherical on 3-dimensional analysis, another indication of their benign nature.
Clustered nodules
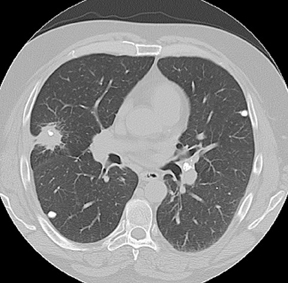
A cluster of small (3 to 15 mm diameter) nodules in a segment or subsegment of lung is almost always indicative of a granulomatous process, either from infection or sarcoidosis. Sometimes the cluster takes the form of a dominant nodule surrounded by smaller (“satellite”)nodules (Figure 10).12
Absence of growth >2 years
For solid nodules, the absence of growth over a 2-year or greater period is indicative of a benign SPN. Therefore any SPN should be compared to prior radiographic or CT studies to determine if the lesion was present previously and if so, whether there has been a change in size.
Features of SPNs suspicious for malignancy
In general, the identification of a SPN >8 mm in diameter in a high-risk patient that demonstrates imaging features suspicious for malignancy will almost invariably undergo biopsy or resection.
Size
Nodular opacities >3 cm are termed masses and are distinguished from SPNs because of their much higher likelihood of malignancy, exceeding 90% in some studies.5 Conversely, very small SPNs rarely reflect malignancy. In the Mayo Clinic CT screening study of 1520 subjects,fewer than 1% of nodules under 4 mm were found to be malignant.1
Lobulated or spiculated margin
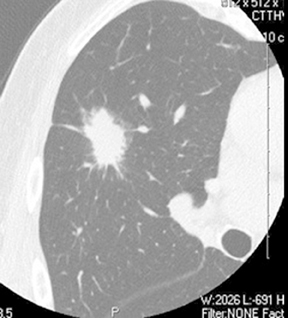
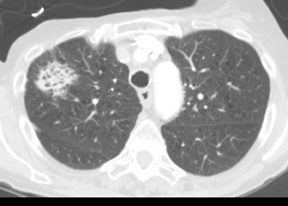
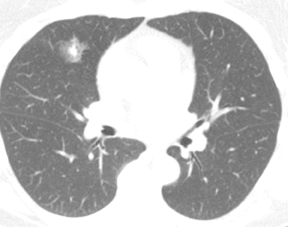
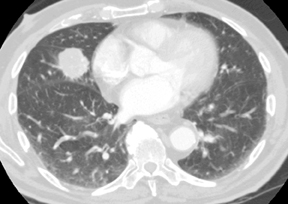
As compared to nodules with smooth margins, nodules with lobulated margins are more likely to be malignant, although approximately25% of benign nodules may have lobulated margins.13 Spiculated margins, also described as showing a sunburst or corona radiata appearance, are highly suspicious for malignancy (Figure 11), although this can also be seen in benign nodules, particularly areas of resolving or organizing pneumonia (Figure 12).5,14
Air bronchograms/bronchiolograms/cystic lucencies
An SPN containing an air bronchogram, bronchiologram, or cystic lucencies is highly suggestive of bronchogenic carcinoma, specifically adenocarcinoma (Figure 13).15 Occasionally this finding can be seen with lymphoma and in benign lesions such as organizing pneumonia and sarcoidosis. For this reason, short-term follow-up of focal opacities that may reflect infection or inflammation is a reasonable approach to evaluation, particularly if there are symptoms suggestive of a recent lower respiratory tract infection.
Airway involvement
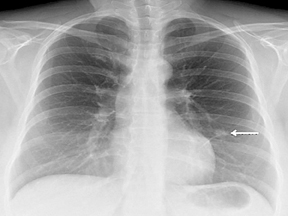
An SPN that involves a peripheral bronchus, seen on CT as an endoluminal filling defect or as bronchiectasis, mucus plugging, or peripheral hyperlucency distal to the lesion, should suggest a malignant SPN due to carcinoid tumor (Figure 14) or bronchogenic carcinoma, as granulomas and hamartomas rarely arise endobronchially as depicted on CT.
Sub-solid lesions
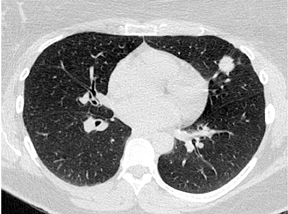
Accumulating experience with CT for lung cancer screening has shown that spherical subsolid lung nodules of pure ground glass opacity (GGO) or mixed ground glass and soft tissue attenuation often represent malignancy. This includes the premalignant atypical adenomatous hyperplasia, bronchioloalveolar carcinoma and mixed subtype adenocarcinoma (Figure 15).16 CT screening studies have shown that 34% to 43% of sub-solid SPNs are malignant.17,18 Furthermore, because of slow growth, relative hypometabolism and nonspecific cytologic and histologic appearances, these lesions present an additional challenge in that they are not readily identified as malignant using growth parameters, contrast enhancement, positron emission tomography/CT (PET/CT), or percutaneous biopsy.Recently published expert opinion has suggested that pure GGO nodules that are stable or growing over a 3- to 6-month follow-up period should be resected, given the insensitivity of PET/CT and difficulties in definitive pathologic diagnosis using percutaneous needle biopsy.19 The same guidelines also recommend diagnostic/staging PET/CT evaluation of mixed solid and GGO lesions >1 cm in size that are stable or growing over a 3-to 6-month period prior to resection, as these lesions have a higher likelihood of representing invasive tumors. Nodules <5 mm do not necessarily require follow up, as the majority of these lesions likely reflect benign disease, whereas pure GGO nodules 5 to 10 mm in diameter are best followed with thin-section CT, for at least 3 years given their inherently slow rate of change. While these guidelines are aggressive, it is clear that given the high probability that a subsolid nodule represents malignancy and the low diagnostic yield of currently existing imaging and percutaneous biopsy techniques, subsolid nodules require a different diagnostic approach than do solidSPNs.
Further characterization of indeterminate nodules
Despite the utility of thin-section CT in SPN evaluation, a significant percentage of SPNs will fail to demonstrate features that allow confident characterization as either benign or likely malignant, and will require more advanced imaging techniques for characterization.
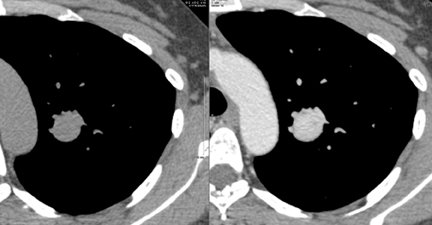
Contrast-enhanced nodule densitometry
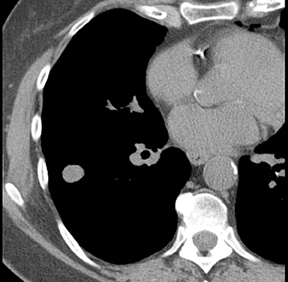
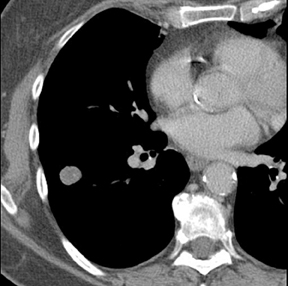
The observation that malignant tumors are relatively hypervascular when compared to benign lesions has led to the use of dynamic contrast-enhanced CT and magnetic resonance (MR) studies to further characterize indeterminate SPNs. A common protocol involves the acquisition of images through a solid 6 to 30 mm SPN before, and 1, 2, 3 and 4 min following intravenous injection of iodinated contrast material to measure maximum change in attenuation due to contrast enhancement. A more elegant method of determining the degree of contrast enhancement following a single postcontrast acquisition is with dual-energy CT (Figure 16).20 A prospective study has shown enhancement values of 15 Hounsfield units (HU) or less to be essentially diagnostic of a benign etiology.21 Unfortunately, peak enhancement>15 HU, while highly sensitive for malignancy, is relatively nonspecific (50% to 60%), since active granulomas and other benign lesions can demonstrate such enhancement. A more recent study found that nodules with brisk peak enhancement of >25 HU in combination with contrast washout of 5 to 31 HU on 15-minute-delayed imaging showed high sensitivity (94%) and specificity (90%) for malignancy.22 False negatives were all adenocarcinomas while false positives included focal pneumonias and other benign nodules. Care must be taken with the interpretation of dynamic enhancement results for larger nodules with areas of central necrosis. Contrast-CT densitometry is most useful in the evaluation of probably benign smaller nodules when PET/CT or biopsy cannot be performed, and in the evaluation of suspected carcinoid tumors presenting as SPNs, since these tumors tend to be hypervascular (Figure 17) but are associated with an approximately 25% false negative rate at PET/CT due to their low metabolic activity.
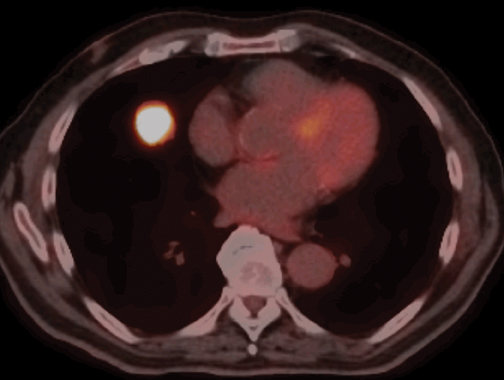
PET/CT
Fluoro-2-deoxy-d-glucose (FDG) PET/CT has high sensitivity (97%) and lower specificity (78%) for the characterization of malignantSPNs >10 mm in diameter (Figure 18).23 Malignancies that can produce false negative PET/CT results include such well-differentiated adenocarcinomas as bronchioloalveolar cell carcinoma and carcinoid tumors. Infections, including granulomatous processes that present asSPNs, can produce false positive examinations. Patients with low or intermediate pretest probability for malignancy and a SPN >10 mm will most benefit from PET/CT, as the results will often guide further management.24 PET/CT is less useful in patients with very low (<5%) or very high (>80%) pretest probability of malignancy, situations where the results of the PET/CT study would be unlikely to change the diagnostic approach to the patient due to relatively high false positive or false negative rates, respectively.
A standardized uptake value (SUV) >2.5 on FDG-PET/CT is typically used to define a positive study. The low spatial resolution of PET imaging makes partial volume averaging an issue in the evaluation of smaller nodules where SUV can be artificially low. Some studies have shown that the application of size-based correction factors to account for effects of partial volume averaging effects can increase the sensitivity of PET/CT for malignancy in small nodules.25 There has also been investigation of dual-time-point imaging to exploit the propensity for malignant tumors to show continued uptake of FDG for several hours after injection, a characteristic not typically seen with benign lesions. With this technique nodules are imaged twice, typically 60 min and 90 to 120min after FDG injection. Nodules that demonstrate any increase in SUV at the second time-point are more suspicious for malignancy. The clinical utility of this technique remains unclear, with recent studies recommending both for and against its use.26,27
Biopsy
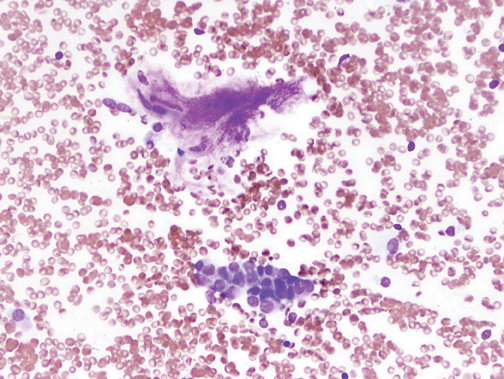
Several methods exist for sampling of pulmonary nodules, including image-guided transthoracic needle biopsy (TNB), bronchoscopicbiopsy using fluoroscopic or electromagnetic guidance, video-assisted thoracoscopic surgery and open thoracotomy. TNB can be performed under CT, sonographic, or fluoroscopic guidance. Typically 20- to 22-gauge needles can be used for aspiration biopsy to obtain cytologic specimens, while 18- to 20-gauge needles are used to obtain histologic samples when indicated. The sensitivity for malignancy in SPNs >5mm in diameter is >90%, while the accuracy for benign SPNs is considerably lower due to their smaller size and nonspecific pathologic characteristics (Figure 19).28 On-site cytopathologic analysis can be helpful in determining the need for additional aspiration specimen for diagnosis, obtaining material for stains and cultures when infection is suspected, or the need for histologic samples using cutting biopsy needles. The most frequent complications of TNB include pneumothorax (~20%) and bleeding, both of which are usually self-limiting.29
Growth
Small SPNs, particularly nodules 5 to 8 mm in diameter, are most often benign and are typically too small to be accurately characterized with PET/CT or TNB. Most such lesions undergo follow up to monitor growth rates, with lesions stable over a minimum of 2 years on radiographs or CT accepted as benign, although this is likely not true for subsolid, well-differentiated adenocarcinomas. For measuring growth rates, nodule volume doubling time (VDT) has been used to help distinguish benign from malignant solid nodules. Doubling time (Td) is calculated with the following equation:
Td = Ti x log 2/3 x log (Di/ Do) where Ti = interval time, Di = initial diameter, Do = final diameter and nodule diameter represents the average of 2 orthogonal measurements through the center of the nodule.30 A diameter increase of 26% in a spherical SPN corresponds to a doubling of nodule volume. Most malignant SPNs have doubling times in the 3-month to 1.5-year range, while benign lesions typically grow more rapidly (ie, and infectious lesion) or more slowly (ie, a hamartoma or granuloma) than malignant lesions. In actual practice, any growth of a small indeterminate SPNas detected on follow-up CT will likely prompt biopsy or resection given the significant overlap in doubling times between benign and slow-growing malignant lesions. Supporting this approach are the results of recent CT screening studies that have found VDTs exceeding 450 days and up to 928 days for malignancy, typically slow growing and less aggressive adenocarcinomas.18,31
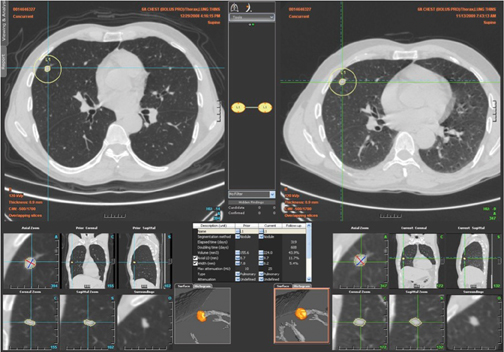
Because of the difficulty in measuring diameter changes of 1 to 2 mm on CT (an increase in diameter that represents a doubling in volume of nodules in the 5 to 8 mm range), and the fact that lesions may not always grow in a symmetric fashion, there has been significant interest in the use of computer-aided analysis of multidetector CT datasets with volumetric nodule analysis obtained during short follow-upperiods of 90 to 180 days.32,33 While these programs can be useful, they have difficulty in segmenting subsolid lesions or lesions adjacent to vessels or the pleura, are not always customizable by the operator, have yet to complete outcome validation studies, and for the most part are not integrated into picture archive and communication systems (PACS) to allow easy access and efficiency of workflow in the clinical environment. For these reasons these automated software programs have not yet entered widespread use. Nevertheless, it is likely that with advances in technology and PACS integration these programs will become an important adjunct in the evaluation of small SPNs in the near future (Figure 20).
Recommended approach to SPNs
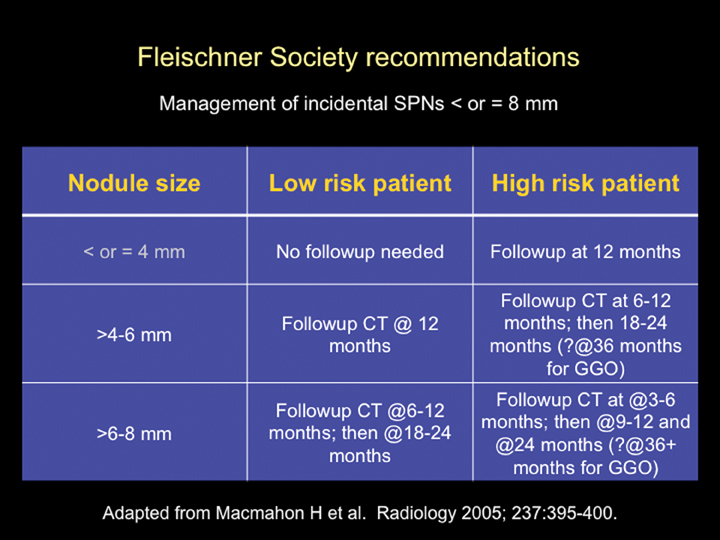
The Fleischner Society has published an evidence-based expert opinion recommendation for the follow-up and management of incidental small pulmonary nodules in patients >35 years. These recommendations are based on the stratification of patients into high- and low-risk categories (based upon lung cancer risk factors, including smoking history, exposure to asbestos, uranium, radon, or a history of lung cancer in first-degree relatives) and the size of the nodule. Nodules <4 mm in low-risk patients do not require follow up. All other nodules require follow up as outlined in Figure 21.34
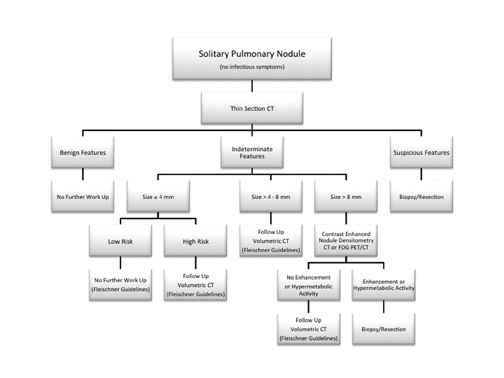
Conclusion
We present an imaging algorithm for the evaluation of SPNs that we have employed at our institution, which is detailed in Figure 22. It should be recognized that differences in patient populations, patient socioeconomic and psychological factors, regional expertise, and accessto advanced imaging modalities will lead to different approaches at each facility.
References
- Swensen SJ, Jett JR, Hartman TE, et al. CT screening for lung cancer: Five-year prospective experience. Radiology. 2005;235:259-265.
- Lung cancer trial results show mortality benefit with low-dose CT. http://www.cancer.gov/newscenter/pressreleases/NLSTresultsRelease. Nov 4, 2010.
- Austin JH, Muller NL, Friedman PJ, et al. Glossary of terms for CT of the lungs: Recommendations of the nomenclature committee of the Fleischner Society. Radiology. 1996;200:327-331.
- Kuhlman JE, Collins J, Brooks GN, et al. Dual-energy subtraction chest radiology: What to look for beyond calcified nodules. Radiographics. 2006;26:79-92.
- Zerhouni EA, Stitik FP, Siegelman SS, et al. CT of the pulmonary nodule: A cooperative study. Radiology. 1986;160:319-327.
- Takashima S, Sone S, Li F, et al. Small solitary pulmonary nodules (< or = 1 cm) detected at population-based CT screening for lung cancer: Reliable high-resolution CT features of benign lesions. AJR Am J Roentgenol. 2003;180:955-964.
- Ahn MI, Gleeson TG, Chan IH, et al. Perifissural nodules seen at CT screening for lung cancer. Radiology. 2010;254:949-956.
- Siegelman SS, Khouri NF, Scott J, et al. Pulmonary hamartoma: CT findings. Radiology. 1986;160:313-317.
- Remy, J, M. Remy-Jardin, L, Wattinne, Deffontaines C. Pulmonary arteriovenous malformations: Evaluation with CT of the chest before and after treatment. Radiology. 1992;182:809-816.
- Partap VA. The Comet Tail Sign. Radiology. 1999;213:553-554.
- Szydlowski G, Cohn H, Steiner R, Edie R. Rounded atelectasis: A pulmonary psuedotumor. Ann Thorac Surg. 1992;53:817-821.
- Carucci, LR, Maki DD, Miller WT. Clustered pulmonary nodules: Highly suggestive of benign disease. J Thorac Imaging. 2001;16:103-105.
- Gurney JW. Determining the likelihood of malignancy in solitary pulmonary nodules with Bayesian analysis. Part 1. Theory. Radiology. 1993;186:405-413.
- Zwirewich CV, Vedal S, Miller RR, Müller NL. Solitary pulmonary nodule: High-resolution CT and radiologic-pathologic correlation. Radiology. 1991;179:469-476.
- Kui M, Templeton PA, White CS, et al. Evaluation of the air bronchogram sign on CT in solitary pulmonary lesions. J Comput Assist Tomogr. 1996;20:983-986.
- Travis WD, Garg K, Franklin WA, et al. Evolving concepts in the pathology and computed tomography imaging of lung adenocarcinoma and bronchioloalveolar carcinoma. J Clin Oncol. 2005;23:3279-3287.
- Henschke CI, Yankelevitz DF, Mirtcheva R, et al. CT screening for lung cancer: Frequency and significance of part-solid and nonsolid nodules. AJR Am J Roentgenol. 2002;178:1053-1057.
- Lindell RM, Hartman TE, Swensen SJ, et al. Five-year lung cancer screening experience: CT appearance, growth rate, location, and histologic features of 61 lung cancers. Radiology. 2007;242:555-562.
- Godoy MC, Naidich DP. Subsolid pulmonary nodules and the spectrum of peripheral adenocarcinomas of the lung: Recommended interim guidelines for assessment and management. Radiology. 2009;253:606-622.
- Chae, EJ, Song, JW, et al. Dual-energy computed tomography characterization of solitary pulmonary nodules. J Thorac Imaging. 2010;25:301-310.
- Swensen S, Viggiano RW, Midthun DE, et al. Lung nodule enhancement at CT: Multicenter study. Radiology. 2000;214:73-80.
- Jeong YJ, Lee KS, Jeong SY, et al. Solitary pulmonary nodule: Characterization with combined wash-in and washout features at dynamic multi-detector row CT. Radiology. 2005;237:675-683.
- Gould MK, Maclean CC, Kuschner WG, et al. Accuracy of positron emission tomography for diagnosis of pulmonary nodules and mass lesions: A meta-analysis. JAMA. 2001;285:914-924.
- Detterbeck FC, Falen S, Rivera MP, et al. Seeking a home for a PET, part 1. Defining the appropriate place for positron emission tomography imaging in the diagnosis of pulmonary nodules or masses. Chest. 2004;125:2294-2299.
- Hickeson M, Yun M, Matthies A, et al. Use of a corrected standardized uptake valve based on the lesion size on CT permits accurate characterization of lung nodules on FDG-PET. Eur J Nucl Med Mol Imaging. 2002;29:1639-1647.
- Alkhawaldeh K, Bural G, Kumar R, Alavi A. Impact of dual time point (18)F-FDG PET imaging and partial volume correction in the assessment of solitary pulmonary nodules. Eur J Med Mol Imaging. 2008;35:246-252.
- Laffon E, de Clermont H, Beguert H, et al. Assessment of dual-time-point 18F-FDG-PET imaging for pulmonary lesions. Nucl Med Commun. 2009;30:455-461.
- Stanley JH, Fish GD, Andriole JG, et al. Lung lesions: Cytologic diagnosis by fine-needle biopsy. Radiology. 1987;162:389-391.
- Klein JS, Zarka MA. Transthoracic needle biopsy. Radiol Clin North Am. 2000;38:235-266.
- Winer-Muram HT. The solitary pulmonary nodule. Radiology. 2006;239:34-49.
- Hasegawa M, Sone S, Takashima S, et al. Growth rate of small lung cancers detected on mass CT screening. Br J Radiol. 2000;73:1252-1259.
- Jennings SG, Winer-Muram HT, Tarver RD, Farber MO. Lung tumor growth: Assessment with CT-comparison of diameter and cross-sectional area with volumetric measurements. Radiology. 2004;231:866-871.
- Revel M-P, Bissery A, Bienvenu M, et al. Are two-dimensional measurements of small noncalcified pulmonary nodules reliable? Radiology. 2004;231:453-458.
- MacMahon H, Austin JH, Gamsu G, et al. Guidelines for management of small pulmonary nodules detected on CT scans: A statement from the Fleischner Society. Radiology. 2005;237:395-400.