Evaluation of hepatic masses by multidetector CTA
Images


Dr. Fishman is a Professor of Radiology and Oncology and the Director of Diagnostic Radiology and Body CT at Johns Hopkins Medical Institutions, Baltimore, MD.
In some ways, computed tomography (CT) of the liver has not changed in 25 years. The goals of imaging remain the detection of disease, definition of the extent of disease, determination of the etiology of hepatic masses, and assistance with patient management decisions. What has changed markedly is scanner technology and contrast delivery and, therefore, our ability to accomplish these goals.
Improvements in scanner technology, particularly multidetector technology, have played a critical role in optimizing lesion detection. Advances in scanning techniques and protocols, including the use of double- and triple-phase scans, have also been important in improving sensitivity for disease detection, and in many cases, specificity. Better image analysis and interpretation, particularly the replacement of axial image analysis with real-time three-dimensional (3D) visualization, will continue to grow in importance over the next several years.
This article will review the basic principles of hepatic imaging, protocol design, clinical applications, and image analysis and interpretation, including the role of two-dimensional (2D) and 3D visualization.
Protocols
In addition to improving lesion detection, 16-slice scanners have simplified the timing of contrast injection and data acquisition. Rather than using multiple bolus injections of contrast material, or a combination of contrast bolus and slow infusion, at our institution, we are now able to inject a single bolus of contrast material. For diagnostic liver examinations, we use oral water as a negative contrast agent. We also typically inject 100 to 120 mL of Omnipaque 350 (GE Healthcare, Princeton, NJ) or Visipaque 320 (GE Healthcare) intravenously at a rate of 3 to 4 mL/sec.
We frequently provide volume displays to referring physicians, particularly surgical oncologists, for use in preoperative planning. Therefore, although the specific scanning protocol will vary by scanner, we routinely select imaging settings that optimize lesion detection, including the use of smaller detectors (0.75 mm), a narrow slice thickness (0.75 mm), and close interscan spacing (0.5 mm) (Table 1).
We generally evaluate liver lesions using both arterial- and venous-phase imaging, although single-phase imaging may be sufficient in some cases, particularly for follow-up studies. Since the introduction of the 16-slice scanner, some authors have examined the potential advantages of doing not only classical arterial-phase imaging at 25 seconds, but also early-phase arterial imaging at approximately 15 seconds. Although some studies have reported reasonably good results with this approach, most have suggested that scanning at 15 seconds is too early to improve detection of hepatic lesions. 1,2
We generally initiate arterial-phase imaging at about 25 seconds and venous-phase imaging at 60 seconds. We reserve late-phase imaging (3 to 4 minutes after injection) for cases in which we may be uncertain of a specific diagnosis or for selected applications in which the contrast density of lesions continues to increase over time. The evaluation of suspected cholangiocarcinoma is one such example.
Vascular mapping
Hepatic lesions have long been described as hypervascular or hypovascular, but little attention has been paid to specific vascular anatomy, such as feeding vessels, draining vessels, and the degree of neovascularity. This information can now be drawn from CT data sets and can markedly improve patient management.
Arterial mapping is of critical importance in preoperative planning. Variations in hepatic anatomy-hepatic and splenic arteries that arise directly off the aorta, for example (Figure 1)-are easily defined on an angiographic study. Similarly, venous mapping provides information that is essential to preparing for complicated surgical procedures (Figure 2).
With the aid of volumetric vascular maps, surgeons are better able to select patients for surgery, plan more carefully for liver transplantation, and perform more aggressive hepatic resections, among other procedures. Vascular mapping is also an important postoperative tool for the evaluation of surgical complications.
Benign hepatic tumors
Benign hepatic tumors are among the most common lesions examined by CT. This category includes hepatic cysts, hemangiomas, focal nodular hyperplasia (FNH), and hepatic adenomas. Many of these lesions do not require intervention. It is important, therefore, that imaging differentiates benign from malignant lesions and provides accurate patient management information to referring physicians.
Hepatic cysts occur in 10% of patients and are the most common type of benign hepatic lesion. They range in size from a few millimeters to 15 to 20 cm (Figure 3). Hepatic cysts are generally very well defined, although small cysts may be difficult to detect on thick-section axial imaging, as a result of partial-volume averaging. 3
Typically, hepatic cysts do not displace blood vessels, and when they do, the displacement is very smooth. Most patients with a hepatic cyst are asymptomatic; however, if the cyst is large enough, it can compress the inferior vena cava and cause lower-extremity edema. In addition, we have seen very large cysts cause ascites due to venous obstruction that necessitate hepatic resection.
Hepatic hemangiomas are also common, particularly in women. They typically occur in the right lobe of the liver, usually in the periphery. Often detected incidentally (Figure 4), they are characterized by peripheral enhancement and central filling-in over time.
In some cases, it may be difficult to differentiate a small hemangioma from a metastatic vascular tumor. A volume display, rather than single axial slices, may be helpful. A maximum-intensity projection (MIP), for example, will make the diagnosis of hepatic hemangioma more certain by demonstrating very bright peripheral puddling. By comparison, metastatic vascular tumors or primary hepatomas typically do not have a peripheral encasement pattern but instead have a more diffuse and irregular enhancement pattern. 4,5
Another characteristic to consider in distinguishing hemangioma from vascular metastasis is the appearance of the vessels supplying the lesion. The vessels supplying a hemangioma are sometimes prominent, but they typically are smooth and normal in appearance. A malignant tumor generally is characterized by irregular, corkscrewing vessels or neovascularity.
With today's fast CT scanners, FNH is observed more often now than it was in the past. These lesions are very vascular and may become isodense within approximately 30 seconds (Figure 5). In the past, when imaging primarily took place during the portal or late-venous phase, the lesion would already have become isodense at the time of image acquisition. Now, with arterial- and dual-phase imaging, FNH lesions are observed more often. 6
Most patients with FNH are women, and <20% have symptoms. These lesions have no malignant potential. In fact, many consider FNH to be a response of the liver parenchyma to a pre-existing vascular malformation. It is very common to see an arteriovenous malformation or hemangioma in patients with FNH. 7
Often with dual-phase imaging, a central scar can be observed in the arterial phase. A scar is not diagnostic for FNH (it is also observed with other lesions such as giant hemangiomas, hepatomas, and cholangiocarcinomas), but it is a classic finding, particularly when it fills in on late-phase imaging. Volumetric vascular maps, by showing the anomalous feeding artery and hepatic venous drainage that are also characteristic of FNH, enable the surgeon to preoperatively plan removal of the lesion. 8
Hepatic adenomas, although benign lesions, have malignant potential and can develop into hepatomas. Hepatic adenomas range in size from 1 to 15 cm. Some 70% to 80% are solitary, although multiple lesions are common in patients with glycogen storage disease or liver adenomatosis. In addition, these lesions can spontaneously bleed, particularly large or multiple lesions. 7
Hepatic adenoma can be differentiated from FNH by differences in attenuation and contrast enhancement in the arterial phase. 9 Typically, FNH enhances to a greater degree than does an adenoma. In one study, the average attenuation value in the arterial phase was 118 ± 18 HU for FNH, as compared with 80 ± 10 HU for hepatic adenoma. 7 This observation does not always hold true in clinical practice, however.
Malignant hepatic tumors
The optimal contrast-enhancement phase, or phases, for the detection of a hepatoma is a matter of debate. It remains an important question in the management of patients with hepatitis B and C, who undergo frequent screening scans.
Hepatoma lesions become isodense very quickly. In the past, with single-slice scanners, arterial-phase imaging was preferred. Today, the ability to acquire images during multiple phases in a short period of time affords us much more flexibility. Research has not, however, provided clear guidance as to the best approach to screening for hepatoma.
Peterson et al 10 studied triphasic imaging in 430 patients with hepatitis B and C. They found that hepatocellular carcinoma was detected most often during the arterial phase.
Kim et al 11 examined the effectiveness of 4-phase imaging, including an early arterial phase (15 seconds after contrast injection). This additional early phase was not found to substantially improve lesion detection, however.
Lim et al 12 evaluated triphasic imaging and found that a combination of late-arterial and portal-venous phases maximized the efficiency of lesion detection.
In some cases, unenhanced scans are helpful as well. This is especially true in cases in which the mass may be a regenerating nodule, which may be hyperdense on noncontrast CT scans.
As indicated earlier, at our institution, we generally use a combination of arterial- and venous-phase imaging, initiating arterial-phase acquisitions at about 25 seconds and venous-phase acquisitions at 60 seconds.
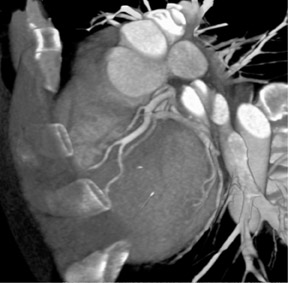
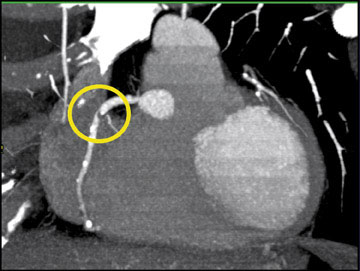
In the examination of hepatic masses, a volume display can yield far more information than axial slices alone. A MIP image, for example, can define the borders of the lesion and demonstrate the feeding vessels and abnormal corkscrewing of the vasculature (Figure 6). The ability to depict neovascularity improves the detection of very small lesions and adds substantial value to the screening of patients with hepatitis B and C. A volume display can determine resectability of a lesion by showing whether it has directly invaded the portal vein, the inferior vena cava, or even the heart. It can also show arteriovenous shunting and guide embolization therapy.
Not every patient who develops hepatoma has cirrhosis or another underlying liver disease. In fact, some have no risk factors for hepatoma. Such patients tend to have larger lesions. In a study by Brancatelli et al, 13 39 patients with hepatoma in the absence of cirrhosis underwent CT scanning. The average tumor size was 12.4 cm. These investigators also noted that in 4 patients, the lesions contained fat and suggested that a finding of fat in a hypervascular hepatic lesion should raise suspicion for hepatoma. 13 Such a finding is also consistent with benign angiolipoma, however.
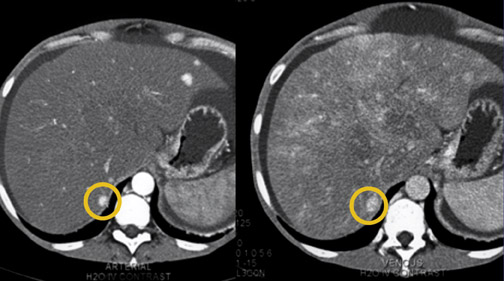
It is sometimes necessary to differentiate hepatoma from regenerative nodules. As shown in Figure 7, a regenerative nodule will often enlarge on venous-phase imaging. Generally, a hepatoma lesion either remains the same size in arterial- and venous-phase imaging, or becomes smaller on the later-phase studies.
Metastatic disease
Metastatic liver lesions may be hypovascular or hypervascular. In the past, CT has been more successful in detecting and characterizing hypovascular lesions-for example, metastases from colorectal cancer. Valls et al 14 used helical CT in the preoperative evaluation of 119 patients with colorectal metastases, reporting that CT successfully identified candidates for hepatic resection 94% of the time.
Today, with CT angiography and multiphase imaging, it is possible to accurately detect hypervascular lesions as well. These include metastases from carcinoid tumors, islet cell tumors, and renal cell carcinomas. Figure 8 shows metastases to the liver from a carcinoid tumor. The lesions, which are <1 cm in size, are revealed on the 3D volume-rendered image by their feeding vascularity.
With larger lesions, 3D vascular mapping may not improve lesion detection, but it can display the extent of the lesion and depict both the feeding arterial vessels and the rapid venous drainage into the inferior vena cava. It may also de-monstrate occlusion of vessels adjacent to the liver. 15,16
Conclusion
The use of proper scan protocols, the optimization of contrast delivery, and the selection of appropriate phase of image acquisitions are the keys to high-quality liver imaging. Sixteen-slice CT scanners offer significant advantages over earlier-generation technology and enable postprocessing to become a routine procedure. This technology also enhances many of the signature characteristics of tumors, enabling not only detection, but also specific identification. This is especially valuable for confidently determining whether small lesions are benign or malignant.
Discussion
W. DENNIS FOLEY, MD: One of the issues we have at our institution is imaging of patients for liver transplant evaluation in whom we find a small, 1-cm, hypervascular region. The question is: Is it a smaller hepatocellular carcinoma or not? You just brought out something that suggests you may have a means to make the distinction between a benign nodule and a malignant nodule. Could you expand on that and give us your practical approach at Hopkins?
ELLIOT K. FISHMAN, MD: Dennis, I know you've written a lot on this subject. The smaller lesions have always been a challenge for us, particularly in a high-risk patient. Obviously, you can look at carcinoembryonic antigen (CEA) and things like that. But one thing we have found is that looking very carefully at the vascular pathway of the lesion may help you. If you see neovascularity, it is a home-run diagnosis.
One of the important conclusions from this series of lectures is that axial CT is only the first step. There is so much information in CT data sets that, for years, we were not able to draw out. Now we are able to look at that information routinely. The liver is a good example. We have never really spoken about vascularity. We speak about hypervascular and hypovascular lesions, but there has been little discussion of feeding vessels or draining vessels. Based the angiographic literature for the last 30 years, it is no great surprise that there is tremendous information there. What we can do now with CT angiography is to really take advantage of classic CT and classic angiography and improve what we can do by putting those two together.
Once we can show the surgeons neovascularity, it will drive more biopsies. So we can be very focused as to the biopsy site and which patients we should biopsy. Again, these patients are often at a high risk for biopsies because of their bleeding problems and with regard to surgical planning, in terms of the likelihood of the lesion being a hepatoma. So it is changing how we practice, and our liver surgeons really rely on that.
U. JOSEPH SCHOEPF, MD : The surveillance and screening of patients with cirrhosis or hepatocellular carcinoma has always been challenging. It has been argued that, especially in patients with cirrhosis, the tissue of the liver is so brittle and the vascular resistance is so high that we have a hard time getting in the amount of contrast that is needed to detect those lesions, regardless how fast you scan or how thin the slices are in those patients. Do you believe there is a way around this with particular use of contrast agents?
FISHMAN : I have no doubt that a patient with cirrhosis is a challenge, and always has been a challenge with CT, MR, or ultrasound. People have looked at different contrast agents, particularly in the research environment, to see what can be done differently. There are a few things that are being worked on. But, in my experience over the last 2 years with 16-slice CT, we have a lot of information we can gain that we were just not looking at before. One of the things that has not yet been examined in a very systematic fashion is what we can do with CT/pathologic direct correlation. It would be particularly useful in patients who undergo transplants where you can really slice the liver very carefully. If you look at the literature in the past, even through 4-slice CT, the results are very poor. Comparisons of CTfindings to a surgical specimen have not provided the greatest results. But I agree with you, it is a challenge, but I think it is a challenge we are better able to cope with now than we have been before. Although, we do not have the statistics yet; 16slice CT has been around for roughly a year and a half, and there are no relevant large series published for it on many applications. It takes a few years to have that data published since the studies have to be done, the data collected, then an article written and published. But it needs to be done because we need true data.
BRIAN R. HERTS, MD: Elliot, we also do a lot of liver transplant evaluations and we are still doing a fair number of ultrasound exams to look at the vasculature. At your institution, is CT angiography eliminating the ultrasound exams that are often performed? Are you just performing a CT?
FISHMAN : I think it is variable. One of the things that changes from institution to institution is how aggressive you are in doing any particular technique. If you are really dedicated to working hard at a technique, you are providing really good clinical service, you have a lot of expertise, and you deal with physicians directly, there is a greater tendency that that technique will be the most valuable one.
I don't want to imply that we are not doing a lot of ultrasound at Hopkins. But we spend a lot of effort on CT and the surgeons are very comfortable with it, so that has been a great tradition for us. We do tend to do a lot of CT. Also, some of the surgeons in the transplant service have trained at other institutions where they also relied on CT, so they have carried that over. It has been a combination of what we do and what the surgeons are used to and what they expect to get.
LEO P. LAWLER, MD, FRCR : Are you referring to imaging transplant donors or recipients?
HERTS : These are the recipients. We still do CT for lesion detection, but they are still ordering ultrasound for everyone for portal vein thrombosis or for direction and degree of portal hypertension. I'm wondering if it would be a useful effort to start giving them angiographic images and see if we can we stop using the ultrasounds now.
FISHMAN : There is no doubt in terms of any single study, the more information you give from a single study, the better. You imaged the renal donors with CTA and you replaced ultrasound, IVP, regular CT, and everything else. If you can take a study and can provide a lot of information to the referring physician, it may eliminate the need for other studies, regardless of the application. It is certainly something to look at.
LAWLER : I think I am a healthy skeptic. But I have a question about when you look at dual-phase imaging of any organ, or both kidney and liver, with multidetector CTs. I wonder sometimes, with the quality of the images, how much you really need dual-phase imaging-whether it is just for vascular imaging, not lesion imaging. On the portal-venous phase, in my experience, the arterial anatomy is superb, and, indeed, with the kidney I also find sometimes it is quite superb on the venous phase. Do you really just want to know branch patterns and where they are? There's no doubt that it is a prettier image if you just have arterial enhancement. But does it add an awful lot more information? Then you could actually get away with a short single-phase acquisition.
FISHMAN : I think it would depend on the organ. One of the things we find in the published literature, for example in a patient with cirrhosis, is that often those small hepatomas will be seen only on arterial-phase imaging. In terms of vascular imaging, it depends on the situation. In our department, Satomi Kawamoto is looking at that situation in terms of renal donors. We have traditionally done two phases, and the question was, can one phase do it? What we are seeing statistically is that this is the case.
LAWLER : These are liver donors, obviously, rather than people with lesions and so forth.
FISHMAN : If you are looking at a liver donor per se, it depends on the type of detail. If you do two acquisitions, you really can optimize the small arterial vessels on arterial-phase imaging. If you want good venous anatomy, it is at 60 seconds for venous-phase imaging. The key is protocol design.
HERTS : I have a hard time displaying some of the smaller vessels using the venous phase, and I really have to work to bring them out. They are probably there, but it is much harder to manipulate the rendering to show them. Whereas using the vascular phase, with many of the preset protocols on the workstations, the vasculature pops up without much effort. It takes less than 10 seconds to find all the arteries, and it is much faster than reading a CT axial image by scrolling back and forth.
GEOFFREY D. RUBIN, MD : You also have to think about what the referring clinicians are looking for. Sometimes having that isolated arterial map is really what they insist upon. If you give them an admixture of arteries and veins, then you have to point it out.
LAWLER : That's another good point. I think one of the shortcomings of a lot of the segmentation tools has been that, once you get the venous phase, you are not able to segment out veins, either portal or hepatic. Having a separate hepatic artery phase makes it very difficult. On the venous-phase imaging, we still have a lot of arterial opacification. So, if someone asks me to just show the hepatic veins, we can do it, especially if you have an interactive movie. You want to give them a select image where it has just been segmented, but I think some of the software has been a little bit behind on that.
RUBIN : Well, particularly if you are getting a biphasic acquisition, the logical way to do the segmentation is with a subtracted image. I think what is lacking in sophistication with all of our CT postprocessing is good registration of nonrigid transformations, which is what occurs when you get a different breath-hold. Moving forward with postprocessing-that is going to be a big area for improvement, and it will open up a lot of avenues for useful visualization.