Normative Left Ventricular Segmental T2 Mapping Values and Relationship With Cardiac Function in Cardiac Sarcoidosis Patients
Images
Abstract
Objective and Hypothesis: Cardiac sarcoidosis (CS) is a difficult-to-diagnose complication of systemic sarcoidosis. T2 mapping is a radiation and contrast-free examination, but the normative values and correlation with important function metrics are not well described. The authors hypothesize segmental T2 values will provide additional information about disease course.
Materials Methods: In this retrospective case-control study 55 sequential patients with sarcoidosis who underwent 1.5T gadolinium enhanced cardiac magnetic resonance imaging for suspected CS had American Heart Association left ventricular segmental T2 values and MRI-derived cardiac function measurements performed.
The ground truth was defined as patients who were defined as “At least probable” by the 2019 WASOG criteria for cardiac sarcoidosis.
Results: 32 patients met WASOG “at least probable” criteria. All left ventricular segments had higher T2 mapping values in patients with cardiac sarcoidosis. Segment medians were 48.9 – 51.4 msec in patients with CS vs 46.3 – 47.9 msec in those without. The median ejection fraction (EF) for CS patients was 62% vs 68% for those without CS. Cardiac sarcoidosis patients in this study had significantly elevated end-systolic volume (ESV) (56mL vs 39 mL, P = 0.002). All T2 segment measurements were negatively correlated with ejection fraction (R = -0.64 to -0.78) in patients with reduced EF, but only middle and apical segments were positively correlated with increased end systolic function (R = 0.31, 0.31).
Conclusions: Median segmental T2 values for CS ranged from 48.9 – 51.4 msec. Patients with CS present with a 6% lower EF than their noncardiac controls. Elevated apical and mid T2 values were positively correlated with worsening systolic function and all segments were strongly negatively correlated with decreased EF. T2 mapping positively differentiates cases of cardiac sarcoidosis and correlates with important cardiac functional measurements.
Keywords: Cardiac Sarcoidosis, Cardiac MRI, Heart Failure, Non-ischemic Cardiomyopathy
Introduction
Cardiac sarcoidosis (CS) is present in up to 25% of patients with systemic sarcoidosis and represents a diagnostic challenge owing to the patchy distribution and paroxysmal flaring of disease.1 Current diagnostic methods revolve around the use of fluorodeoxyglucose positron emission computed tomography (FDG-PET/CT) for detection of hypermetabolic foci in the myocardium, late gadolinium enhancement (LGE) on cardiac magnetic resonance (CMR) imaging for identification of fibrosis, T2 CMR imaging for detection of myocardial edema, or some combination thereof.2-4 Notably, radiologic diagnosis is the standard of care as endomyocardial biopsy has a reported 20-30% sensitivity owing to the patchy nature of disease.1,5
Confounding the diagnostic approach are the drawbacks of each agent; use of gadolinium-based contrast is contraindicated in patients with severe chronic kidney disease due to risk of nephrogenic systemic fibrosis, and FDG-PET delivers a large radiation dose and is patient-dependent for adequate glycemic suppression of the myocardial metabolic signal.6,7 FDG-PET is most avidly used for diagnosis of active myocardial inflammation due to the larger body of literature supporting normative values and distribution of myocardial metabolism, while MRI largely identifies LGE as chronic cardiac sarcoidosis due to the pathology of interest being myocardial fibrosis, which is not present in the acute setting.4,8 Notably, substantial overlap occurs in acute-on-chronic cases of CS, where active myocardial inflammation is superimposed on a background of fibrosis and the variable chronicity of findings is not well described.9,10
Recently, T1 and T2 mapping of the left ventricular myocardium has gained traction for its theoretical use as an adjunct for diagnosis of CS due to the lack of contrast needed, lack of radiation, and ability to describe active and chronic sequelae of myocardial inflammation.11 Multiple studies have shown utility in T2 mapping for active disease, describing normative whole-heart T2 values, which are significantly elevated in patients with CS.11-14 Further studies correlate elevated T2 mapping values with important cardiac outcomes and demonstrate resolution of T2 signal with treatment initation.3,15 Ultimately, CS does not have a uniform cardiac predilection, and instead has a predilection for the basal and inferior myocardial segments.16 Therefore, it is reasonable to consider that regional and segmental variations in cardiac sarcoid, and hypothetically T2 mapping values, may have important implications for the diagnosis and prognostication of disease.
There is a lack of literature on the segmental variation and relevance to important cardiac measurements, limiting further characterization and radiologic-pathologic correlation of disease. Notably, T2 mapping can address this deficiency because of the standard short-axis, three-slice view of the left ventricle, which can be reconstructed according to American Heart Association (AHA) left ventricular segments.17 Therefore, the purpose of this study is to identify normative values of the myocardium in patients with sarcoidosis who have undergone CMR for the investigation of cardiac involvement of disease and to determine the extent of relationship with important MRI-derived cardiac function metrics. The authors hypothesize that segmental T2 mapping values will correlate with important cardiac function metrics because T2 mapping measures extent of acute pathology in cardiac sarcoidosis.
Methods
Ethics Statement
In accordance with the Health Insurance Portability and Accountability Act of 1996, a study protocol was submitted to the institutional review board at the covering institution and was deemed to be IRB-review exempt due to its retrospective nature and the need for informed consent was waived. All data was stored on encrypted network databases and no patient identifiers were shared across platforms.
Study Design and Patient Cohort
For this retrospective case-control study all patients with sarcoidosis who underwent a cardiac magnetic resonance imaging study with T2 mapping series from 2017 to 2020 were queried at a single institution. Inclusion criteria included a clinical or pathologic diagnosis of systemic sarcoidosis and age > 18 years. Exclusion criteria included patients with amyloidosis, myocarditis, hemochromatosis, or severe pulmonary hypertension. Technical exclusion criteria included severe artifact (pacemaker, motion, etc.) or outside institution referrals without access to necessary demographic and medical records. The ground truth for CS was defined as patients meeting “at least probable” World Association for Sarcoidosis and Other Granulomatous Disorders (WASOG) revised criteria independent of T2 mapping.18 Fifty-five patients were ultimately included who met the criteria; seven patients with incomplete records and four patients with severe pulmonary hypertension were excluded.
WASOG Criteria for the Diagnosis of Cardiac Sarcoidosis
- “Highly Probable” — Defined as patients with a positive endomyocardial biopsy (EMB) with no alternative cause. EMB was not performed in any of these subjects and is not routinely performed at the authoring institution owing to noted sub-par diagnostic performance.
- “At Least Probable” — Defined as one of the following:
- Treatment responsive cardiomyopathy or atrioventricular nodal block
- Reduced LVEF in the absence of other clinical risk factors
- Spontaneous or inducible sustained ventricular tachycardia with no other risk factors
- Mobitz type II or third-degree heart block
- Patchy uptake on dedicated cardiac 18-fluorodeoxyglucose positron emission tomography
- Delayed enhancement on cardiac magnetic resonance imaging
- Positive gallium uptake
- Perfusion defect
Cardiac Magnetic Resonance Imaging and T2 Mapping Parameters
All MRI studies were conducted on a 1.5T system (MAGNETOM Avanto, Siemens Healthineers, Erlangen, Germany). Cine acquisitions, native T2 mapping, and LGE imaging were performed as part of a comprehensive clinical cardiac MRI protocol. All subjects were scanned in a head-first supine position using 24-element spine and 6-element surface phased-array coils. All acquisitions were ECG triggered or gated and performed during end expiration. Native T2 mapping was performed in three short-axis slices (basal, midventricular and apical), using a commercially available T2 prepared bSSFP sequence with three preparation pulses of 0.0ms, 30.0ms and 55.0ms and a recovery period of three heart beats to obtain T2 maps in the diastolic phase. Further typical pulse sequence parameters were applied as follows: TR/TE 2.49 / 1.06 ms; FOV 360 × 210 mm; matrix 256 × 256; slice thickness 8 mm; flip angle 70°; and band width 1150 Hz/pixel.
Left Ventricular Segmentation
The left ventricle was divided into sixteen segments according to the AHA left ventricular mapping criteria.17 Segment 17 was excluded due to inaccuracies in measurement in this region due to chest wall proximity. All segmentation was performed by one reader.
Statistical Analysis
A pretest power analysis was conducted for the pairwise comparison of T2 and cardiac function values between patients with and without cardiac sarcoidosis. Assuming a standard alpha of 0.05 and power of 0.8, effect sizes greater than or equal to 0.68 were reliably identified. For correlation of T2 and cardiac function values, correlations with a magnitude greater than 0.36 were reliably detected. Data was summarized using medians and interquartile ranges given the non-parametric distribution of data. Quantitative comparisons were conducted using the Mann-Whitney U test. Correlation analyses were performed using spearman’s log-rank correlation.
Results
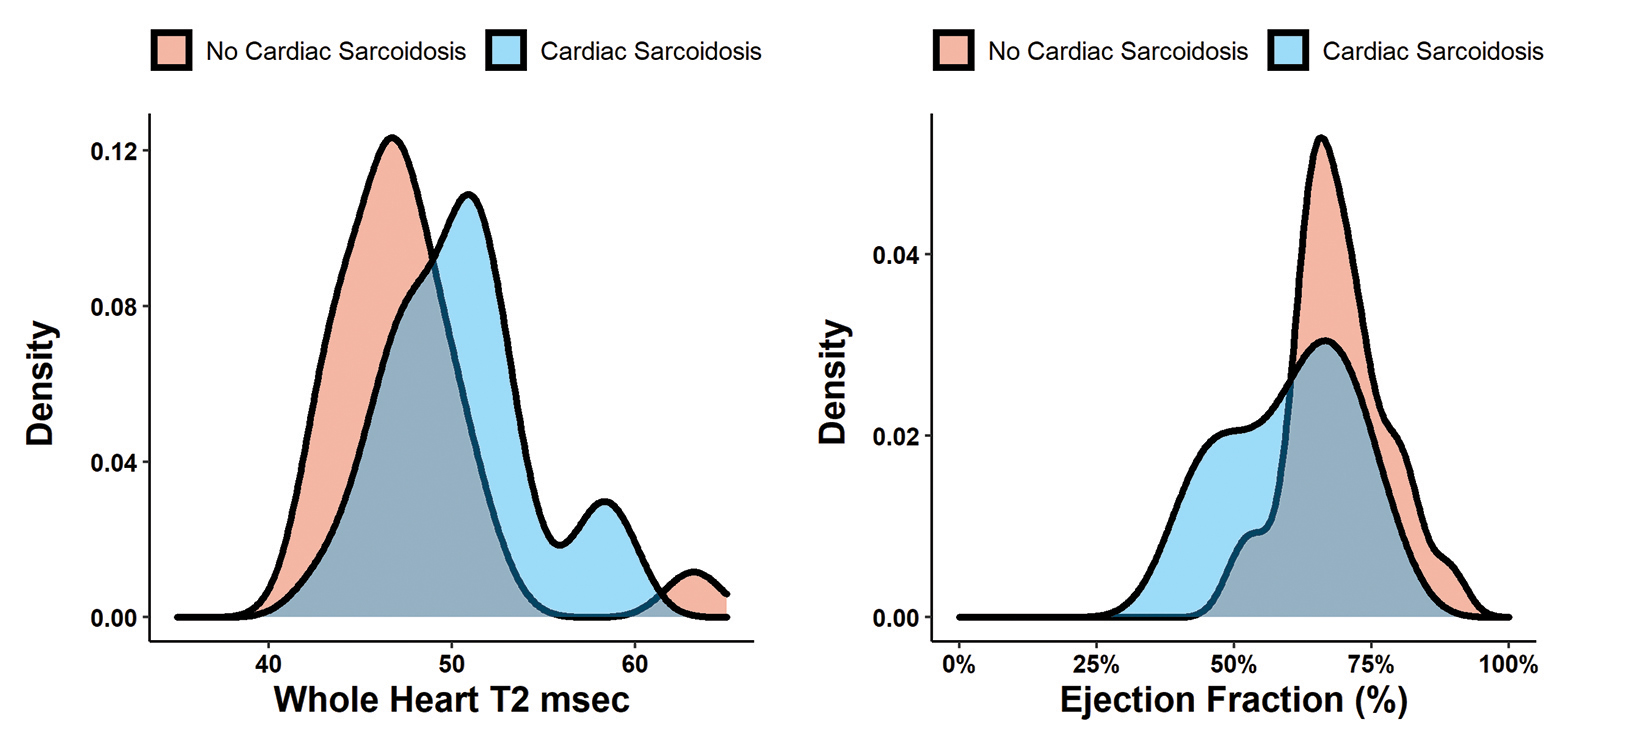
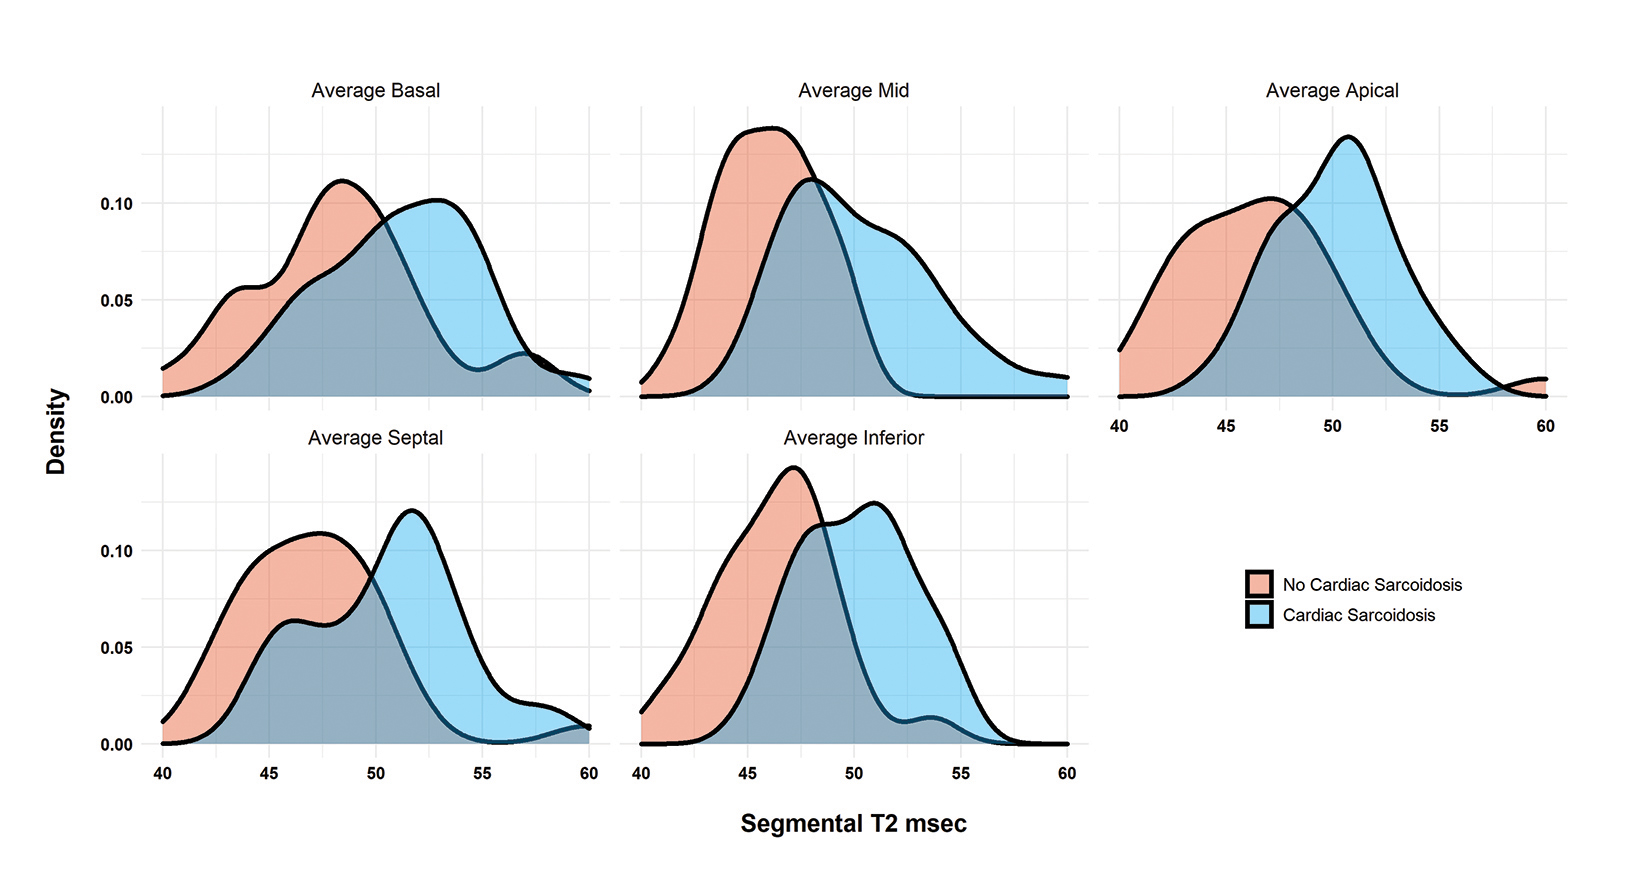
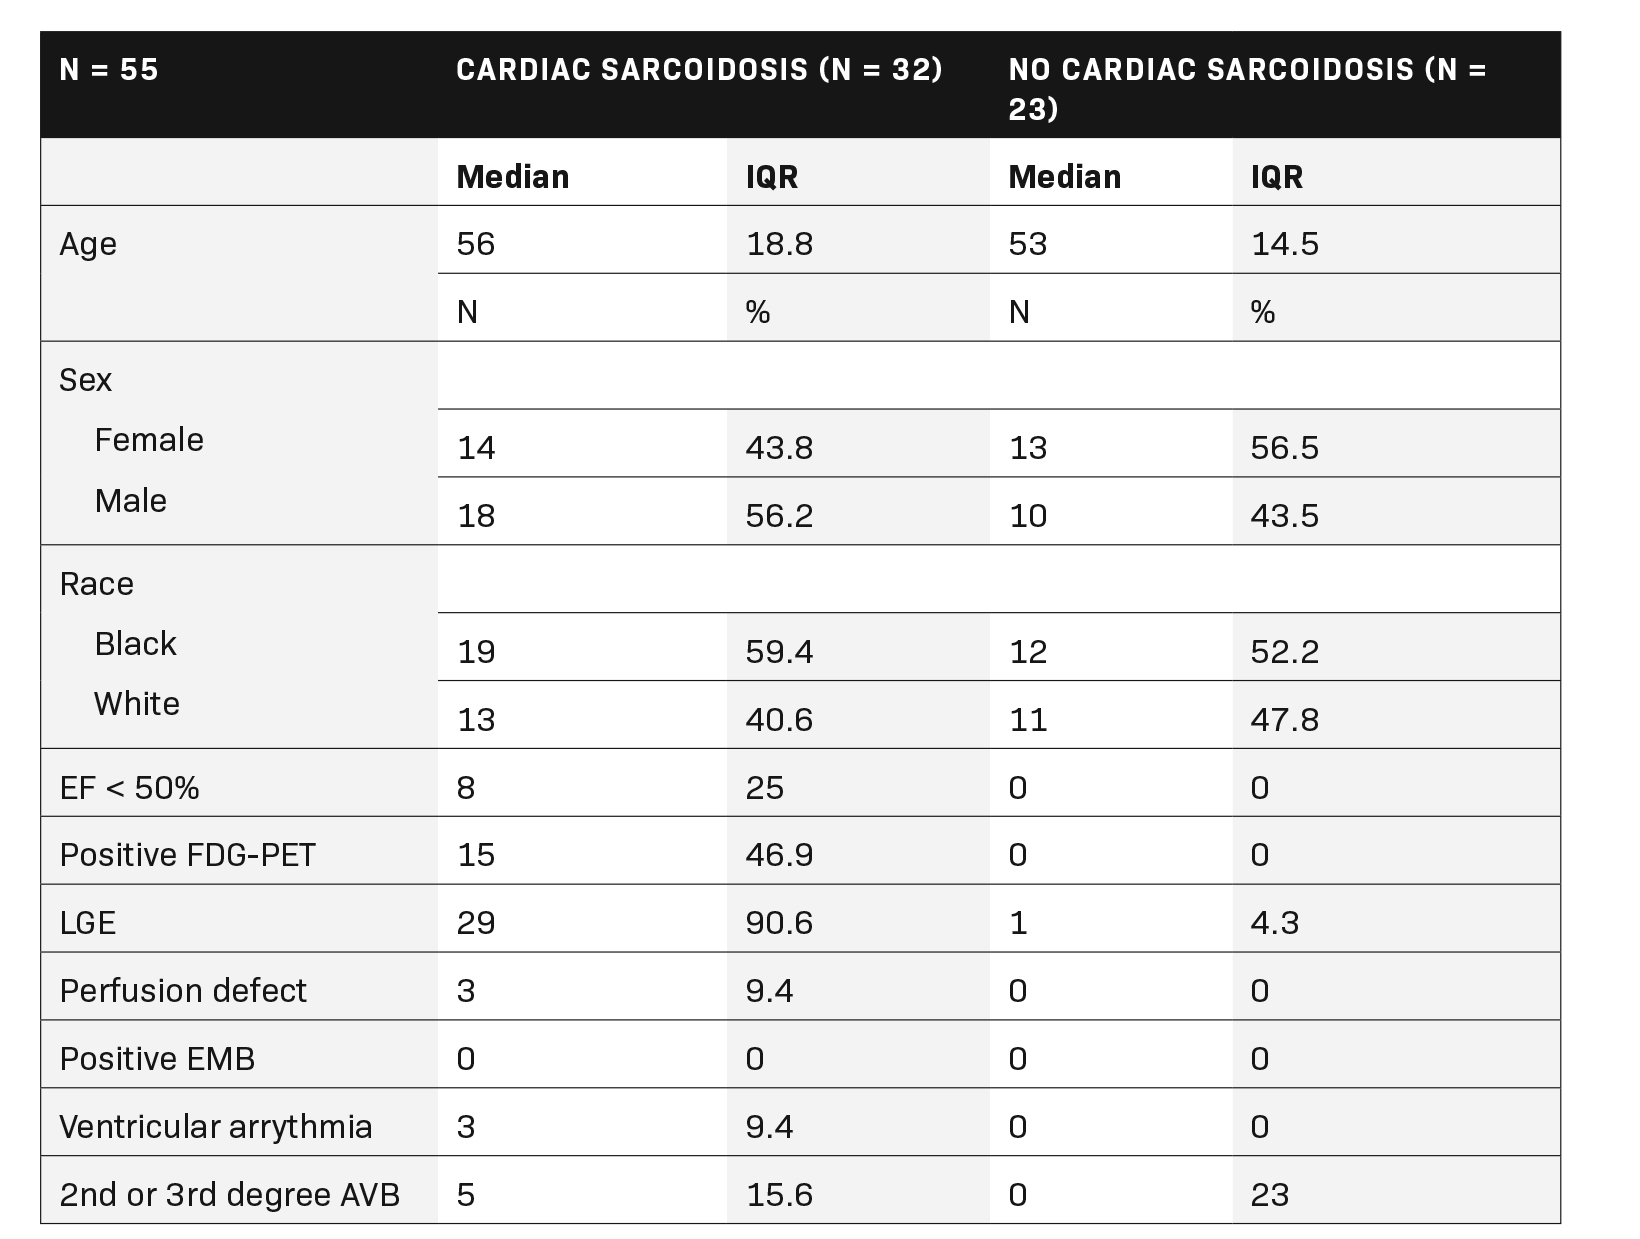
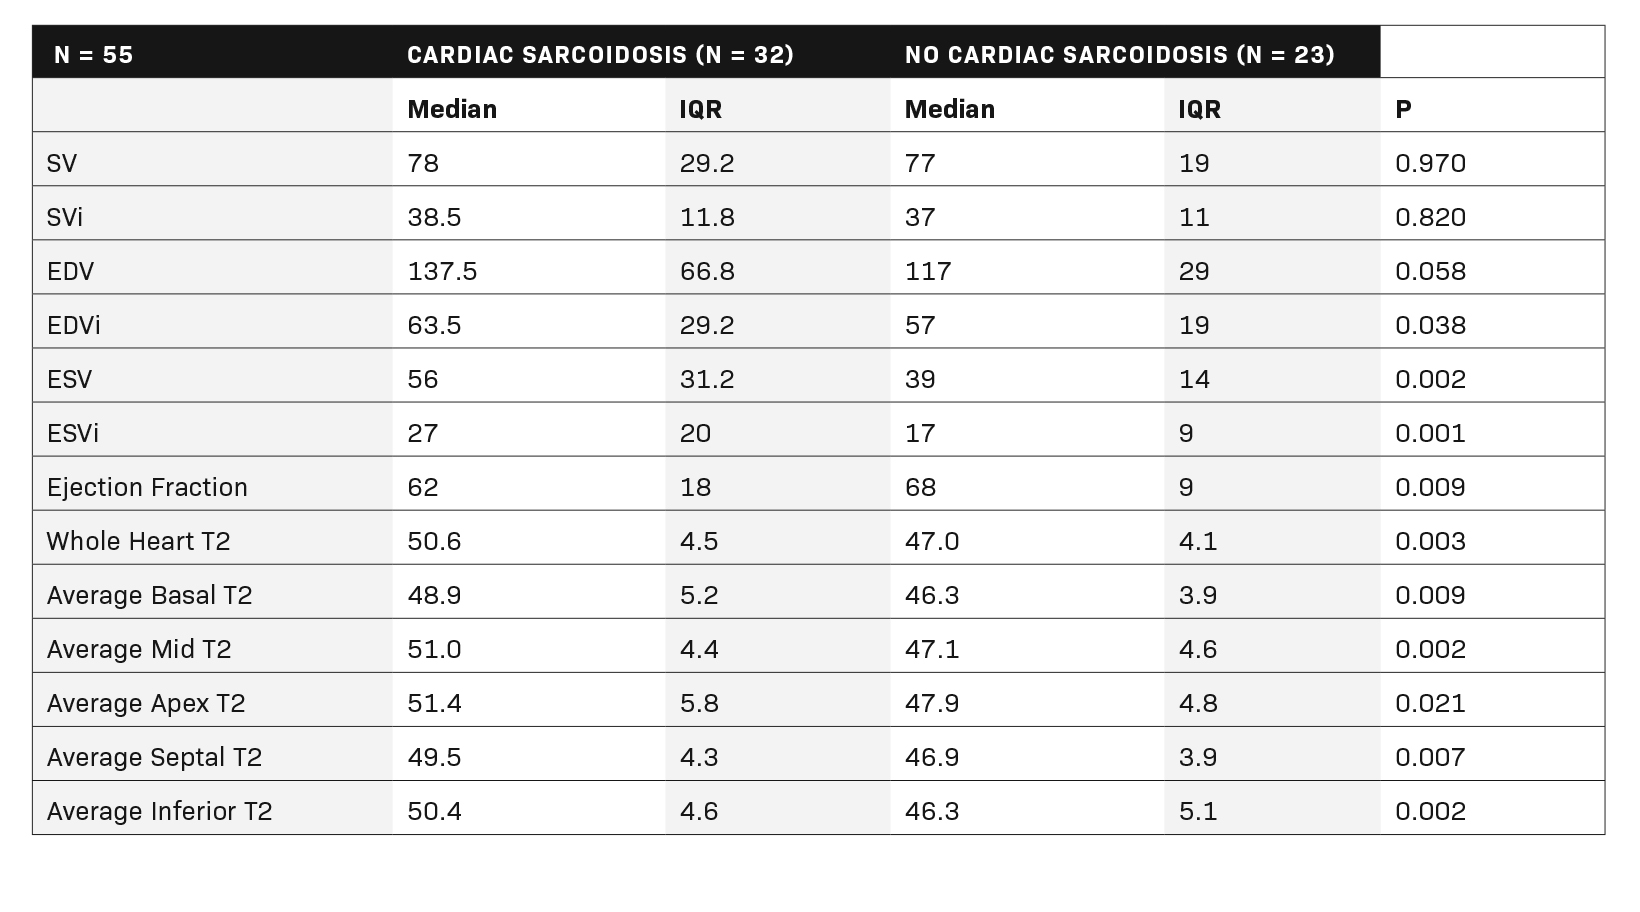
Fifty-five patients (32 with CS according to the WASOG criteria and 23 without) were included in the final cohort. (Table 1). Patients with CS had globally elevated T2 mapping values in comparison to those without cardiac sarcoidosis (T2Wholeheart 50.6 ± 4.5 vs 47.0 ± 4.1; p = 0.003). (Figure 1A). The segments with the highest T2 values were the apical and mid-ventricular segments (Median 51.4 and 51.0, respectively). The region with the most variability was also the apical segment (IQR 5.8). All segment T2 values were elevated in patients with CS as opposed to those without. (Table 2 and Figure 2).
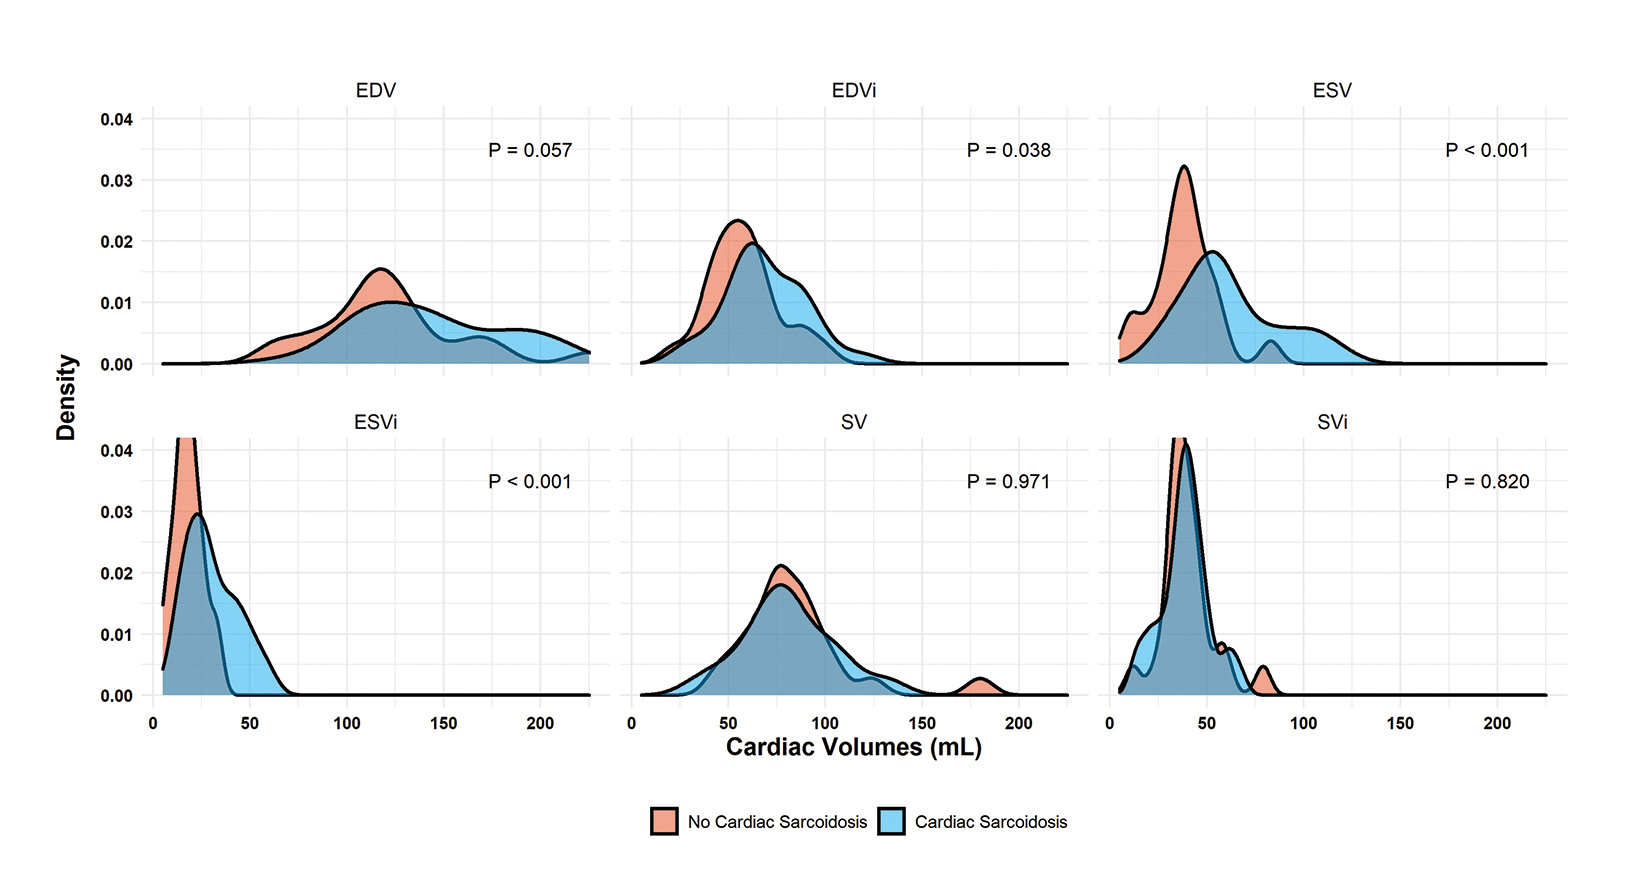
Regarding cardiac function, patients with cardiac sarcoidosis had an average ejection fraction of 62 ± 18 vs 68 ± 9 (p = 0.009). (Figure 1B). Patients with CS also had elevated end-systolic volumes indexed to body mass index (BMI) (ESVi) compared to those without CS (27 ± 20 vs 17 ± 9; p = 0.002). Patients with CS also had higher end-diastolic volumes indexed to body mass index (EDVi) compared to those without CS (63.5 ± 29 vs 57 ± 19, p = 0.038), but nonindexed values were not significantly different (p = 0.058).
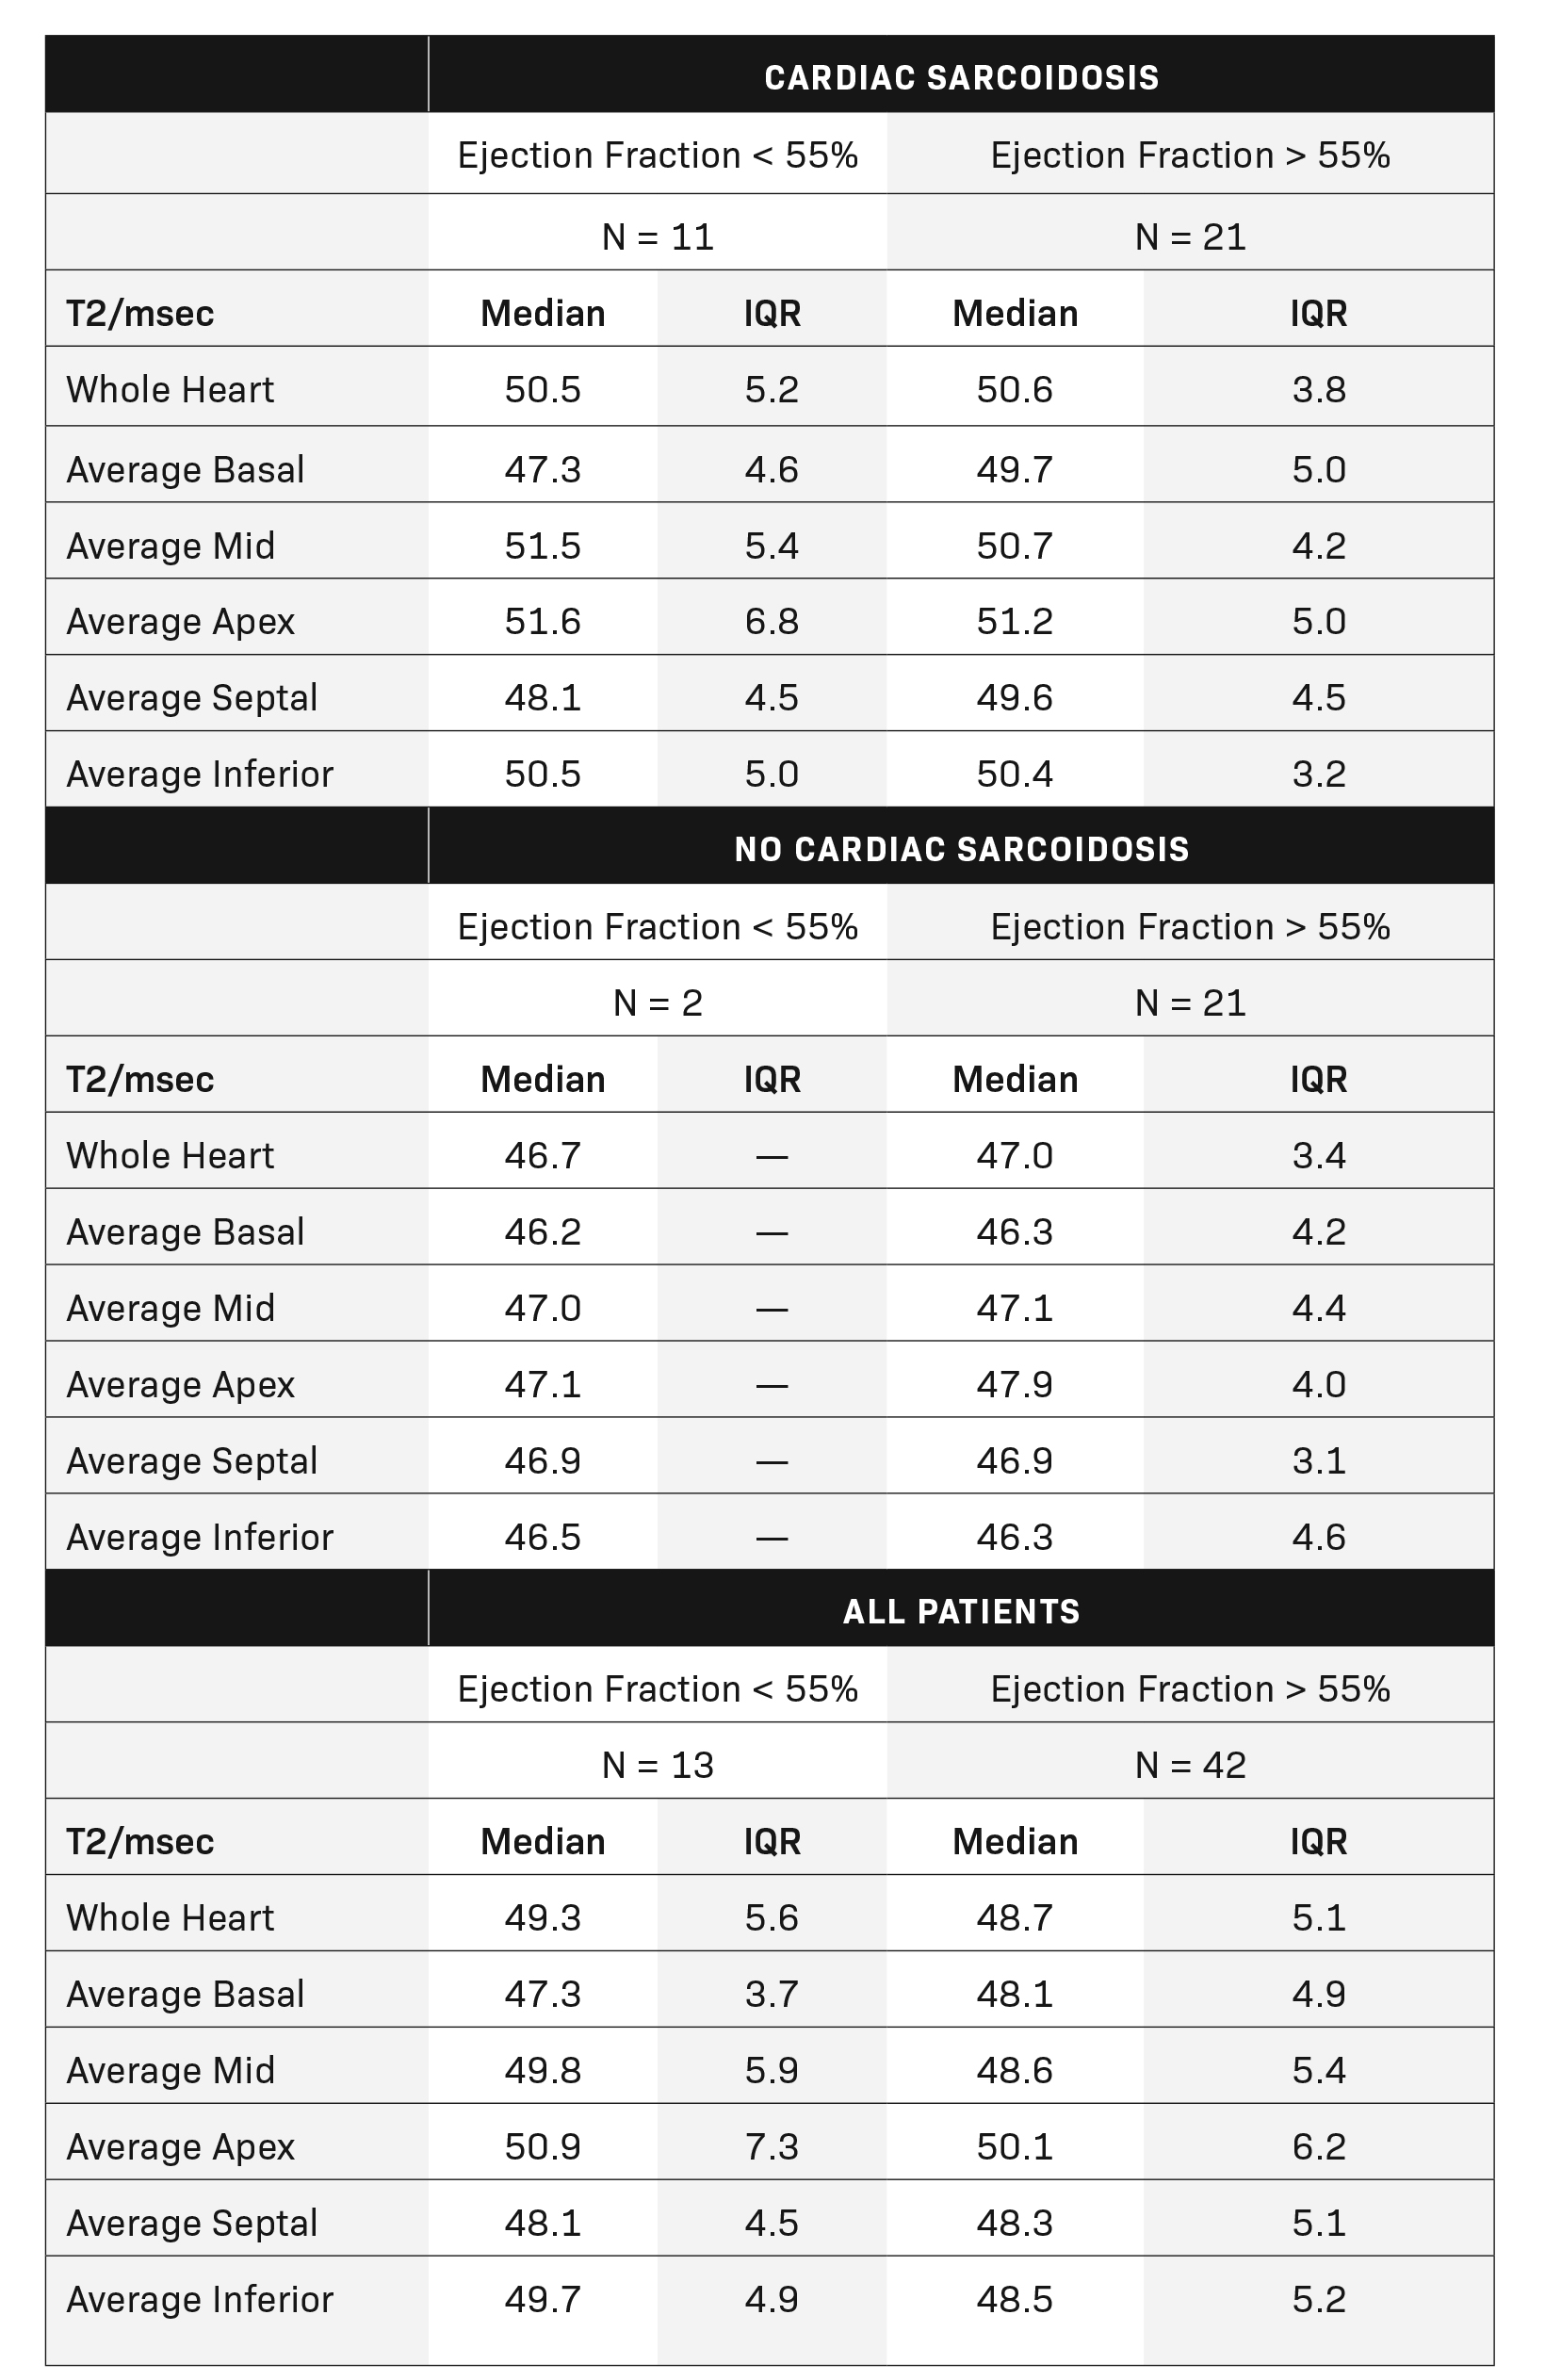
There was no difference in stroke volume between patients with and without CS (78 ± 29 vs 77 ± 19). (Table 2 and Figure 3). The normative values for patients with and without CS as stratified by ejection fraction is given in Table 3. Median T2 values for patients without CS ranged from 46.3 – 47.9. Patients without sarcoidosis but with ejection fractions of less than 55% ranged from 46.2 – 47.1%. The 75th percentile whole heart T2 value for patients without CS was 50.4. The median whole heart T2 value for patients with CS was 50.5 (IQR 5.2). The highest values for CS patients were observed in the apical and mid-ventricular segments (51.6 and 51.5, respectively). As a group, CS patients with normal and abnormal ejection fractions did not vary widely.
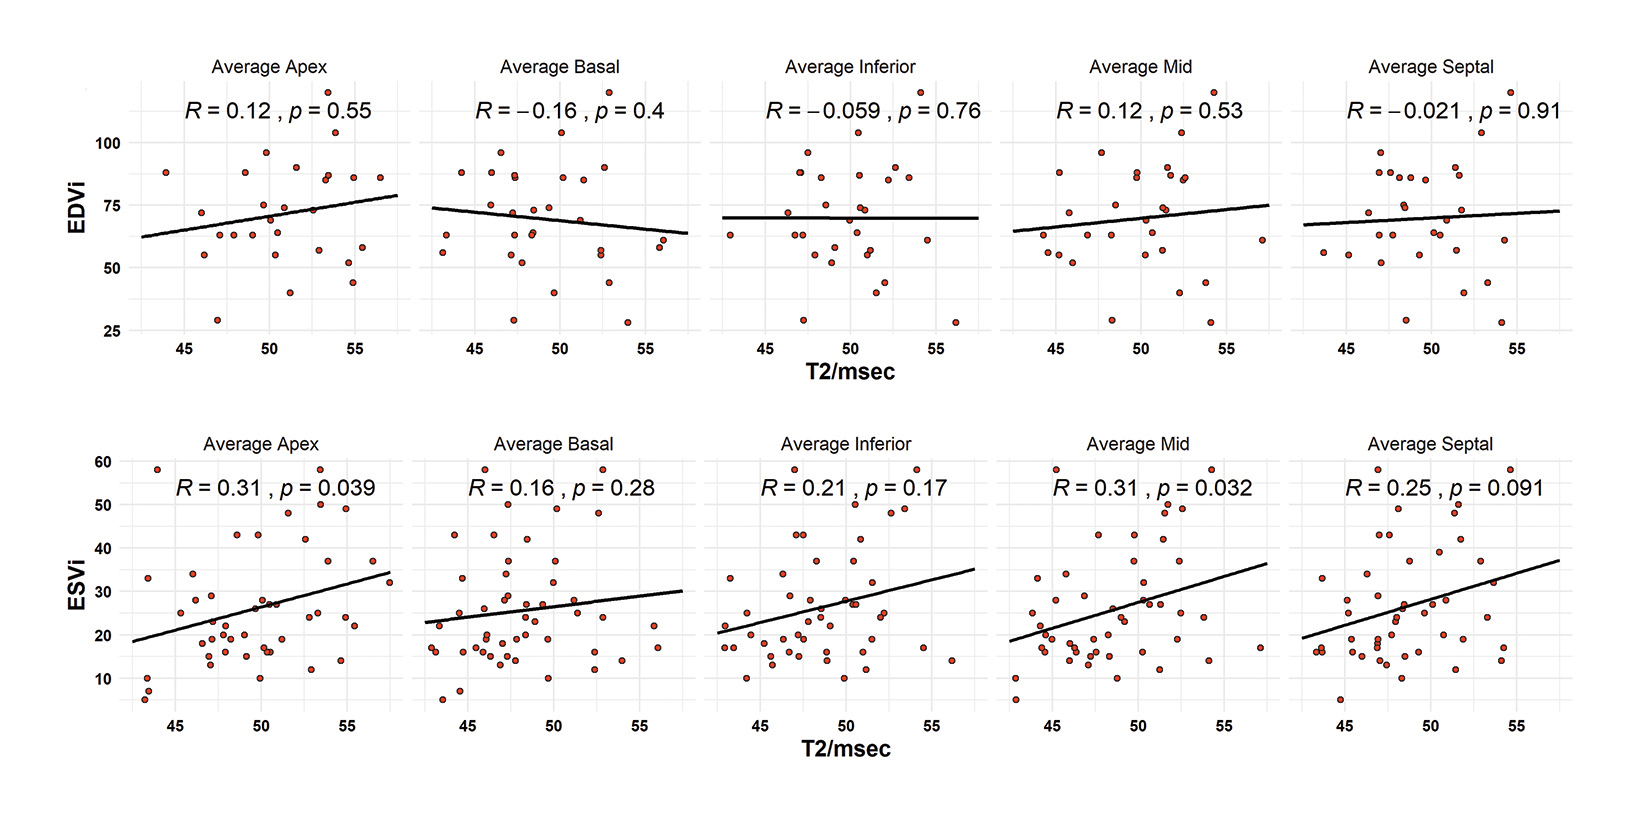
For segmental T2-functional measurement correlation, no regional T2 value was associated with increased EDVi. (Figure 4A). Correlations observed for EDVi ranged from -0.16 to +0.12. All segmental T2 measurements observed a positive correlation with ESVi; however, only the average mid-ventricular and average apical segments (R = 0.31 and 0.31; p = 0.032 and 0.039) were significant. Septal T2 values had a correlation coefficient of 0.25 but were not significantly correlated with ESVi. (Figure 4B).
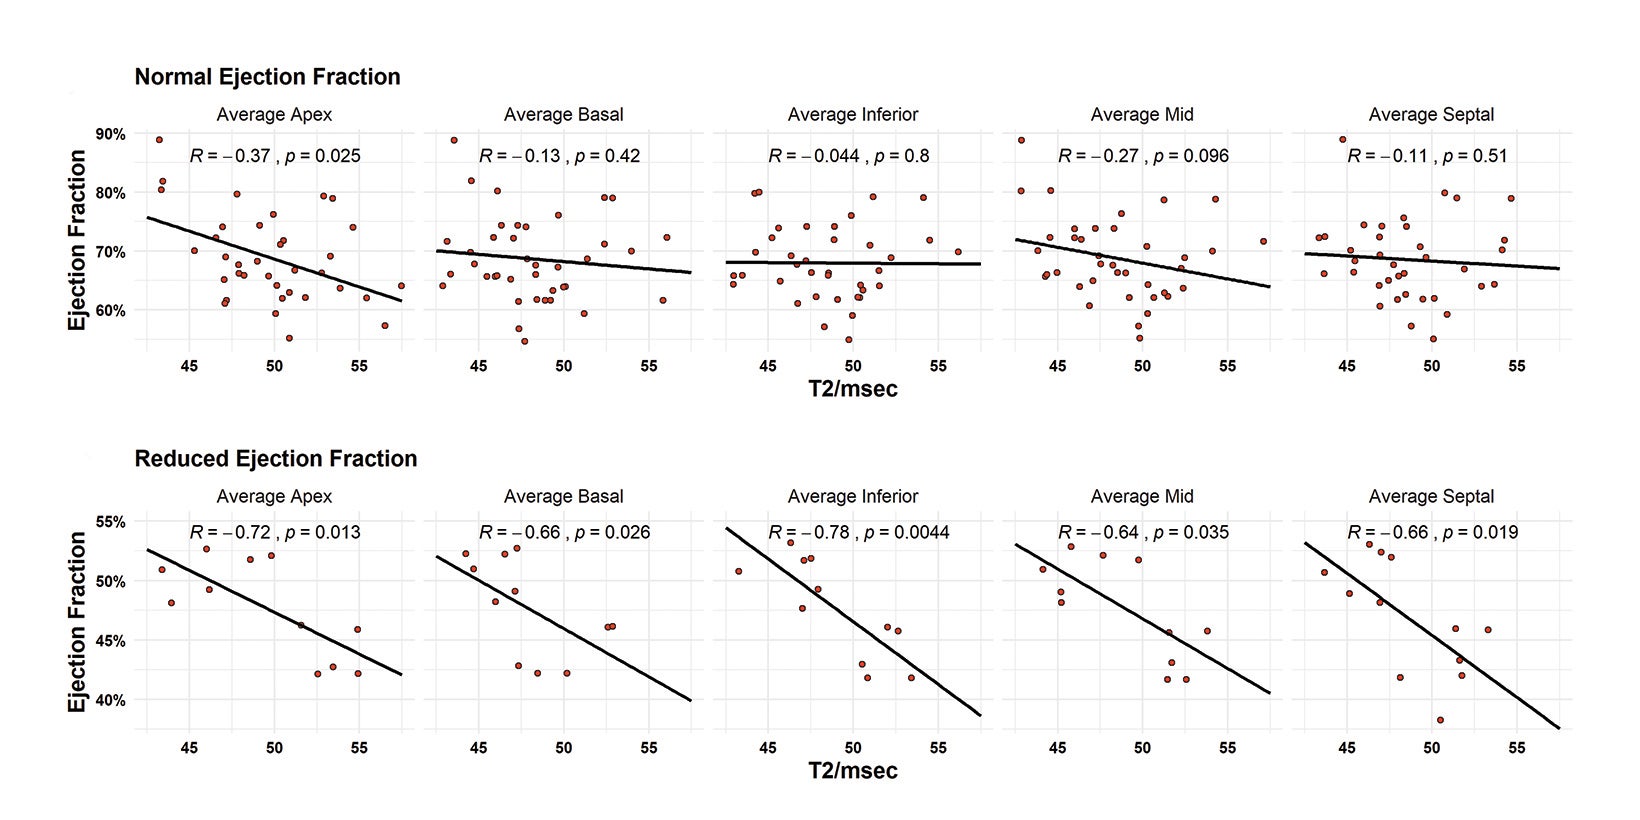
Patients were divided into sub-analyses by classification of ejection fraction. A normal ejection fraction was defined as > 55%, the MRI-estimated threshold for abnormality. Patients with a normal ejection fraction only demonstrated correlation with average apical T2 values with a moderately negative relationship (R = -0.37, p = 0.025). In patients with reduced ejection fractions (< 55%), all T2 measurements were highly associated with decreased ejection fraction. Correlations ranged from -0.64 to -0.78. The highest correlated measurements were the inferior (R = 0.78, p = 0.035) and the apical (R = -0.72, p = -0.013) segments. The lowest ejection fraction in this cohort was measured at 38%. (Figure 5).
Discussion
The purpose of this study was to contribute normative segmental T2 values and the association of these medians with important MRI-derived cardiac function measurements in a sequential cohort of sarcoidosis patients. Patients with cardiac sarcoidosis as defined by WASOG criteria had elevated global and segmental T2 mapping values, decreased systolic function, and decreased ejection fraction as compared to patients without cardiac sarcoidosis. Median T2 values for CS patients were roughly found to be > 50 msec.
Median values for patients without CS ranged from 46-47 msec. Elevated apical and mid-ventricular T2 values were associated with increased end-systolic volumes indexed to BMI and all T2 mapping values were highly negatively correlated with worsening ejection fraction in patients with heart failure with reduced ejection fraction. The T2 values of the inferior segments most highly correlated with worsening ejection fraction, but all measured segments were associated with varying degrees of dysfunction.
To date most studies regarding T2 mapping in CS have focused on either whole-heart or threshold T2 values and information regarding the regional variation of disease is lacking. Previous literature dating back to 2017 found that patients with CS had a median 3T whole-heart T2 value of 54 msec versus normal patients with 47 msec. Although 54 was higher than any of the median measurements in this study for patients with CS, it is within the interquartile range for both studies. The study cutoff for CS was found to be 47 msec, which is lower than the median reported in this study. This may be because the control patients in the previous study were normal subjects with ostensibly normal hearts, while the control patients in this study represent older patients with baseline systemic sarcoidosis or because of the MRI field strength. A recent meta-analysis further suggested a median value of 52.6 msec for CS, once again within range of results.14,19 Normative values may even vary due to segmentation methods (CS 50-54 T2m- sec) as demonstrated by Dabir, et al.12 Lastly, a study of PET/MRI with T2 mapping found CS values to average 46 ± 5 msec, which is lower than previously published findings and likely related to their local parameters as mentioned in their methodology.
Recently, a previous meta-analysis summarized that CMR has a higher sensitivity for CS than PET/CT, but there is a remaining role for FDG-PET in the diagnosis of active disease.2 T2 mapping as a measurement of myocardial edema has been postulated to fill this role and potentiate CMR as a complete study for diagnosis of chronic and active disease.3 There is a distinct need for normative values indexed to AHA segments, as CS is well noted to have a predilection for the basal-, mid-, and inferior-left ventricular segments, and basal septal involvement is thought to lead to conduction system abnormalities.1,20,21 The role of regional segmental T2 variation in systolic dysfunction is a new addition to the literature, with this study suggesting that the mid-inferior segments to be the most relevant. This correlates well with previous literate demonstrating LGE correlates with worsening LVEF.22 Given the criteria for consideration of implantable defibrillation devices begins at an uncorrectable ejection fraction of 35%, the active phase edema represented by T2 may be an early warning for clinicians to pursue preventative therapies.23
The most controversial question regarding CS diagnosis must be the specific diagnostic criteria. Three criteria that have been put forth are those of the Japanese Circulation Society (JCS), the Heart Rhythm Society (HRS), and the World Association of Sarcoidosis and Other Granulomatous Disease (WASOG). Each takes a different approach: the JCS criteria use a major and minor criterion system, and the WASOG and HRS differ slightly regarding inclusion of perfusion imaging and T2 signal.18,23,24 The authors of this study chose to utilize the WASOG criteria modified without the T2 signal to represent a diagnosis of CS. The authors chose the WASOG without T2 criteria in order to not create a circuitous diagnostic criterion and to reduce bias favoring CMR from JCS criteria (FDG- PET and LGE being major criteria), given that all patients in this study received CMR.
Additionally, given that endomyocardial biopsy is as low as 20% sensitivity for CS, the authors also note that “at least probable” per WASOG criteria is regarded as usually sufficient to diagnose CS.18,25 Finally, the prevalence of CS in this study was 58%, which is higher than previously documented cohorts. The authors note the prevalence of CS in patients with symptomatic sarcoidosis to be 39% in recent analyses and this study likely includes selection bias owing to the patient population already having a high suspicion of disease.26
Novel implications of this study include the redemonstration of normative T2 mapping values for CS in the low 50s with additional description of regional variation. Additionally, regional T2 values are found to highly correlate with decreased ejection fraction and increased end-systolic volumes in patients with CS, especially those with < 55% EF. Limitations of this study include the lack of tissue-based criteria in WASOG definition and this cohort, the prior noted selection bias in who received a CMR, and the poor evaluation of diastolic dysfunction on CMR with the methods used. Further study should include multiple comparisons of different criteria in an expanded dataset and consider further evaluation of diastolic function.
Conclusions
Normative median segmental left ventricular T2 values in cardiac sarcoidosis range approximately from 49 to 51 msec. T2 values in the mid-apical region correlate with increased end-systolic volumes indexed to BMI. All segmental T2 values strongly correlate with decreasing ejection fraction in patients with ejection fraction of less than 55%.
References
- Ribeiro Neto ML, Jellis CL, Joyce E, Callahan TD, Hachamovitch R, Culver DA. Update in cardiac sarcoidosis. Ann Am Thorac Soc. Nov 2019;16(11):1341-1350. doi:10.1513/AnnalsATS.201902-119CME
- Aitken M, Chan MV, Urzua Fresno C, et al. Diagnostic accuracy of cardiac MRI versus FDG PET for cardiac sarcoidosis: a systematic review and meta-analysis. Radiology. May 17 2022:213170. doi:10.1148/radiol.213170
- Cheung E, Ahmad S, Aitken M, et al. Combined simultaneous FDG-PET/MRI with T1 and T2 mapping as an imaging biomarker for the diagnosis and prognosis of suspected cardiac sarcoidosis. Eur J Hybrid Imaging. Dec 16 2021;5(1):24. doi:10.1186/s41824-021-00119-w
- Skali H, Schulman AR, Dorbala S. 18F-FDG PET/CT for the assessment of myocardial sarcoidosis. Curr Cardiol Rep. Apr 2013;15(4):352.
- Yoshida A, Ishibashi-Ueda H, Yamada N, et al. Direct comparison of the diagnostic capability of cardiac magnetic resonance and endomyocardial biopsy in patients with heart failure. Eur J Heart Fail. Feb 2013;15(2):166-75. doi:10.1093/eurjhf/hfs206
- Davenport MS, Perazella MA, Yee J, et al. Use of intravenous iodinated contrast media in patients with kidney disease: consensus statements from the amerian college of radiology and the national kidney foundation. Radiology. Mar 2020;294(3):660-668. doi:10.1148/radiol.2019192094
- Bakker AL, Grutters JC, Keijsers RG, Post MC. Cardiac sarcoidosis: challenges in clinical practice. Curr Opin Pulm Med. Sep 2017;23(5):468-475. doi:10.1097/ MCP.0000000000000410
- Smedema JP, Ainslie G, Crijns H. Review: Contrast-enhanced magnetic resonance in the diagnosis and management of cardiac sarcoidosis. Prog Cardiovasc Dis. May - Jun 2020;63(3):271-307. doi:10.1016/j.pcad.2020.03.011
- Serei VD, Fyfe B. The many faces of cardiac sarcoidosis. Am J Clin Pathol. Feb 8 2020;153(3):294-302. doi:10.1093/ajcp/aqz169
- Tana C, Mantini C, Donatiello I, et al. Clinical features and diagnosis of cardiac sarcoidosis. J Clin Med. May 1 2021;10(9)doi:10.3390/jcm10091941
- Puntmann VO, Isted A, Hinojar R, Foote L, Carr-White G, Nagel E. T1 and T2 mapping in recognition of early cardiac involvement in systemic sarcoidosis. Radiology. Oct 2017;285(1):63-72. doi:10.1148/radiol.2017162732
- Dabir D, Luetkens J, Kuetting D, Nadal J, Schild HH, Thomas D. Myocardial mapping in systemic sarcoidosis: a comparison of two measurement approaches. Rofo. Jan 2021;193(1):68-76. Myokardiales mapping bei systemischer sarkoidose: ein vergleich zweier messansatze. doi:10.1055/a-1174-0537
- Crouser ED, Ono C, Tran T, He X, Raman SV. Improved detection of cardiac sarcoidosis using magnetic resonance with myocardial T2 mapping. Am J Respir Crit Care Med. Jan 1 2014;189(1):109-12. doi:10.1164/rccm.201309-1668LE
- Snel GJH, van den Boomen M, Hernandez LM, et al. Cardiovascular magnetic resonance native T2 and T2(*) quantitative values for cardiomyopathies and heart transplantations: a systematic review and meta-analysis. J Cardiovasc Magn Reson. May 11 2020;22(1):34. doi:10.1186/s12968-020-00627-x
- Crouser ED, Ruden E, Julian MW, Raman SV. Resolution of abnormal cardiac MRI T2 signal following immune suppression for cardiac sarcoidosis. J Investig Med. Aug 2016;64(6):1148-50. doi:10.1136/jim-2016-000144
- Schulz-Menger J, Wassmuth R, Abdel-Aty H, et al. Patterns of myocardial inflammation and scarring in sarcoidosis as assessed by cardiovascular magnetic resonance. Heart. Mar 2006;92(3):399-400. doi:10.1136/hrt.2004.058016
- Cerqueira MD, Weissman NJ, Dilsizian V, et al. Standardized myocardial segmentation and nomenclature for tomographic imaging of the heart. A statement for healthcare professionals from the Cardiac Imaging Committee of the Council on Clinical Cardiology of the American Heart Association. Circulation. Jan 29 2002;105(4):539-42. doi:10.1161/hc0402.102975
- Judson MA, Costabel U, Drent M, et al. The WASOG sarcoidosis organ assessment instrument: an update of a previous clinical tool. Sarcoidosis Vasc Diffuse Lung Dis. Apr 18 2014;31(1):19-27.
- reulich S, Gatidis S, Grani C, et al. Hybrid cardiac magnetic resonance/fluorodeoxyglucose positron emission tomography to differentiate active from chronic cardiac sarcoidosis. JACC Cardiovasc Imaging. Mar 2022;15(3):445-456. doi:10.1016/j.jcmg.2021.08.018
- Patel MR, Cawley PJ, Heitner JF, et al. Detection of myocardial damage in patients with sarcoidosis. Circulation. Nov 17 2009;120(20):1969-77. doi:10.1161/CIRCULATIONAHA.109.851352
- Kouranos V, Tzelepis GE, Rapti A, et al. Complementary role of cmr to conventional screening in the diagnosis and prognosis of cardiac sarcoidosis. JACC Cardiovasc Imaging. Dec 2017;10(12):1437-1447. doi:10.1016/j.jcmg.2016.11.019
- Watanabe E, Kimura F, Nakajima T, et al. Late gadolinium enhancement in cardiac sarcoidosis: characteristic magnetic resonance findings and relationship with left ventricular function. J Thorac Imaging. Jan 2013;28(1):60-6. doi:10.1097/RTI.0b013e3182761830
- Birnie DH, Sauer WH, Bogun F, et al. HRS expert consensus statement on the diagnosis and management of arrhythmias associated with cardiac sarcoidosis. Heart Rhythm. Jul 2014;11(7):1305-23. doi:10.1016/j.hrthm.2014.03.043
- Terasaki F, Azuma A, Anzai T, et al. JCS 2016 guideline on diagnosis and treatment of cardiac sarcoidosis-digest version. Circ J. Oct 25 2019;83(11):2329-2388. doi:10.1253/circj.CJ-19-0508
- Vignaux O. Cardiac sarcoidosis: spectrum of MRI features. AJR Am J Roentgenol. Jan 2005;184(1):249-54. doi:10.2214/ajr.184.1.01840249
- Martusewicz-Boros MM, Boros PW, Wiatr E, Zych J, Piotrowska-Kownacka D, Roszkowski-Sliz K. Prevalence of cardiac sarcoidosis in white population: a case-control study: Proposal for a novel risk index based on commonly available tests. Medicine (Baltimore). Aug 2016;95(32):e4518. doi:10.1097/MD.0000000000004518
Citation
J C, IM K, MR K, G A, J W, N S, DJ D, A W, A V, W R, WE J, BA H, D B, AD H, JR B. Normative Left Ventricular Segmental T2 Mapping Values and Relationship With Cardiac Function in Cardiac Sarcoidosis Patients. Supplement to Applied Radiology. 2023;(1):4-12.
February 1, 2023