Pleural Fluid Volume Estimates and the Actual Volume: A Cross-Sectional Analysis
Objective and Hypothesis:
This study aims to compare the accuracy of 5 ultrasonographic formulae commonly used to estimate pleural effusion volume against actual volumes drained via thoracentesis in noncritically ill patients. We hypothesized that some formulae would yield more accurate estimations.
Materials and Methods:
A cross-sectional analytic study was conducted at St. Luke’s Medical Center, Quezon City, the Philippines, from January 2022 to December 2022. Adult patients with pleural effusion who underwent chest US within 72 hours prior to thoracentesis were included. Five US formulae—Goecke and Schwerk (GS1 and GS2), Eibenberger, Balik, and conventional ellipsoid volume—were applied to estimate pleural fluid volume. The volume estimates were compared with the actual volume of fluid drained during thoracentesis. Intraclass correlation coefficients (ICCs) were used to measure agreement between the estimated and actual volumes.
Results:
The study included 61 patients with a mean age of 67.19 years. The mean volume aspirated was 644.51 mL. The Balik formula exhibited the highest ICC (0.793), indicating the strongest agreement with actual volumes. The conventional ellipsoid volume formula and GS2 also showed good agreement, with ICCs of 0.773 and 0.756, respectively. GS1 and Eibenberger formulae demonstrated moderate accuracy with ICCs of 0.556 and 0.612, respectively.
Conclusion:
The Balik, conventional ellipsoid volume, and GS2 formulae provided more accurate pleural fluid volume estimations. Accurate volume estimation is crucial for clinical decision-making, and these findings emphasize the importance of selecting appropriate formulae for ultrasonographic evaluation. Further research is needed to validate these results and explore factors affecting estimation accuracy.
Introduction
Pleural effusion is defined as an excessive accumulation of fluid in the pleural space resulting from excess fluid production, decreased absorption, or both.1 About 1-10 mL of fluid is normally present in the pleural space.1 - 5 The daily production of pleural fluid is about 10 mL, which is absorbed continuously.2 The balance between the hydrostatic and oncotic forces in the pleural vessels of the visceral and parietal pleura and the surrounding lymphatic drainage maintains the normal volume of fluid in the pleural space.1, 3 Pleural effusion results when this equilibrium is disrupted, and it is most associated with heart failure, pneumonia, cancer, pulmonary embolism, viral disease, coronary artery bypass surgery, and cirrhosis with ascites.5, 6
The use of US in examining the pleural space has become a standard practice worldwide.7 Compared with radiography and CT, US has the advantage of being noninvasive, cost-effective, readily available, and repeatable. It is also safer because no ionizing radiation is used. Furthermore, chest US demonstrates better sensitivity and reliability than the other 2 modalities.8 - 10 While at least 150 mL is required to detect effusion by radiography in the standing position, effusions as small as 5 mL can be detected sonographically.2, 11 In addition, chest CT has difficulty distinguishing small effusions from pleural thickening, dependent atelectasis, or tumor, which lowers its sensitivity in quantifying pleural effusion.6
Pleural effusion is typically managed by drainage; thoracentesis is one frequently used method. Owing to discrepancies between the actual volume of pleural effusion with the clinical picture of the patient, clinicians often have difficulty determining whether to drain the pleural fluid.8
To this end, various formulae have been devised to estimate the volume of pleural effusion with US.9, 12 - 16 Goecke and Schwerk proposed the first equation in 1990; 2 popular variants of their formula are used worldwide.12 The first, GS1, uses the lateral height of the effusion wherein one caliper is placed at the costophrenic angle, and a second caliper is placed at the lung base. The formula is as follows:

The second formula, GS2, utilizes the subpulmonary height and the lateral height of the pleural effusion. The subpulmonary height is obtained by placing one caliper at the lung base and the other caliper at the mid-diaphragm. The formula is as follows:

A third equation was proposed by Eibenberger and colleagues in 1994.9 This formula was found to estimate pleural fluid volume more accurately in patients with larger fluid volumes. Volume is obtained by measuring the perpendicular distance between the visceral and parietal pleura, where the calipers are placed at the lung margin and posterior chest wall. The formula is

In 2006, a fourth equation was proposed by Balik and colleagues.13, 14 Like the Eibenberger formula, this equation utilizes the distance between the visceral and parietal pleura to estimate fluid volume. However, the Balik formula is better suited for estimating thinner pleural volumes. The Balik formula is

Our institution most often uses a fifth equation known as the conventional ellipsoid volume formula. In addition to the pleural cavity, this formula can be used to measure the volume of various organs such as the spleen or prostate.15, 16 The formula is:

All 5 of these formulae, summarized in the accompanying chart, are simple, accurate, and easy to perform quickly. In previous studies using these formulae, the acceptable margin of error was set at 5% to define their accuracy.7, 8 However, there remains no consensus among radiologists on which of these should serve as the standard formula. This study aims to determine which of these quantitative US formulae best estimates pleural effusion volume.
| Methods | Equation |
|---|---|
| Goecke and Schwerk (GS1) | H × 90 |
| Goecke and Schwerk (GS2) | (H+D) × 70 |
| Balik et al | C × 20 |
| Eibenberger et al | (C × 47.6) – 837 |
| Conventional ellipsoid volume formula | L × W × H × 0.52 |
Materials and Methods
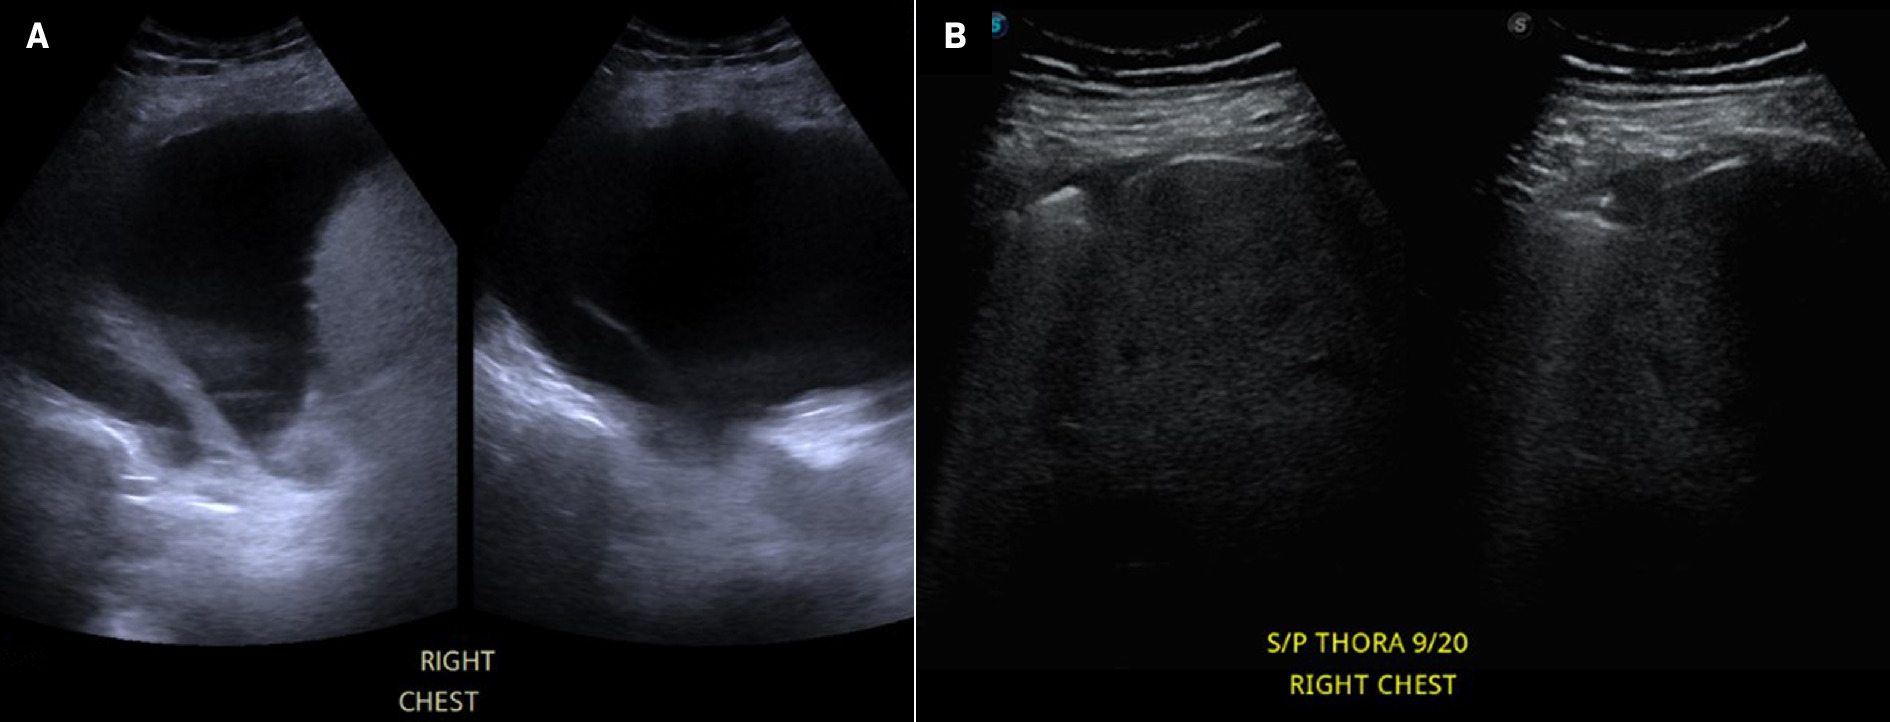
This is a cross-sectional analytic study. The target population includes adult patients with pleural effusion who were not mechanically ventilated, had undergone chest US prior to thoracentesis and were admitted to St. Luke’s Medical Center, Quezon City, the Philippines, from January 1, 2022, to December 31, 2022. Patients were included in the study if they were able to comply with standard positioning for chest US and underwent the procedure without mechanical ventilation less than 72 hours prior to thoracentesis. Total to near-total drainage of pleural fluid also must have been achieved during thoracentesis ( Figure 1 ) as indicated by data on the operative technique.7, 8
Pre-thoracentesis (A) and post-thoracentesis (B) US images of the same patient taken 2 days apart showing near-total drainage of pleural fluid during thoracentesis.
Patients excluded from the study were those with a diagnosis of loculated pleural effusions or empyema on imaging; low-volume pleural effusion (<500 mL); thoracic deformities, diaphragmatic pathology, or previous chest surgeries. Those who had undergone other surgical drainage interventions, for example, chest pigtail insertion, and those with missing data or images were also excluded from the study. All images of the participants were given a code by the investigator.
Image Evaluation
Low-frequency chest US was performed by radiologic technologists using a low-frequency probe with Siemens, Hitachi, and Sonoscape portable US machines. Patients were asked to maintain standard chest US positioning; that is, an angled supine position with their arms folded across the chest to displace the scapulae.17 The posterior chest was scanned through the intercostal spaces and the following measurements were obtained: the subpulmonary height in centimeters of the effusion from the lung base to the mid-diaphragm; the maximum perpendicular distance in millimeters between the pulmonary surface and chest wall; and the maximum length, width, and height in centimeters of the pleural effusion.
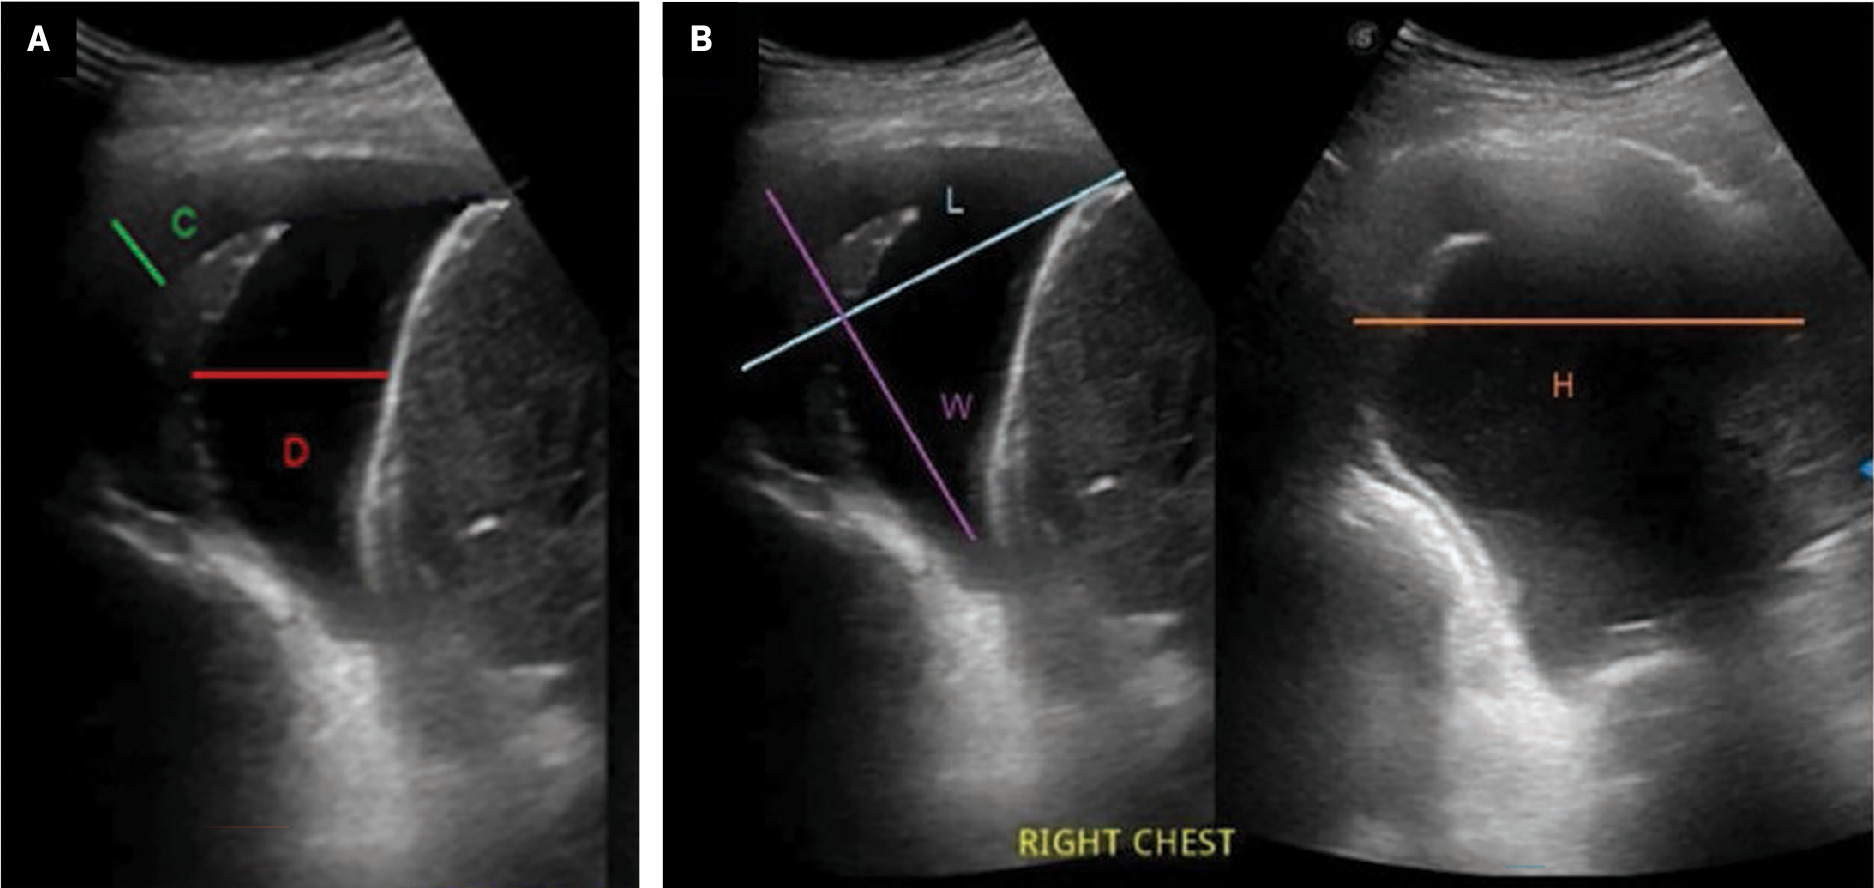
The results were plotted in the equations for estimating pleural effusion, where D is the subpulmonary height of the effusion in centimeters from the lung base to the mid-diaphragm, C is the maximum perpendicular distance in millimeters between the parietal and visceral pleura, and L, W, and H are the maximum length, width, and height of the pleural effusion in centimeters ( Figure 2 ).
Measurements obtained in a chest US of a patient with pleural effusion (A, B), showing distance between parietal and visceral pleura (C), subpulmonary height (D), maximum length (L), maximum width (W), and maximum height (H).
Data Analysis
Demographic data, measurements of pleural fluid volume, laterality of pleural fluid volume, and the total volume of fluid drained from official operative technique were gathered from Carestream picture archiving and communication system, MD Portal, and patient chart review.
Summary statistics are presented ( Tables 1–3 ), with reported means and SDs for quantitative data and frequency distributions for categorical information. This study uses the intraclass correlation coefficient (ICC) to measure the degree of agreement between the volume estimation of each equation with the actual aspirated volume. The ICC is used to assess the reliability of a given instrument to measure the parameter for which it is intended. The results are compared with the actual volume aspirated using ICC. The level of agreement is defined as follows:
-
Poor agreement: ICC < 0.5.
-
Moderate agreement: ICC 0.5‐0.75.
-
Good agreement: ICC 0.75‐0.9.
-
Excellent agreement: ICC > 0.9.
Mean Age, Sex, and Volume Aspirated in mL
| Age | 67.19 (±17) |
| Sex, n , % | |
| Male | 32 (52.5) |
| Female | 29 (47.5) |
| Volume aspirated | 644.51 (±261.58) |
| Right | 659.85 (±276.81) |
| Left | 626.43 (±246.20) |
Intraclass Correlation Coefficient for the 5 Equations Against Measured Volume
| Intraclass Correlation Coefficient | 95% confidence interval | ||
|---|---|---|---|
| Upper Limit | Lower Limit | ||
| Goecke and Schwerk (GS1) | 0.556 | 0.260 | 0.734 |
| Goecke and Schwerk (GS2) | 0.756 | 0.594 | 0.854 |
| Balik | 0.793 | 0.655 | 0.876 |
| Eibenberger | 0.612 | 0.353 | 0.767 |
| Conventional ellipsoid volume formula | 0.773 | 0.622 | 0.864 |
Laterality-Specific Intraclass Correlation Coefficient for the 5 Equations Against Measured Volume
| Equation | Right | Left | ||||
|---|---|---|---|---|---|---|
| 95% CI | ||||||
| Intraclass Correlation Coefficient | Upper Limit | Lower Limit | Intraclass Correlation Coefficient | Upper Limit | Lower Limit | |
| Goecke and Schwerk (GS1) | 0.630 | 0.251 | 0.817 | 0.466 | -0.153 | 0.753 |
| Goecke and Schwerk (GS2) | 0.757 | 0.509 | 0.880 | 0.771 | 0.505 | 0.894 |
| Balik | 0.665 | 0.322 | 0.835 | 0.895 | 0.773 | 0.951 |
| Eibenberger | 0.561 | 0.112 | 0.783 | 0.647 | 0.239 | 0.837 |
| Conventional ellipsoid volume formula | 0.778 | 0.551 | 0.891 | 0.761 | 0.483 | 0.889 |
Processing and analysis were performed using Windows SPSS version 19.
Results
The study included 61 patients with a mean age of 67.19 (±17), with nearly equal male-female distribution (52.5% male, 47.5% female). The mean volume aspirated was 644.51 mL (min 500 mL, max 1400 mL). There was likewise an almost equal laterality-specific distribution (54% right, 46% left). The mean volume aspirate on the right was 659.85 mL (min 500 mL, max 1300 mL), and 626.43 mL on the left (min 500 mL, max 1400 mL).
Good agreement was noted for the GS2, Balik, and conventional ellipsoid volume formulae, with the Balik formula exhibiting the highest ICC among the 3 equations. Moderate ICC was noted for the GS1 and Eibenberger formulae.
The GS2 and conventional ellipsoid formulae consistently showed good ICC values regardless of laterality. The Balik formula showed moderate ICC in estimating right-sided pleural fluid volume but excellent estimation on the left side. The Eibenberger formula showed moderate ICC in estimating left- and right-sided pleural effusion. The GS1 formula demonstrated moderate estimation capability on right-sided pleural fluid but poor ICC values on the left-sided pleural fluid volume.
Discussion
The successful management of pleural effusion hinges on its prompt identification, accurate estimation of fluid volume, and determination of its cause.8 Clinically diagnosing pleural effusion is challenging, especially in minor cases and in the presence of concurrent lung consolidation, thus requiring radiologic confirmation.
The assessment of these 5 formulae was centered around their simplicity and speed of application, making them particularly advantageous for routine clinical utilization.8 Other US formulae documented in the literature often prove to be complex, time consuming, and unsuitable for everyday clinical practice.
Our study revealed varying degrees of correlation between the estimated and actual volumes across the different formulae. Balik, GS2, and the conventional ellipsoid volume formulae demonstrated the highest ICC values, indicating a stronger agreement between the estimated and actual volumes compared with the other formulae. A previous study concluded that the GS2 and Balik formulae yielded good pleural effusion volume estimates, showing a correlation coefficient ( r ) of 0.81 and 0.63, respectively.8 Previous studies concluded that the GS2 formula yields a strong correlation with actual volume by taking advantage of the fact that nonloculated pleural fluid descends to the lower pleural space with the patient in the standing position.8, 18
While previous studies have reported suboptimal correlation coefficients of the Balik formula, its application in our study yielded a good ICC performance, likely due to its focus on estimating mid- to large-volume pleural effusions, which is similar to the methods and volume ranges assessed in our study.13 In contrast, other studies applied the formula to a more varied volume range, potentially contributing to its poorer performance in those contexts.7, 8
The GS1 and Eibenberger formulae exhibited relatively lower ICC values, suggesting poorer accuracy in estimating pleural fluid volume. Previous evidence demonstrated that the primary drawback of the GS1 formula is its tendency to overestimate the volume of minor effusions.18 Meanwhile, the Eibenberger formula demonstrates a propensity to underestimate pleural fluid volume in individuals with larger thoracic/pleural cavities and overestimate it in those with smaller cavities.9
In studying laterality-specific US estimation of pleural effusion volume across the various equations, we found that the GS2 and conventional ellipsoid formulae displayed consistently good correlation coefficients. This is despite findings by Hassan et al that GS2 tends to overestimate effusion on the left side since the left hemithorax is smaller than the right.7 Meanwhile, the Balik formula demonstrated an even better ICC value on the left side and maintained a good ICC value on the right, which can be attributed to its similarity to the GS2 method. These findings highlight the importance of selecting an appropriate formula to accurately estimate pleural fluid volume and guide clinical decision-making.
Conclusion
This study compared the accuracy of 5 formulae in estimating pleural fluid volume compared with the actual volume drained via thoracentesis. The findings suggest that the Balik, conventional ellipsoid volume, and the GS2 formulae offer more accurate pleural fluid volume estimations compared with the GS1 and Eibenberger formulae.
By emphasizing the importance of selecting an appropriate formula to guide clinical decision-making in patients with pleural effusion, these findings have important implications for clinical practice. Further research is warranted to validate these findings and explore additional factors influencing the accuracy of pleural fluid volume estimation.
References
Citation
Chan LLA, Causing JGAV, Manlapaz KTG. Pleural Fluid Volume Estimates and the Actual Volume: A Cross-Sectional Analysis. Appl Radiol. 2025; (Suppl_1):18 - 23.
doi:10.37549/AR-D-24-0063
February 1, 2025