Advanced visualization: Making the right choice
Images
When this article was written, Dr. Siddiqui was Chief of Imaging Informatics and Cardiac CT/MRI at the Veterans Affairs Maryland Health Care System, and Co-Director of the Imaging Informatics and MRI Fellowships at the University of Maryland School of Medicine, Baltimore, MD. He is now Principal Program Manager, Health Solutions Group, Microsoft Corp., Redmond, WA. He currently chairs the IT and Informatics Committee for the American College of Radiology and also chairs the Advanced PACS-based Imaging Informatics and Therapeutic Applications Conference of SPIE Medical Imaging 2009.
In the early 1970s, computed tomography (CT) studies generated just a few images that radiologists could spend time examining in detail. Today, a typical trauma CT study at the University of Maryland Shock Trauma Center consists of 2000 slices. A typical cardiac CT study may generate ≥6000 images. The difficulty of evaluating so many images has spurred the movement toward volumetric or 3-dimensional (3D) interpretation of imaging data. More and more radiologists are taking advantage of a multitude of tools that enable advanced visualization, advanced functional analysis, and quantification of pathology.
Vendors have developed a variety of workstations to support 3D imaging. The traditional workstation is a “thick client” to which images are delivered for image rendering and display. There is, however, a growing trend toward use of a “thin-” or “smart-client” configuration, in which image rendering takes place on the server or “back end” at the data center. Images are streamed to the workstation for display. Another option is to display all images on the picture archiving and communications system (PACS).
Image visualization
There are two basic forms of image visualization solutions: 1) client-side rendering, and 2) server-side rendering.
Client-side rendering
How image rendering takes place can have an important impact on workflow. Client-side rendering creates a big disadvantage of limiting one user at a time to use a costly workstation. There are multiple workflows for client-side rendering depending on who actually interacts with the workstation. In one version of client-side rendering, a technologist does all the processing. The scan is performed on the CT scanner, and data are sent to the advanced workstation and to the PACS. Processed images are then created by the technologist and pushed to the PACS again, where the radiologist interprets them. In this workflow, the radiologist is at the mercy of the technologist, who decides the format and orientation of images the radiologist will see.
Another form of client-side rendering involves the radiologist directly performing image processing. In this case, images acquired on the CT scanner are sent to the PACS. Either the radiologist reads the images on a 3D workstation situated adjacent to the PACS, or the images are pulled from the PACS to a separate 3D workstation for processing. Client-side rendering forces clinicians and radiologists to physically go and find the workstation, which could be anywhere in the hospital and is sometimes difficult to find. This creates a hindrance to the use of advanced image processing.
When the PACS and 3D workstation are not tightly integrated, workflow can suffer. Typically the radiologist views 2-dimensional (2D) images on the PACS. However, in order to do multiplanar processing or 3D visualization, measure stenoses, or use other advanced tools, the radiologist must go to the 3D workstation, which may or may not be located nearby.
A semi-integrated PACS and 3D workstation is more convenient because it makes possible simultaneous examination of the data sets on both the PACS and advanced workstation without having to physically move from one place to another. However, the workstation must be very robust for client-side rendering. In addition, unless there is integration of contextual data between the systems, it will be necessary to duplicate the input of patient and study information from the PACS into the 3D application.
There are certain advantages to using client-side rendering. First, most 3D workstations available today are designed for this use. Technologists and 3D lab personnel can preprocess image data before the radiologist looks at them. Once the data have loaded, all functionality is performed locally on the 3D workstation. And many 3D workstations are sold at a discount when purchased at the same time as a scanner.
There are also disadvantages to client-side rendering on a traditional 3D workstation. First, it is necessary to buy multiple workstations for multipurpose or multidepartmental use. Still, workstation locations are often limited and may be inconvenient. Typically, an institution buys just one or two 3D workstations, and all users must share them.
To handle all of the image data, a powerful computer with multi-gigabytes of random access memory and, usually, multiple processors is needed. The distributed architecture can create problems, as not everyone may be reading from the same dataset. For example, if data are sent to a 3D workstation for rendering, and the patient is later re-imaged or an abnormality is identified and annotated at the PACS workstation that information may not be available to the radiologist working at the 3D workstation. Lastly, a robust network is required, given the amount of data that must be transferred to the 3D workstation for processing.
Server-side rendering
The biggest advantage of server-side rendering is that data are available wherever they are needed, anytime they are needed. In addition, everyone who is accessing the data is interacting with the same data from the same server. Information can be saved on that server—a defining pathology or measurements of ejection fraction or perfusion, for example—and all users have access to it.
Server-side rendering is less network-dependent because only a small amount of data is transmitted at a time, and the streaming technologies that most vendors use do not require a robust network. In addition, workstations do not need robust computing power, as most of the processing work is done at the server. The biggest advantage for server-side rendering solutions is that advance image processing applications are available to the entire healthcare enterprise and can significantly enhance patient care by making advance image data available to every physician. Image processing can even be done from home while securely connected to the server at the host institution.
One disadvantage of server-side processing is the limited number of applications currently available. This is rapidly changing, however, and at the time of the publication of this article, all applications available on stand-alone workstations may be available on server-side rendering clients. Many vendors are putting advanced cardiac analysis applications and virtual colonoscopy applications on server-side rendering clients, for example. Another disadvantage is that there may be a reduction in performance when more than the optimal number of users are accessing the same data and on the server configured for a lower number of concurrent users. In a high-volume practice, such delays may reduce radiologist productivity.
Survey: Integration
To better understand the need for tighter integration between 2D and 3D interpretation, we deployed a survey on the Internet in 2006 jointly with the Departments of Radiology at VA Maryland Healthcare System, Baltimore, MD, and Stanford University School of Medicine, Stanford, CA. 1 We wanted to know whether radiologists and cardiologists perceived a need for a seamlessly integrated 2D/3D application or a 3D advanced visualization application from a single PACS vendor.
We received 503 responses to the survey, approximately two thirds from radiologists and one third from cardiologists. We were surprised to find that 96.2% of radiologists and 92.3% of cardiologists reported reviewing CT or magnetic resonance (MR) images using 3D and multiplanar reformatting. We also asked who usually creates multiplanar, 3D, or volume-rendered images for interpretation. Both radiologists and cardiologists reported doing image processing themselves during the interpretation in the majority of cases, rather than relying on technologists (79.2% and 69.2%, respectively). We found no significant difference between academic radiologists and private-practice radiologists in the likelihood of processing images during interpretation (78.1% and 81.0%, respectively).
These responses suggest that both radiologists and clinicians want integrated 2D/3D workflow that makes use of the same application. In addition, they want to be able to interact with those images rather than use precanned screen captures from a workstation.
In 2006, we conducted a study that asked the question: If a PACS with a seamlessly integrated 2D/3D capability were available, what would the ideal display layout look like? In designing the study, we made the assumption that radiologists would use 2 monochrome high-resolution displays and 1 color display. In hindsight, we should have assumed the use of 3 color monitors. As a result, there is some discrepancy between our study data and what we would expect to find today. 2
The study involved 8 radiologists from 3 different medical institutions using 6 different PACS systems and 4 different 3D systems. The selection of a breadth of users with multiple systems provided us with better information on workflow.
As expected, in a survey of 8 radiologists and 18 protocols, there was a large amount of variance in the initial “blank slate” evaluation, primarily in the layout and positioning of particular image series. However, there were similarities in windowing/leveling, orientation, and 3D presentation states.
When the initial results were compiled and the participants were presented with a consensus layout, there was a high level of agreement. We were surprised to find that all 8 radiologists wanted the images to be laid out in a 4-on-1 display on both monochrome monitors, with volume-rendered image on the color monitor.
Second, all radiologists wanted images presented in axial, coronal, and sagittal planes for every case. Third, all users requested multiple preset windows and levels. However, not all window/level settings were requested for every orientation; instead study participants wanted them to be tailored to the task at hand. For example, they requested bone window/level settings on sagittal images of a CT of the chest, as this is the best orientation for evaluating compression fractures of the spine. When evaluating for lung nodules, they requested lung and soft tissue windows.
Finally, they requested that 3D series also be tailored for specific tasks-for example, axial maximum intensity projections (MIPs) to evaluate for lung nodules and coronal MIPs for vascular interpretation.
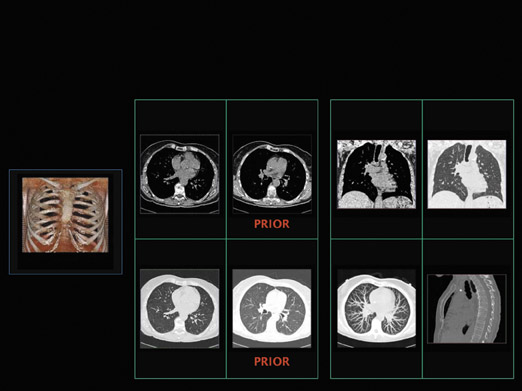
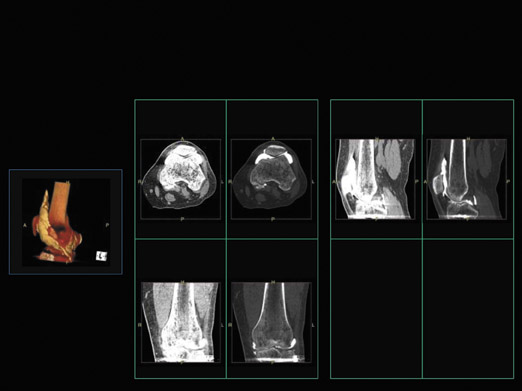
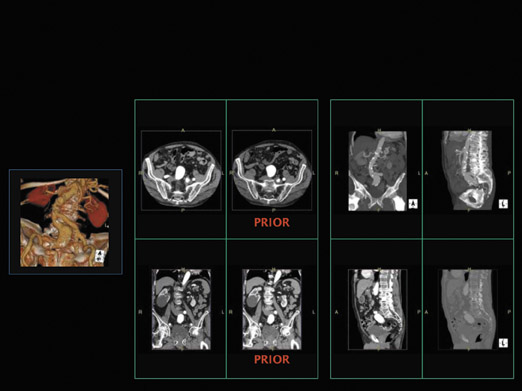
We then brought all 8 radiologists together and asked them to agree on a consistent layout. Some of protocols they decided on are shown in Figures 1 through 3. Figure 1 illustrates the presentation of a chest CT with prior studies. The radiologists said they would want to see current and prior images simultaneously on the same monitor. They would also want to see a multiplanar interpretation along with a MIP on the other monitor, and a volume-rendered image on the color monitor. Figure 2 shows an extremity CT without any prior studies, while Figure 3 shows an abdominal CT with prior studies.
Study participants also indicated that all 3 monitors should have color displays, so that advanced visualizations could be put on any portal available, not just a single monitor. These studies clearly identify a need for a 2D/3D integrated solution and radiologists’ preferred layouts and types of displays. The next step was to determine whether radiologists actually worked in this way. To answer that question, we looked at the interpretation process in real time at our institution.
In the past, workflow studies involved human observers with stopwatches. That approach not only takes a great deal of time and personnel, it interferes with daily workflow and is full of errors and bias. In fact, this approach creates a “fish bowl” phenomenon in which radiologists actually change the way they interpret studies in response to being observed.
To avoid this problem, we created a new method that uses automated data extraction and data mining from the PACS and the 3D application to assess the interpretation process in real time. It documents the actual interpretation process and assesses the variability of interpretation throughout the day, without the need for personnel observing a radiologist. In addition, radiologists are not aware of being observed by anyone, even though they know they are being tracked by the application.
We identified lists of desired auditing functions, including use of workstation tools, navigation strategies, time-stamped functions, and percentage of time spent looking at advanced visualizations versus multiple imaging planes. We used the audit logs from the PACS and 3D systems that were originally developed for "debugging" purposes. In their raw form they are essentially unreadable, but we converted them to a much more useful format from which we can extract information to understand how the radiologists interact with images based on slice information, navigation time, etc.
The initial phase of the study was conducted in 2003, 1 year after implementation of server-side rendering and thin-client enterprise advanced visualization application. We found that 36% of all CTs done in the department were being examined in a nonaxial mode by radiologists, as were 1% of studies reviewed by nonradiologists.
We repeated the study in 2005 and found that 90% of all CT studies done in the department were being examined in a nonaxial mode by radiologists. Among nonradiologists, 21% of all CTs were being examined in a nonaxial mode.
To determine whether these results were unique to our department, we looked at audit logs from 3 different institutions. At site A (our institution), 90% of all studies were being looked at by clinicians or radiologists in nonaxial mode. At site B, an academic institution, nearly 25% studies were being looked at in advanced visualization mode. At site C, a community hospital, only 6% of studies were being looked at in advanced visualization mode. When utilization of 3D visualizations was tracked over time, we saw increasing utilization of advanced visualization at site A, whereas utilization at the other two sites was nearly flat.
In the middle of the study period, site B integrated its clinical applications with the PACS and changed its procedures so that all studies done on the scanners were automatically sent to the server-side rendering application. It also added a 3D button on the PACS that the radiologists could use to launch cases on the 3D applications. After site B implemented the new policy and made it easier for radiologists to do 3D interpretation, we found that the utilization trend became similar to that of site A, where all studies automatically went to the thin-client application.
At site C, the advanced visualization server was in an on-demand mode. All studies were reconstructed on the scanner; therefore, many MIPs, multiplanar reconstructions, and other nonaxial images were sent to the PACS directly rather than to the thin-client application. When radiologists needed to view studies on the thin-client applications, they would ask the technologist to push them from the PACS. At site C, 3D utilization remained low throughout the study.
These results showed that if an institution enables technology, makes it available, and incorporates it into the work-flow, radiologists will use it. Studies by Dr. Siegel 3 have shown that use of an advanced multiplanar interpretation process actually saves time, for example, cutting the time spent reading a chest CT from an average of 7 minutes to an average of 5 minutes after implementation of a thin-client solution.
Current and future trends
It has become obvious to vendors and the academic community that making image data available anytime, anywhere is key. True thin-client workstations with server-side rendering and enterprise-wide distribution are the current trend.
As time goes on, and more and more studies involve dual-source scanners and multispectral imaging, there will be too much data for workflow to focus on the examination of axial, coronal, and sagittal images. Instead, workflow will need to become anatomy-driven and pathology-driven.
To do that, it will be necessary to automatically identify where the desired anatomy is. Some vendors are developing tools that preidentify anatomy before radiologists open the study, so that workflow can be based on anatomy. It will also be important to prespecify how radiologists want to see certain anatomy or pathology, rather than simply viewing traditional planes.
Another trend spurred by increasingly robust Internet technology is truly browser-based advanced visualization with "zero footprint," without the need for a client installation or even a "plug-in" for image viewing. This truly enables enterprise-wide and Web-based deployment of imaging solutions, and even opens the possibility of sharing images with patients.