The obesity epidemic: The role of radiology


Mr. Joseph is a medical student, Department of Radiology and Biomedical Imaging, University of California, San Francisco, San Francisco, CA; Dr. Naeger is a Fellow, Department of Radiology and Biomedical Imaging, University of California, San Francisco, San Francisco, CA; and Dr. Qayyum is Professor of Radiology, Residency Program Director, Department of Radiology and Biomedical Imaging, University of California, San Francisco, San Francisco, CA.
Obesity is a serious, multi-factorial, chronic illness affecting patients of all ages that continues to increase in prevalence at an alarming rate.1 The most common means of classifying obesity in clinical practice is the body mass index (BMI). BMI is determined by dividing the patient’s body weight by the square of his or her height. Obesity is defined as a BMI of ≥30. Morbid obesity is defined as a BMI of ≥35 with serious comorbidity, or as a BMI of 40 regardless of the presence of comorbidities.2
Estimates from the early 2000s revealed that 66% of all adults in the United States between the ages of 20 and 74 were overweight,and 32% were obese. These estimates reflect a nearly 40% increase in the percentage of overweight individuals and a doubling of the percentage of obese individuals over the past 22 years.3-5 The burgeoning obesity epidemic has presented new challenges and prompted investigators to initiate focused research on obesity-related disease. Obesity-related morbidity encompasses a large number of disorders, including: type II diabetes, dyslipidemias, hypertension and cardiovascular disorders, hepatobiliary disease, osteoarthritis, sleep apnea,and even certain malignancies (endometrial, breast, and colon cancer). Non-alcoholic fatty liver disease (NAFLD) has emerged as an area of particular interest. NAFLD is noted in 29% of obese individuals and in 7% of non-obese individuals, and is associated with diabetes and dyslipidemias.6
Non-alcoholic fatty liver disease
The pathogenesis of NAFLD is not fully understood, but is thought to be strongly associated with insulin resistance. In addition to hyperglycemia, insulin resistance alters the uptake, synthesis, degradation, and secretion of lipids in hepatocytes, resulting in an accumulation of triglycerides within the liver.7 A consequence of increased intracellular fatty acids is intensified oxidative stress within hepatocytes, which may be responsible for disease progression. The spectrum of NAFLD ranges from simple steatosis to the development of necro-inflammmatory change (non-alcoholic steatohepatitis [NASH]) to the formation of fibrosis and cirrhosis. Up to one third of NASH subjects demonstrate some degree of fibrosis, often at initial presentation.1,8-12 Once cirrhosis occurs, there is an associated risk of developing hepatocellular carcinoma.13, 14
Cryptogenic cirrhosis, cirrhosis without a known underlying cause, is the third most common diagnosis in liver transplant recipients.
Recent literature suggest a significant subset of these patients may actually have NASH, further highlighting the significant morbidity
and mortality of this disease.15-19
Imaging liver fat
Hepatic steatosis may be associated with progressive liver injury not only in patients with NAFLD but also in patients with chronichepatitis C infection and liver transplants. This has resulted in significant interest in the diagnosis and quantification of hepatic steatosis. The current gold standard for the diagnosis and quantification of steatosis is liver biopsy, although biopsy is invasive, painful and can result in complications and even death.20 In addition, liver biopsy can be inaccurate due to sampling errors, since steatosis is frequently heterogeneous. Variation in observations in the qualitative assessment of histopathological fat grading also limits reproducibility.21, 22
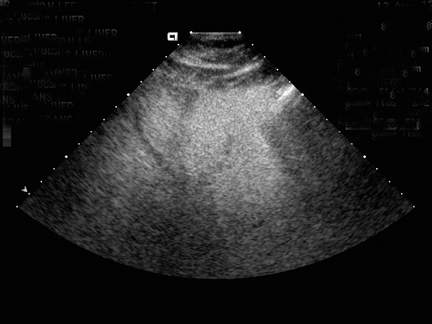
Steatosis is defined sonographically by the manifestation of a hyperechoic liver parenchyma with tightly packed fine echoes and posterior beam attenuation. Severe steatosis is diagnosed by obscuration of hepatic vasculature by hepatic parenchymal echogenicity and acoustic edges from intracellular lipid accumulation (Figure 1). Severe fatty liver, containing >30% fat by weight, is detected by sonography with a sensitivity and specificity of 67% to 84% and 77% to 100%, respectively.23, 24 Sonography is poor in detecting smaller amounts of fat in liver and in general is limited by the subjective nature of the assessment.25 This subjectivity also significantly hinders reliable assessment of interval change.26-28
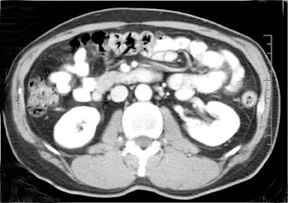
Computed tomography (CT) is used to quantify hepatic steatosis through the measurement of liver attenuation. Decreased liver attenuation is suggestive of increased liver fat. A low-dose vertebral scout to localize the T12 to L1 intervertebral space and a subsequent single image acquisition at T12 to L1 is a practical and reliable strategy for routine measurement of liver fat.29 Unenhanced CT indicates hepatic steatosis when liver attenuation is at ≤10 Hounsfield units (HU) below that of the spleen (Figure 2). Steatosis may also be suggested by the presence of heterogeneous liver attenuation and by “pseudoenhancement” (relative high density of the hepatic vessels compared with surrounding parenchyma). The criteria for fatty liver on post-contrast CT includes a lower attenuation of the liver than the spleen by a difference of >20 HU, or liver attenuation that is lower than muscle. Like ultrasound, CT is not sensitive in detecting mild elevations of hepatic lipid content (5% to 30%).26 Lall, et al., reported an overall sensitivity of 50% and specificity of 75% for estimation of liver fat.25 Inherent pitfalls in assessing liver fat estimation with CT include the co-existence of conditions that may result in increased liver attenuation, such as therapy with amiodarone and hemochromatosis. Hyper-attenuating liver parenchyma in the range of 70 to 130HU limits quantifying liver fat.30
Magnetic resonance imaging (MRI) is recognized as a sensitive technique for the quantification of liver fat. The normal hepatic fat fraction derived from MRI is reportedly <9%.31 MRI is able to measure liver fat based on the slightly different precessional frequencies of fat and water protons in a magnetic field. The most commonly used quantitative method is the acquisition of in- and out-of-phase imaging, or chemical shift imaging, in which different echo time (TE) parameters are used in gradient-echo images so that the signal from fat protons is added or subtracted, respectively, from the signal of water protons.25 Reduced signal on out-of-phase T1-weighted(T1W) images is an accurate proxy of histologic hepatic fat content with a Pearson correlation coefficient of 0.86 to 0.9132-34 (Figure 3).An important pitfall to the use of in- and out-of-phase imaging in steatosis is the potential susceptibility effect of liver iron; particularly with longer TEs, iron overload can result in an underestimation of liver fat.32, 35-37 Recently developed chemical shift imaging techniques incorporate the use of multiple TEs to create a T2* map, thereby correcting for the susceptibility effects of liver iron. Post-processing techniques based on mathematical algorithms to include multiple fat frequencies have also been suggested to provide a more robust MRI
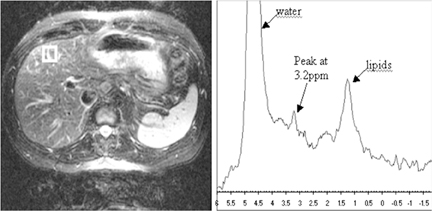
quantification of liver fat.38 Proton (1H) MR spectroscopy (MRS) (Figure 4) has been found to correlate with hepatic lipid content. Estimates of the correlation coefficient between MRS measurements and histologic fat measurements range from 0.91 to 0.98.39-41 This technique is considered sensitive to small variation (≤0.5% change) in hepatic lipid content and has the potential to assess for small changes in steatosis due to treatment.41 However, a small sampling area can result in inaccurate assessment of the overall amount of fatty change due to the heterogeneous distribution of fat.
Imaging visceral adipose tissue
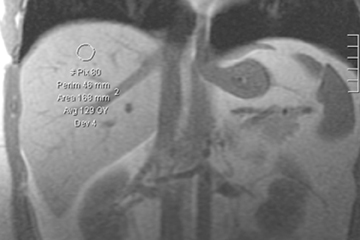
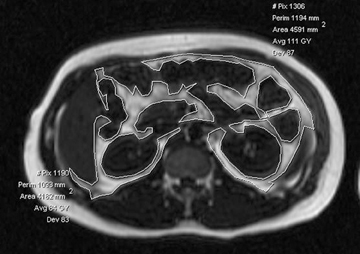
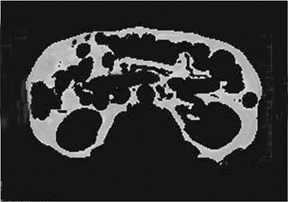
Liver steatosis has been shown to be clearly linked to obesity. Clinically, BMI has often been used as a surrogate anthropometric marker of obesity-related morbidity. This measurement does not account for body tissue composition or distribution of body fat.42-44 The highly metabolically active visceral fat has been shown to correlate more closely with liver steatosis than BMI.45-51 MRI-derived estimates of visceral fat have proven more accurate than the anthropometric indices, including the waist-to-hip ratio (Figure 5).31 A variety of MR techniques have been employed for visceral fat estimation, with most using select slices to extrapolate to the rest of the body.47-50 The single slice method can be inaccurate due to the significant extrapolation required.49 A study by Brennan, et al., attempted to reduce this inaccuracy by dividing the body into 3-dimensional voxels of 2.02 2 2.02 2 8.00 mm3, and subsequently employing computer-assisted diagnostic techniques to provide a definite distribution of fat deposition.52 Visceral and subcutanaeous adisposity may also be estimated using unenhanced CT with the measurement of tissue areas demonstrating fat attenuation (Figure 6).
Dual-energy X-ray (DEXA) was originally created for bone density analysis. However, it can also be used in body composition studies.53,54 Output measurements include total weights of fat, lean tissue, and bone mineral content. Radiation exposure of <15 µSv and a gantry that does not induce claustrophobia make this technique ideal for the pediatric population.55 This technique, however, cannot provide separate measurements of subcutaneous and visceral fat.56
Bariatric surgery
Staggering obesity rates, failure of traditional weight-loss methods, and evidence-based effectiveness have placed bariatric surgery in the forefront of morbid obesity treatment.57-59 Radiology plays an important role in the evaluation of the post operative bariatric patient.
Roux-en-Y is the most common bariatric procedure. The surgical protocol entails the creation of a gastric pouch separated completely from the remainder of the stomach, which is called the remnant. The jejunum is separated 30 cm to 40 cm distal from the ligament of Treitz and mobilized from the mesentery to form a gastrojejunostomy with side-to-side anastomosis. The anastomosed jejunal loop, called the Roux limb, is placed retrocolic through an aperture formed in, or in front of, the transverse mesocolon. Finally, a jejunojejunostomy is created 100 cm to 150 cm distal from the original gastrojejunostomy.60 The post operative day 1 assessment protocol includes an initial gastrograffin fluoroscopic imaging study to evaluate for anastomotic leak. If a nasogastric tube is present, often after an open Roux-en-Y gastric bypass, the tube must be pulled back as to not obscure leakage from the anastomosis.61 Rarely, leaked contrast entering the lumen of a surgical drain may be the only fluoroscopic evidence of leak and must not be overlooked. CT can be a useful adjunct modality, capable of demonstrating leaked contrast, as well as intra-abdominal collections and abscesses.
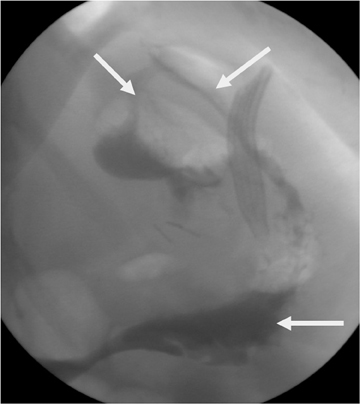
Gastric staple-line disruption is readily identified with fluoroscopy.62 Leaked contrast will either enter the peritoneal cavity if the 2portions of the stomach were surgically separated or will enter into the remnant if just a dividing staple line without surgical separation was used (Figure 7). Once contrast enters the gastric remnant, it may then be seen moving through the antrum and proximal duodenum (a path normally blocked by the Roux procedure). Contrast passing normally through the gastrojejunostomy may opacify the short blind-ending portion of the jejunum adjacent to the anastomotic site, mimicking leakage into the gastric remnant. This is distinguished from true leakage by a lack of progression of contrast beyond this site and the appearance of a jejuna mucosal pattern.60
In 5% of patients, obstruction occurs as a complication at the gastrojejunostomy site, mesocolic window, and behind the Roux limb(Peterson’s space).61-63 Anastomotic stricture at the gastrojejunal anastomosis is seen on fluoroscopy as narrowing at the gastrojejunalanastomosis, with expansion of the gastric pouch and delayed transit of contrast into the Roux limb.60 Mesocolic window stenosis is a potential cause of obstruction in patients with retrocolic placement of the Roux limb and is seen fluoroscopically as distention of the Roux limb proximal to the location of the mesocolic window.
Laparoscopic adjustable gastric banding involves an adjustable silicon band lined with an inflatable balloon that is placed around the superior stomach to create a small gastric pouch and an adjustable stoma to the rest of the stomach. The surrounding anterior gastric wall is usually sutured over the band towards the gastric pouch to prevent band slippage. The balloon is connected to a subcutaneous port in the abdomen that alters the diameter of the gastric stoma through injecting and aspirating saline into the port.60,64,65
The first fluoroscopic evaluation of postbanding patients is done postoperatively on day 1 to assess the size of the gastric pouch, assess for leakage indicating iatrogenic injury, and to assess for normal passage of contrast through the stoma. The gastric pouch should be 3 to 4 cm maximally and symmetric when distended with contrast material. The stoma should measure 3 to 4 mm in diameter and should allow passage of all contrast material within 15 to 29 minutes postadministration.66 The phi angle assesses slippage and is formed by the intersection of the lines parallel to the spinal column and antero-posterior plane of the gastric band. An angle that is 4° to 58° and 4 cm to 5 cm below the left hemidiaphragm is considered normal. Anterior or posterior herniation of the distal stomach through the band creates a phi angle < and> normal, respectively.67,68 Band system leakage may occur at the level of the band, connector, tubing, or access port.Suspicion for this complication should arise when there is insufficient deflation volume and loss of eating restriction. The leak can be detected when adjusting the band diameter under fluoroscopy.66 A 99mTc-albumin study can prove useful in locating the leak.68 The lap-band procedure shares the majority of the common complications seen after Roux-en-Y and can be evaluated through similar radiologic studies. Chandler et al. provide a thorough, in-depth evaluation of rarer complications.60
Special considerations
The size of obese and bariatric patients imposes certain limitations for imaging. CT and fluoroscopy table weight limits, often 450 to 500 lbs, and a gantry opening of 70 cm can preclude imaging certain patients. Dropping the CT table can potentially accommodate larger patients. The larger body habitus of bariatric patients can also degrade image quality. The use of conventional, rather than spiral scanning, techniques and increased mAs can improve quality imaging through increases in radiation.
Upper airway obstruction is an inherent risk of positioning obese patients in the supine position. The imaging team should be prepared for this possible complication and may consider having the lift team readily available.
Conclusion
Increasing incidence of obesity and NAFLD underscores the necessity of diagnosing fatty liver before progressing to advanced disease states. Imaging is an efficient and safe alternative to liver biopsy for estimating liver fat. Of the imaging options, MRI is considered the safest and most sensitive technique in detecting liver steatosis.
MRI and CT may also be used to estimate visceral fat, which demonstrates a better correlation with liver steatosis than anthropometric measures. Imaging also plays a pivotal role in the postoperative evaluation of bariatric patients.
References
- Ludwig J, Viggiano TR, McGill DB, Oh BJ. Nonalcoholic steatohepatitis: Mayo Clinic experiences with a hitherto unnamed disease. Mayo Clin Proc. 1980;55:434-438.
- Schaffner F, Thaler H. Nonalcoholic fatty liver disease. Prog Liver Dis. 1986;8:283-298.
- U.S. Obesity trend: Trends by state. Centers for Disease Control and Prevention, National Center for Health Statistics. Available at: http://www.cdc.gov/obesity/data/trends. html. Accessed November 11, 2010.
- Brolin RE. Bariatric surgery and long-term control of morbid obesity. JAMA. 2002;288:2793-2796.
- Hedley AA, Ogden CL, Johnson CL, et al. Prevalence of overweight and obesity among US children, adolescents, and adults, 1999-2002. JAMA. 2004;291:2847-2850.
- Jimba S, Nakagami T, Takahashi M, et al. Prevalence of non-alcoholic fatty liver disease and its association with impaired glucose metabolism in Japanese adults. Diabet Med. 2005;22:1141-1145.
- Marchesini G, Brizi M, Morselli-Labate AM, et al. Association of nonalcoholic fatty liver disease with insulin resistance. Am J Med. 1999;107:450-455.
- Angulo P. Nonalcoholic fatty liver disease. N Engl J Med. 2002;346:1221-1231.
- Sanyal AJ, Campbell-Sargent C, Mirshahi F, et al. Nonalcoholic steatohepatitis: Association of insulin resistance and mitochondrial abnormalities. Gastroenterology. 2001;120:1183-1192.
- Bacon BR, Farahvash MJ, Janney CG, Neuschwander-Tetri BA. Nonalcoholic steatohepatitis: An expanded clinical entity. Gastroenterology. 1994;107:1103-1109.
- Sanyal AJ, American Gastroenterological Association. AGA technical review on nonalcoholic fatty liver disease. Gastroenterology. 2002;123:1705-1725.
- Powell EE, Cooksley WGE, Hanson R, et al. The natural history of nonalcoholic steatohepatitis: A follow-up study of forty-two patients for up to 21 years. Hepatology. 1990;11:74-80.
- Bugianesi E, Leone N, Vanni E, et al. Expanding the natural history of nonalcoholic steatohepatitis from cryptogenic cirrhosis to hepatocellular carcinoma. Gastroenterology. 2002;123:134-140.
- Neuschwander-Tetri BA, Caldwell SH. Nonalcoholic steatohepatitis: Summary of an AASLD single topic conference. Hepatology. 2003;37:1202-1219.
- Contos MJ, Cales W, Sterling RK, et al. Development of nonalcoholic fatty liver disease after orthotopic liver transplantation for cryptogenic cirrhosis. Liver Transpl. 2001;7:363-373.
- Caldwell SH, Oelsner DH, Iezzoni JC, et al. Cryptogenic cirrhosis: Clinical characterization and risk factors for underlying disease. Hepatology. 1999;29:664-669.
- Poonawala A, Nair SP, Thuluvath PJ. Prevalence of obesity and diabetes in patients with cryptogenic cirrhosis: A case-control study. Hepatology. 2000;32:689-692.
- Sakugawa H, Nakasone H, Nakayoshi T, et al. Clinical characteristics of patients with cryptogenic liver cirrhosis in Okinawa, Japan. Hepatogastroenterology. 2003;50:2005-2008.
- Ong J, Younossi ZM, Reddy V, et al. Cryptogenic cirrhosis and posttransplantation nonalcoholic fatty liver disease. Liver Transpl. 2001;7:797-801.
- Sheela H, Seela S, Caldwell C, et al. Liver biopsy: Evolving role in the new millennium. J Clin Gastroenterol. 2005,39:603-610.
- Mehta SR, Thomas EL, Bell JD, et al. Non-invasive means of measuring hepatic fat content. World J Gastroenterol. 2008;14:3476-3483.
- Ratziu V, Charlotte F, Heurtier A, et al. Sampling variability of liver biopsy in nonalcoholic fatty liver disease. Gastroenterology. 2005;128:1898-1906.
- Graif M, Yanuka M, Baraz M, et al. Quantitative estimation of attenuation in ultrasound video images: Correlation with histology in diffuse liver disease. Invest Radiol. 2000;35:319-324.
- Saadeh S, Younossi ZM, Remer EM, et al. The utility of radiological imaging in nonalcoholic fatty liver disease. Gastroenterology. 2002;123:745-750.
- Lall CG, Aisen AM, Bansal N, et al. Nonalcoholic fatty liver disease. AJR Am J Roentgenol. 2008;190:993-1002.
- Joseph AE, Saverymuttu SH, al-Sam S, et al. Comparison of liver histology with ultrasonography in assessing diffuse parenchymal liver disease. Clin Radiol. 1991;43:26-31.
- Needleman L, Kurtz AB, Rifkin MD, et al. Sonography of diffuse benign liver disease: Accuracy of pattern recognition and grading. AJR Am J Roentgenol. 1986;146:10111015.
- Saverymuttu SH, Joseph AE, Maxwell JD. Ultrasound scanning in the detection of hepatic fibrosis and steatosis. Br Med J. 1986;292:13-15.
- Davidson LE, Kuk JL, Church TS, Ross R. Protocol for measurement of liver fat by computed tomography. J Appl Physiol. 2006;100:864-868.
- Siegelman ES, Rosen MA. Imaging of hepatic steatosis. Semin Liver Dis. 2001;21:71-80.
- Bahl M, Qayyum A, Westphalen AC, et al. Liver steatosis: Investigation of opposed-phase T1-weighted liver MR signal intensity loss and visceral fat measurement as biomarkers. Radiology. 2008;249:160-166.
- Levenson H, Greensite F, Hoefs J, et al. Fatty infiltration of the liver: Quantification with phase-contrast MR imaging at 1.5 T vs biopsy. AJR Am J Roentgenol. 1991;156:307-312.
- Fishbein MH, Gardner KG, Potter CJ, et al. Introduction of fast MR imaging in the assessment of hepatic steatosis. Magn Reson Imaging. 1997;15:287-293.
- Promrat K, Lutchman G, Uwaifo GI, et al. A pilot study of pioglitazone treatment for nonalcoholic steatohepatitis. Hepatology. 2004;39:188-196.
- Kreft BP, Tanimoto A, Baba Y, et al. Diagnosis of fatty liver with MR imaging. J Magn Reson Imaging. 1992;2:463-471.
- Qayyum A, Goh JS, Kakar S, et al. Accuracy of liver fat quantification at MR imaging: Comparison of out-of-phase gradient-echo and fat-saturated fast spin-echo techniques—initial experience. Radiology. 2005;237:507-511.
- Westphalen AC, Qayyum A, Yeh BM, et al. Liver fat: Effect of hepatic iron deposition on evaluation with opposed-phase MR imaging. Radiology. 2007;242:450-455.
- Hines CD, Yu H, Shimakawa A, McKenzie CA, et al. T1 independent, T2* corrected MRI with accurate spectral modeling for quantification of fat: Validation in a fat-water-SPIO phantom. J Magn Reson Imaging. 2009;30:1215-1222.
- Bley TA, Wieben O, Francois CJ, et al. Fat and water magnetic resonance imaging. J Magn Reson Imaging. 2010;31:4-18.
- Machann J, Thamer C, Schnoedt B, et al. Hepatic lipid accumulation in healthy subjects: A comparative study using spectral fat-selective MRI and volume-localized 1H-MR spectroscopy. J Magn Reson Med. 2006;55:913-917.
- Longo R, Pollesello P, Ricci C, et al. Proton MR spectroscopy in quantitative in vivo determination of fat content in human liver steatosis. J Magn Reson Imaging. 1995;5:281-285.
- Thomsen C, Becker U, Winkler K, et al. Quantification of liver fat using magnetic resonance spectroscopy. Magn Reson Imaging. 1994;12:487-495.
- Ramesh S, Sanyal AJ. Hepatitis C and nonalcoholic fatty liver disease. Semin Liver Dis. 2004;24:399-413.
- Luyckx FH, Desaive C, Thiry A, et al. Liver abnormalities in severely obese subjects: Effect of drastic weight loss after gastroplasty. Int J Obes Relat Metab Disord. 1998;22:222-226.
- Bonora E. Relationship between regional fat distribution and insulin resistance. Int J Obes Relat Metab Disord. 2000;24:S32-S35.
- Kral JG, Schaffner F, Pierson RN Jr, Wang J. Body fat topography as an independent predictor of fatty liver. Metabolism. 1993;42:548-551.
- Asayama K, Hayashibe H, Dobashi K, et al. Relationships between biochemical abnormalities and anthropometric indices of overweight, adiposity, and body fat distribution in Japanese elementary school children. Int J Obes Relat Metab Disord. 1995;19:253-259.
- Omagari K, Kadokawa Y, Masuda J, et al. Fatty liver in non-alcoholic non-overweight Japanese adults: Incidence and clinical characteristics. J Gastroenterol Hepatol. 2002;17:1098-1105.
- Ruhl CE, Everhart JE. Determinants of the association of overweight with elevated serum alanine aminotransferase activity in the United States. Gastroenterology. 2003;124:71-79.
- Eguchi Y, Eguchi T, Mizuta T, et al. Visceral fat accumulation and insulin resistance are important factors in nonalcoholic fatty liver disease. J Gastroenterol. 2006;41:462-469.
- Marceau P, Biron S, Hould FS, et al. Liver pathology and the metabolic syndrome X in severe obesity. J Clin Endocrinol Metab. 1999;84:1513-1517.
- Sabir N, Sermez Y, Kazil S, Zencir M. Correlation of abdominal fat accumulation and liver steatosis: Importance of ultrasonographic and anthropometric measurements. Eur J Ultrasound. 2001;14:121-128.
- Brennan DD, Whelan PF, Robinson K, et al. Rapid automated measurement of body fat distribution from whole-body MRI. AJR Am J Roentgenol. 2005;185:418-423.
- Pietrobelli A, Formica C, Wang Z, Heymsfield SB. Dual-energy X-ray absorptiometry body composition model: Review of physical concepts. Am J Physiol. 1996;271:941-951.
- Bachrach LK. Dual energy X-ray absorptiometry (DEXA) measurements of bone density and body composition: Promise and pitfalls. J Pediatr Endocrinol Metab. 2000;13:983-988.
- Mattsson S, Thomas BJ. Development of methods for body composition studies. Phys Med Biol. 2006;51:203-228.
- Kullberg J, Brandberg J, Angelhed JE, et al. Whole-body adipose tissue analysis: Comparison of MRI, CT and dual energy X-ray absorptiometry. Br J Radiol. 2009;82:123-130.
- Livingston EH. Obesity and its surgical management. Am J Surg. 2002;184:103-113.
- Puzziferri N, Austrheim-Smith IT, Wolfe BM, et al. Three-year follow-up of a prospective randomized trial comparing laparoscopic versus open gastric bypass. Ann Surg. 2006;243:181-188.
- Ali MR, Fuller WD, Choi MP, Wolfe BM. Bariatric surgical outcomes. Surg Clin North Am. 2005;85:835-852.
- Chandler RC, Srinivas G, Chintapalli KN, et al. Imaging in bariatric surgery: A guide to postsurgical anatomy and common complications. AJR Am J Roentgenol. 2008;190:122-135.
- Merkle EM, Hallowell PT, Crouse C, et al. Roux-en-Y gastric bypass for clinically severe obesity: Appearance and spectrum of complications at imaging. Radiology. 2005;234:674-683.
- Carucci LR, Turner MA. Radiologic evaluation following Roux-en-Y gastric bypass surgery for morbid obesity. Eur J Radiol. 2005;53:353-365.
- Blachar A, Federle MP. Gastrointestinal complications of laparoscopic Roux-en-Y gastric bypass surgery in patients who are morbidly obese: Findings on radiography and CT. AJR Am J Roentgenol. 2002;179:1437-1442.
- The story of surgery for obesity. American Society for Bariatric Surgery. Available at: http://www.asbs.org/html/story/chapter1.html. Accessed on November 11, 2010.
- Herron DM. The surgical management of severe obesity. Mt Sinai J Med. 2004;71:63-71.
- Pretolesi F, Camerini G, Bonifacino E, et al. Radiology of adjustable silicone gastric banding for morbid obesity. Br J Radiol. 1998;71:717-722.
- Mehanna MJ, Birjawi G, Moukaddam HA, et al. Complications of gastric banding: A radiological pictorial review. AJR Am J Roentgenol. 2006;186:522-534.
- Weiss H, Peer R, Nehoda H, et al. Improved scinti-graphic assessment of occult leakages in adjustable gastric bands using 99mTc-labelled human albumin colloid. Obes Surg. 2001;11:502-506.