Lung Ultrasound: A Practical Review for Radiologists
Images
SA-CME credit is available for this article. Visit appliedradiology.org/SAM2.
Although lung ultrasound (LUS) is a growing component of patient care, the modality has not traditionally been taught in radiology residency.1 The 2022 diagnostic radiology program requirements of the Accreditation Council for Graduate Medical Education state that, “residents must demonstrate competence in the generation of ultrasound images using the transducer and imaging system.” However, a recent survey of radiology residents found that only 26% believed they received adequate training to perform their own ultrasounds scans.2
The goal of this focused review of LUS is to provide radiologists and radiology residents a practical, clinically useful guide to performing and interpreting normal and pathologic ultrasound findings.
History of Lung Ultrasound
The medical application of ultrasound emerged around the halfway point of the 20th century. In 1959, Crawford et al used a device consisting of a transmitting transducer on the anterior chest and a receiving transducer on the posterior chest to describe differing decibel transmissions through the chest with inspiration and expiration.3 Subsequent clinical studies focused primarily on the pleural space or findings just deep to the pleural line and demonstrated LUS utility in identifying and assessing pleural effusions after thoracentesis. Specifically, LUS showed echogenic changes at the periphery of the lung, suggesting ischemic zones consistent with pulmonary emboli, and demonstrated its utility in guiding peripheral pulmonary mass biopsy.4-6
As the field evolved, investigators moved from evaluating structure to interpreting artifacts produced by ultrasound’s interaction with the pleural line and the lung behind it. A major advancement in our collective understanding of the utility of LUS came with the exploration of these artifacts and their subsequent patterns, culminating in publication of the BLUE Protocol in 2008.7 This publication helped to define LUS patterns for specific diseases such as chronic obstructive pulmonary disease, pulmonary edema, pneumothorax, and pneumonia. Additionally, it offered an algorithmic decision tree for diagnosing one of these disease processes based on a handful of LUS findings and their distribution within the thorax. This gave the bedside provider a tool to rapidly assess and diagnose the cause of respiratory distress in real time. Lung ultrasound has since gained significant traction in clinical practice.
Scanning Technique and Normal Lung Findings
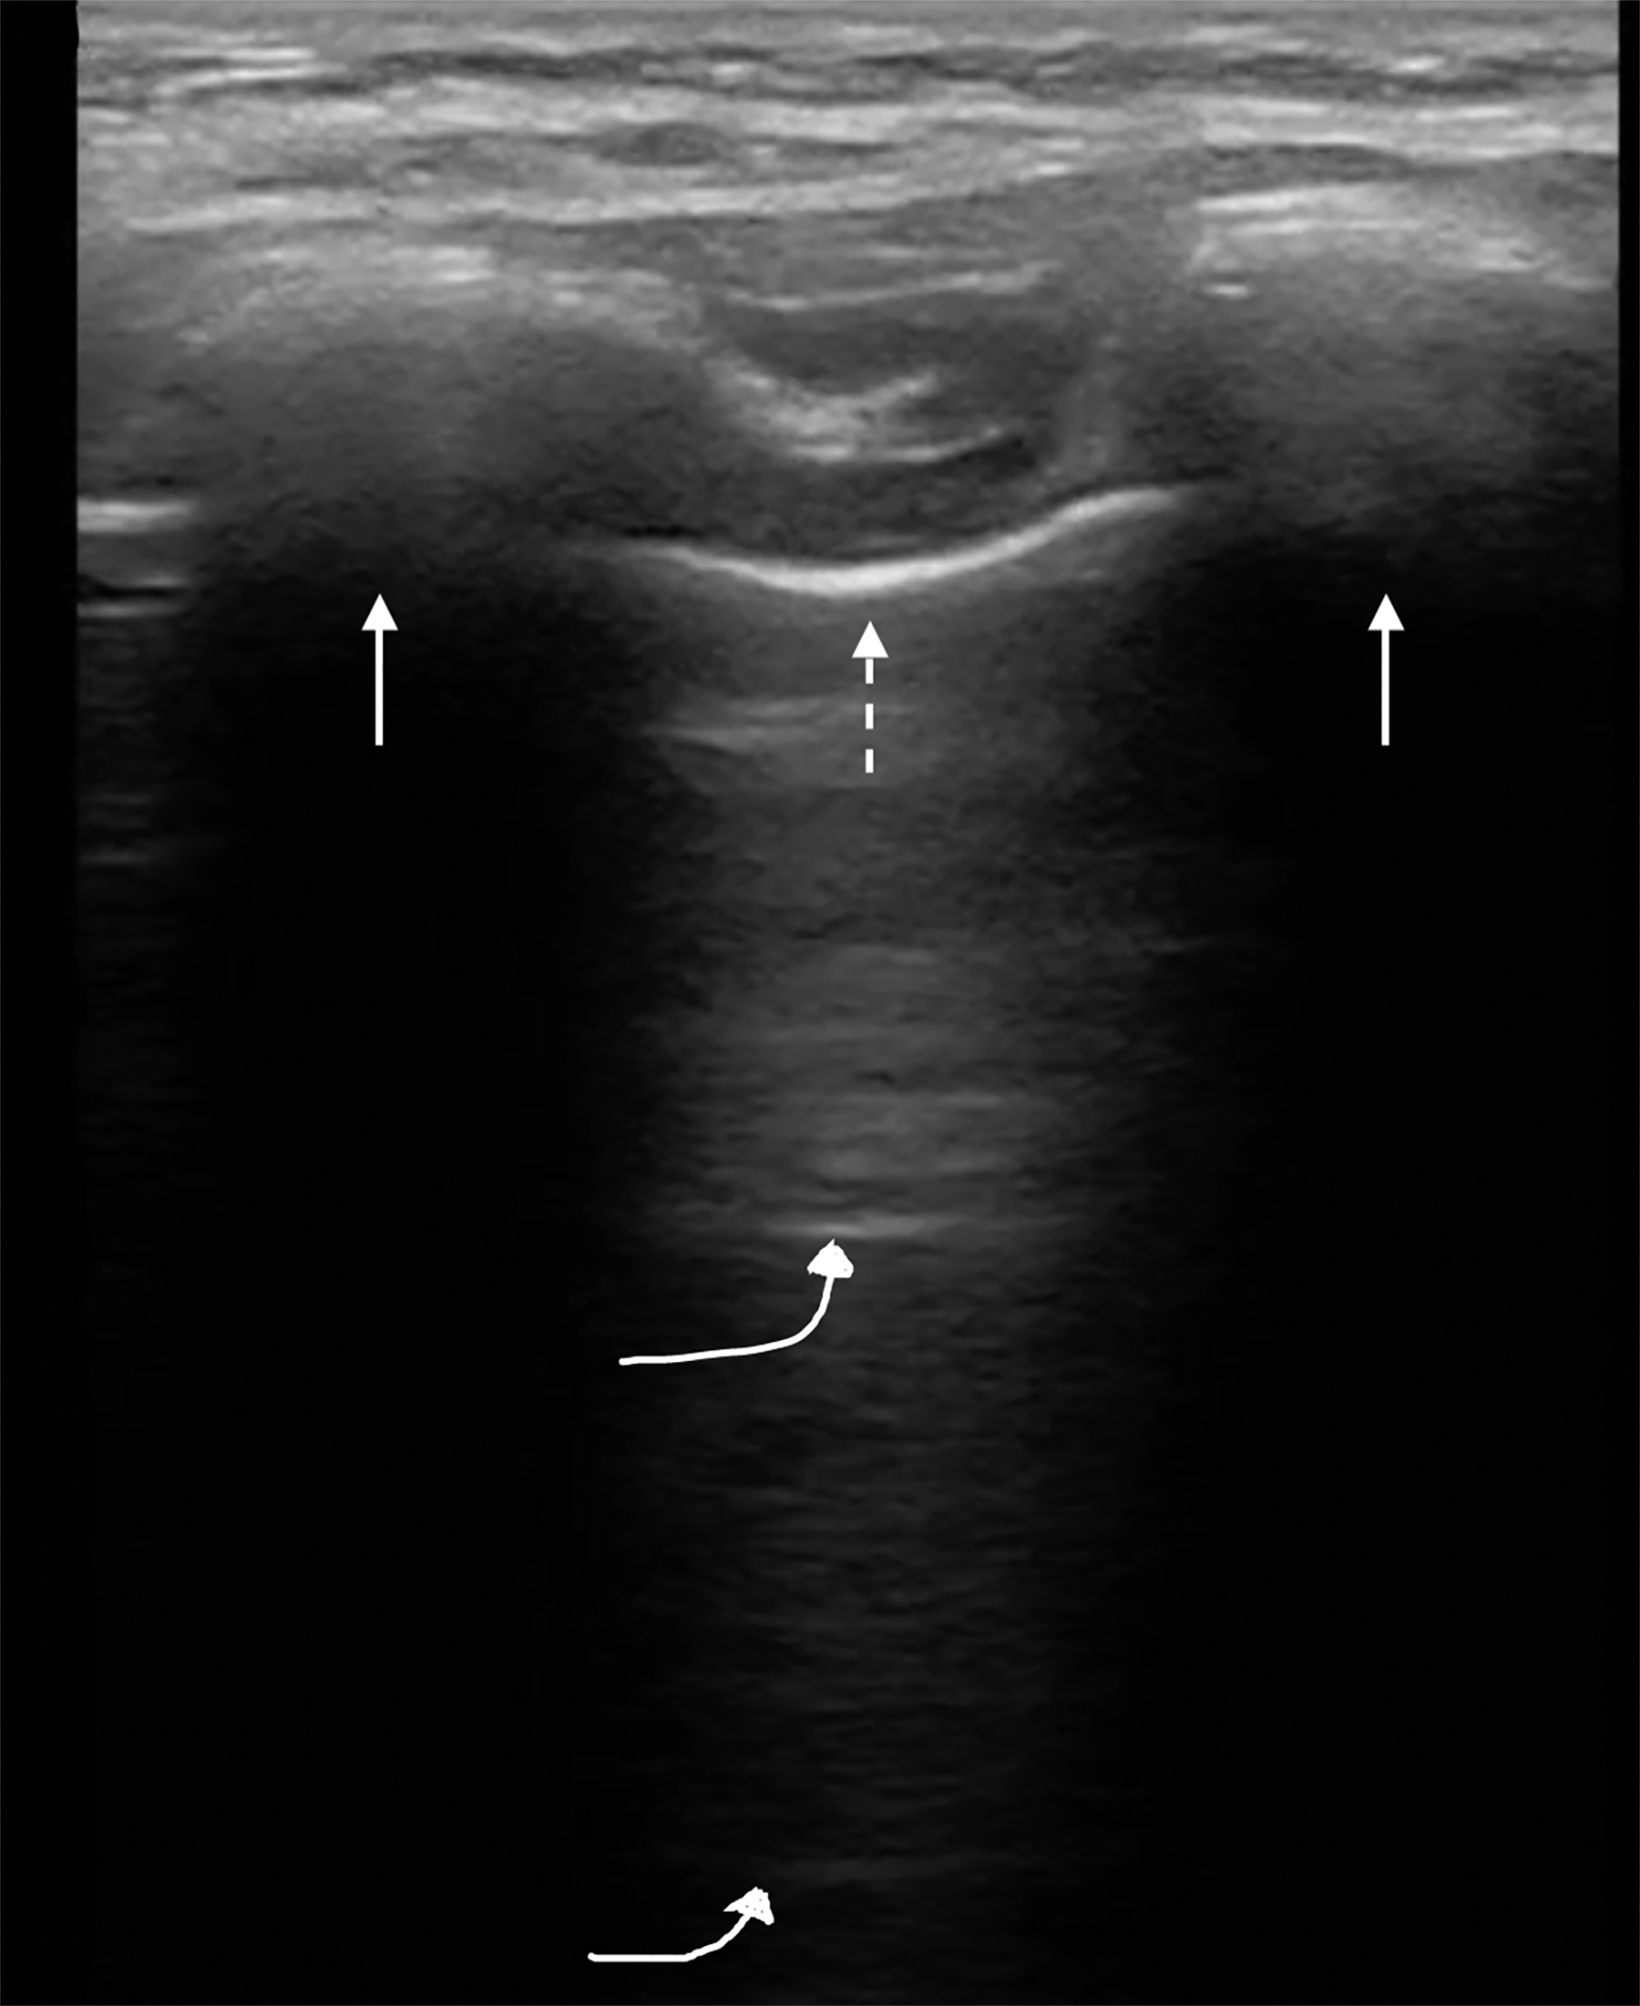
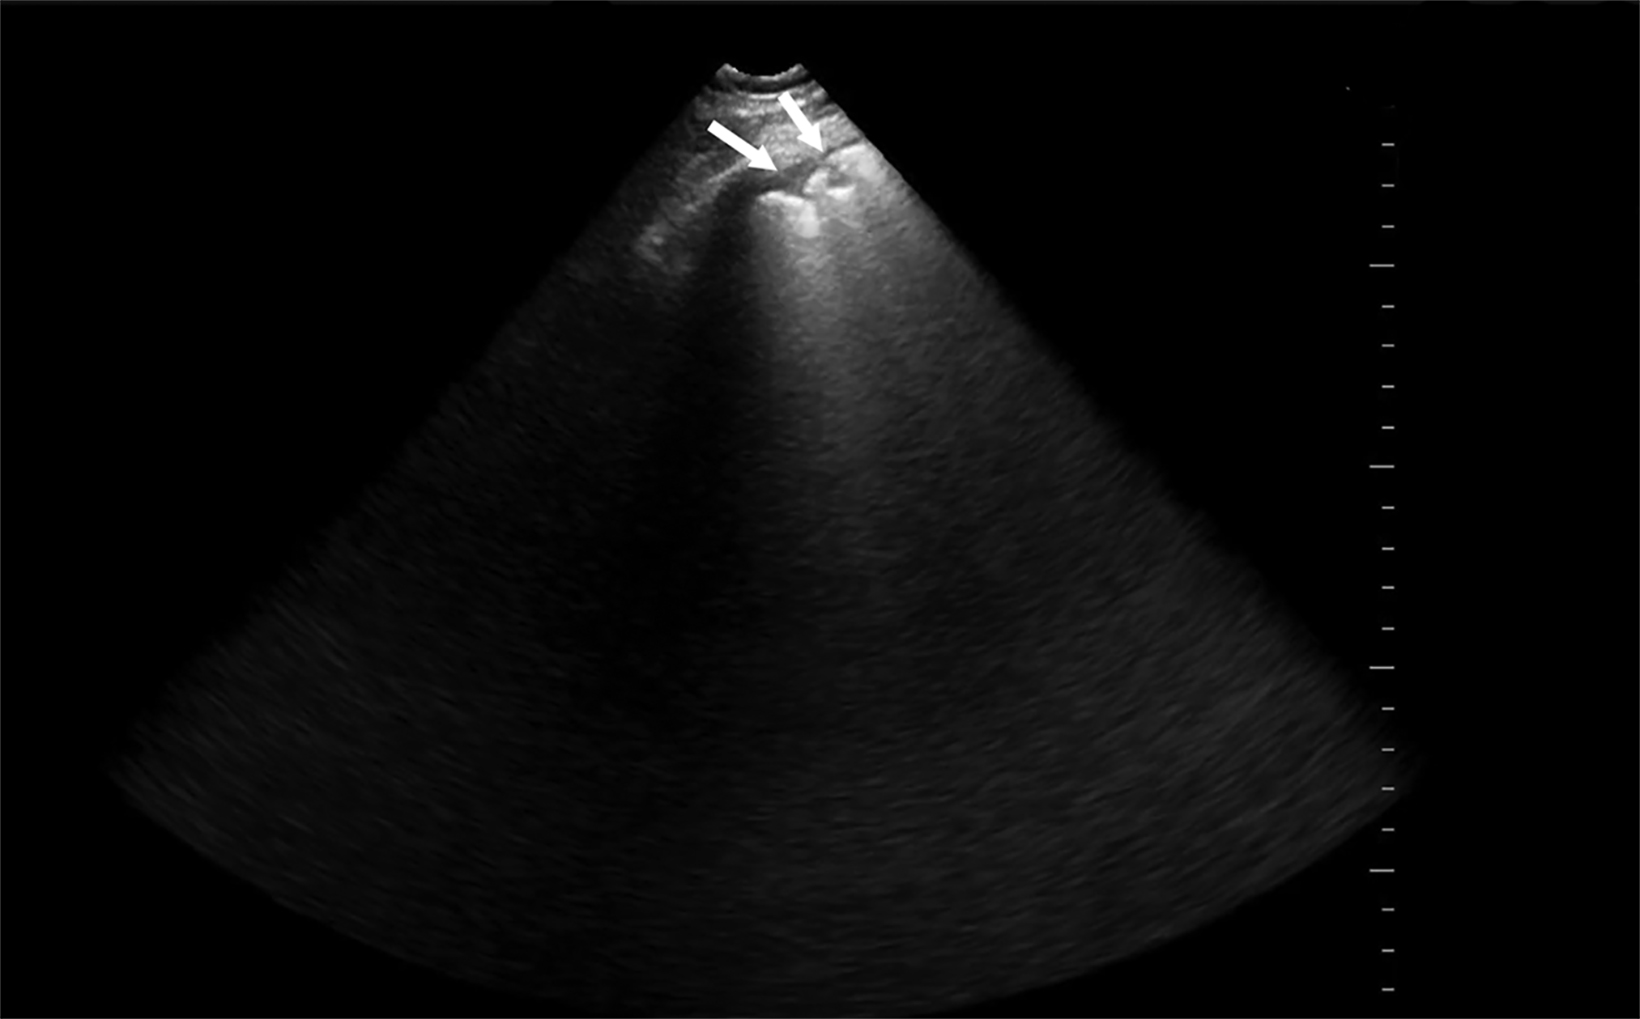
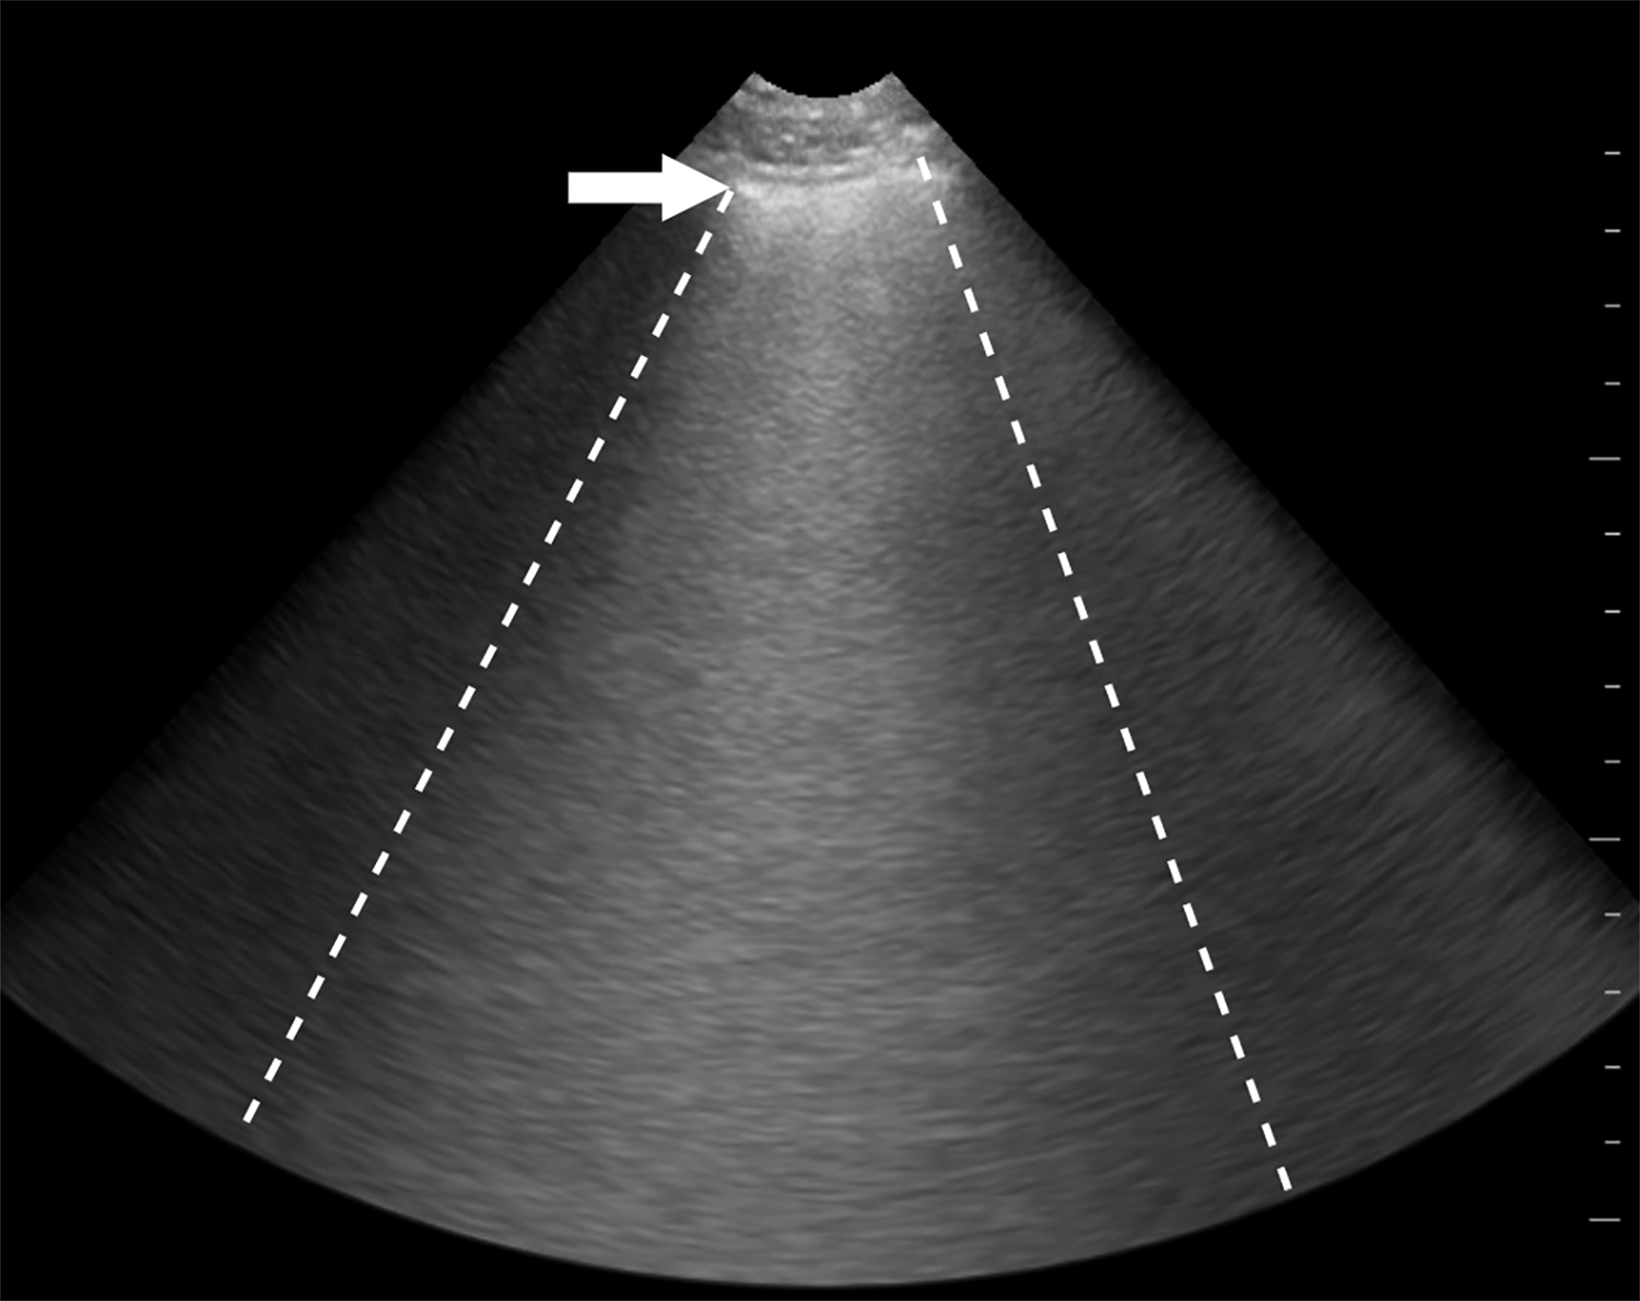
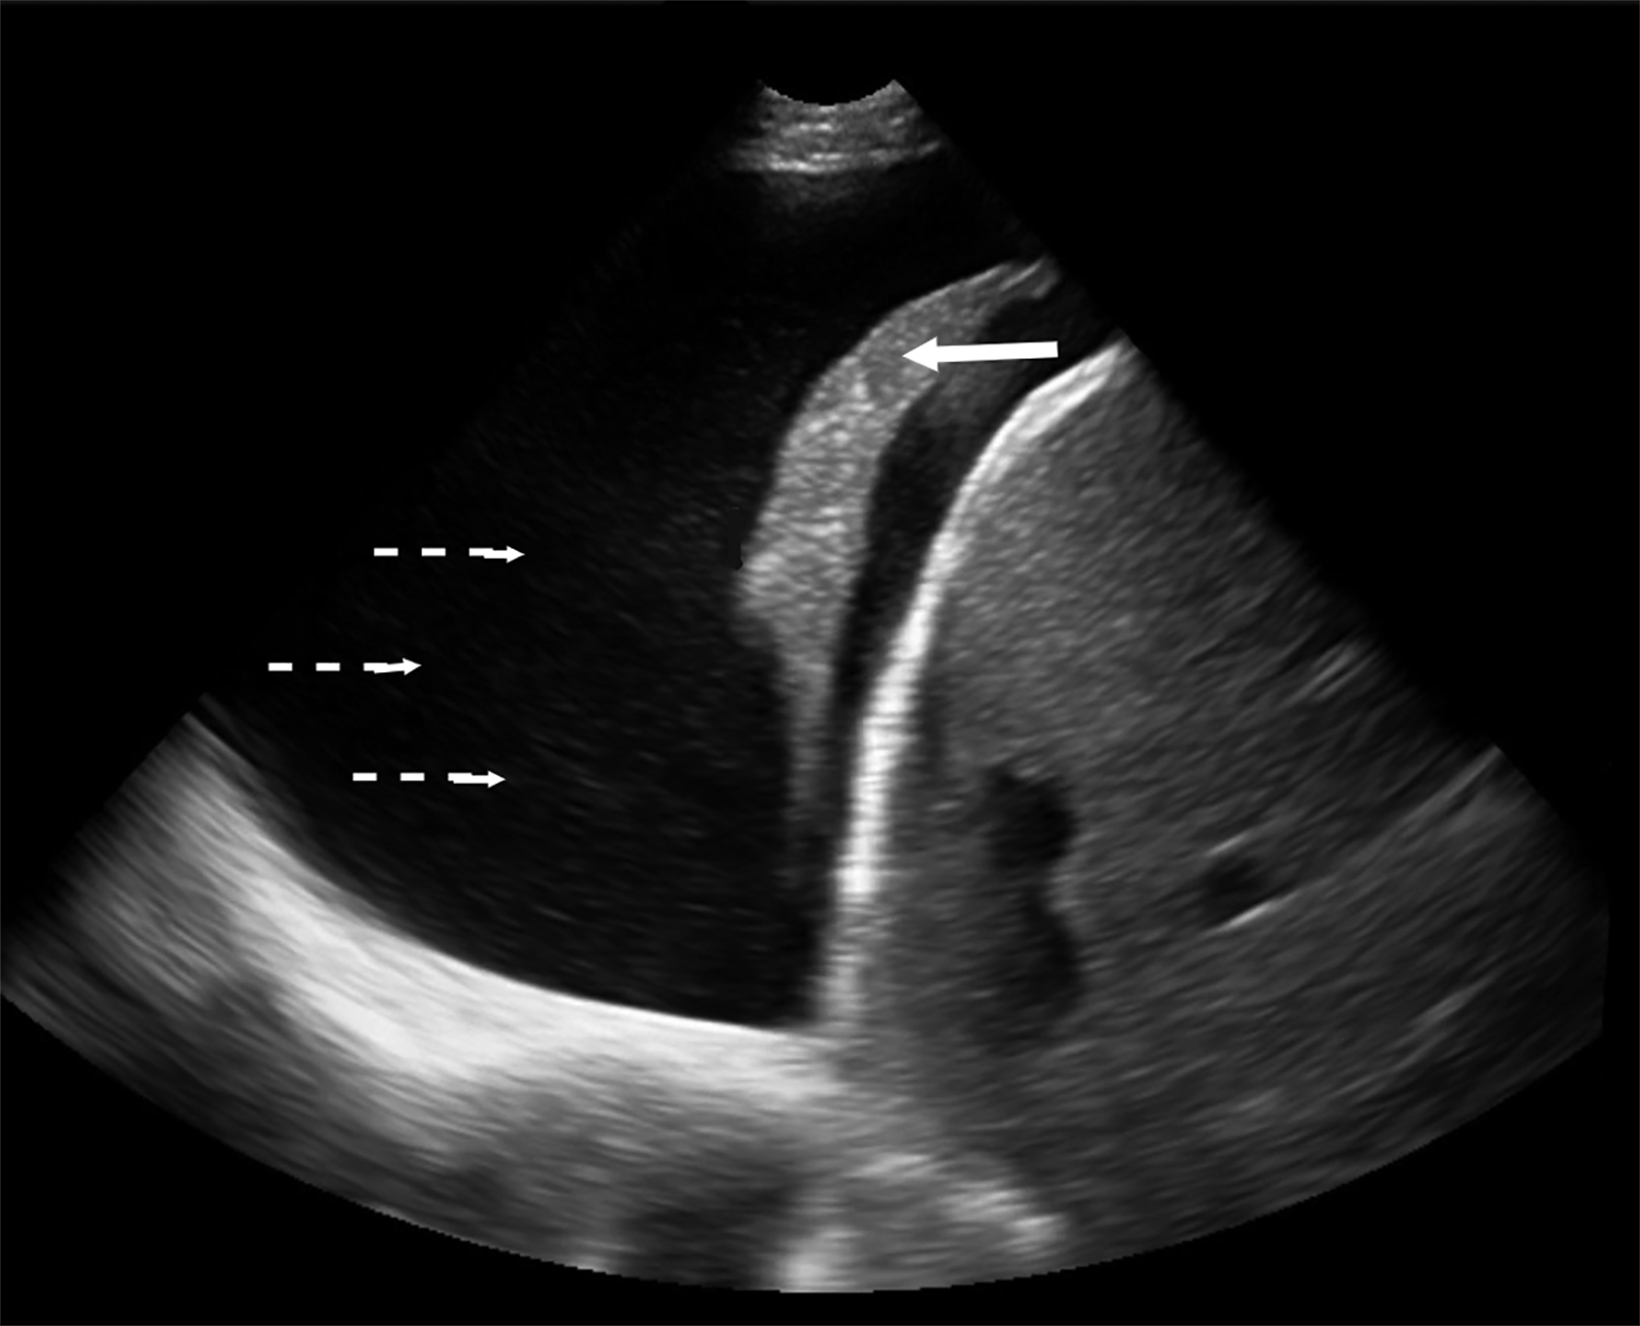
Lung ultrasound can be performed with a low-frequency phased array or curvilinear probe to highlight artifactual patterns. The linear probe can highlight pleural pathology. The bright hyperechoic pleural line is identified between ribs within intercostal spaces (Figure 1). With breathing the visceral pleura moves in relationship to the parietal pleura. This is best appreciated in real time and has been termed “lung sliding.” This sign is important, as it defines the periphery of the lung parenchyma, which must be avoided during biopsy of the subdiaphragmatic liver lesion or while performing thoracentesis.
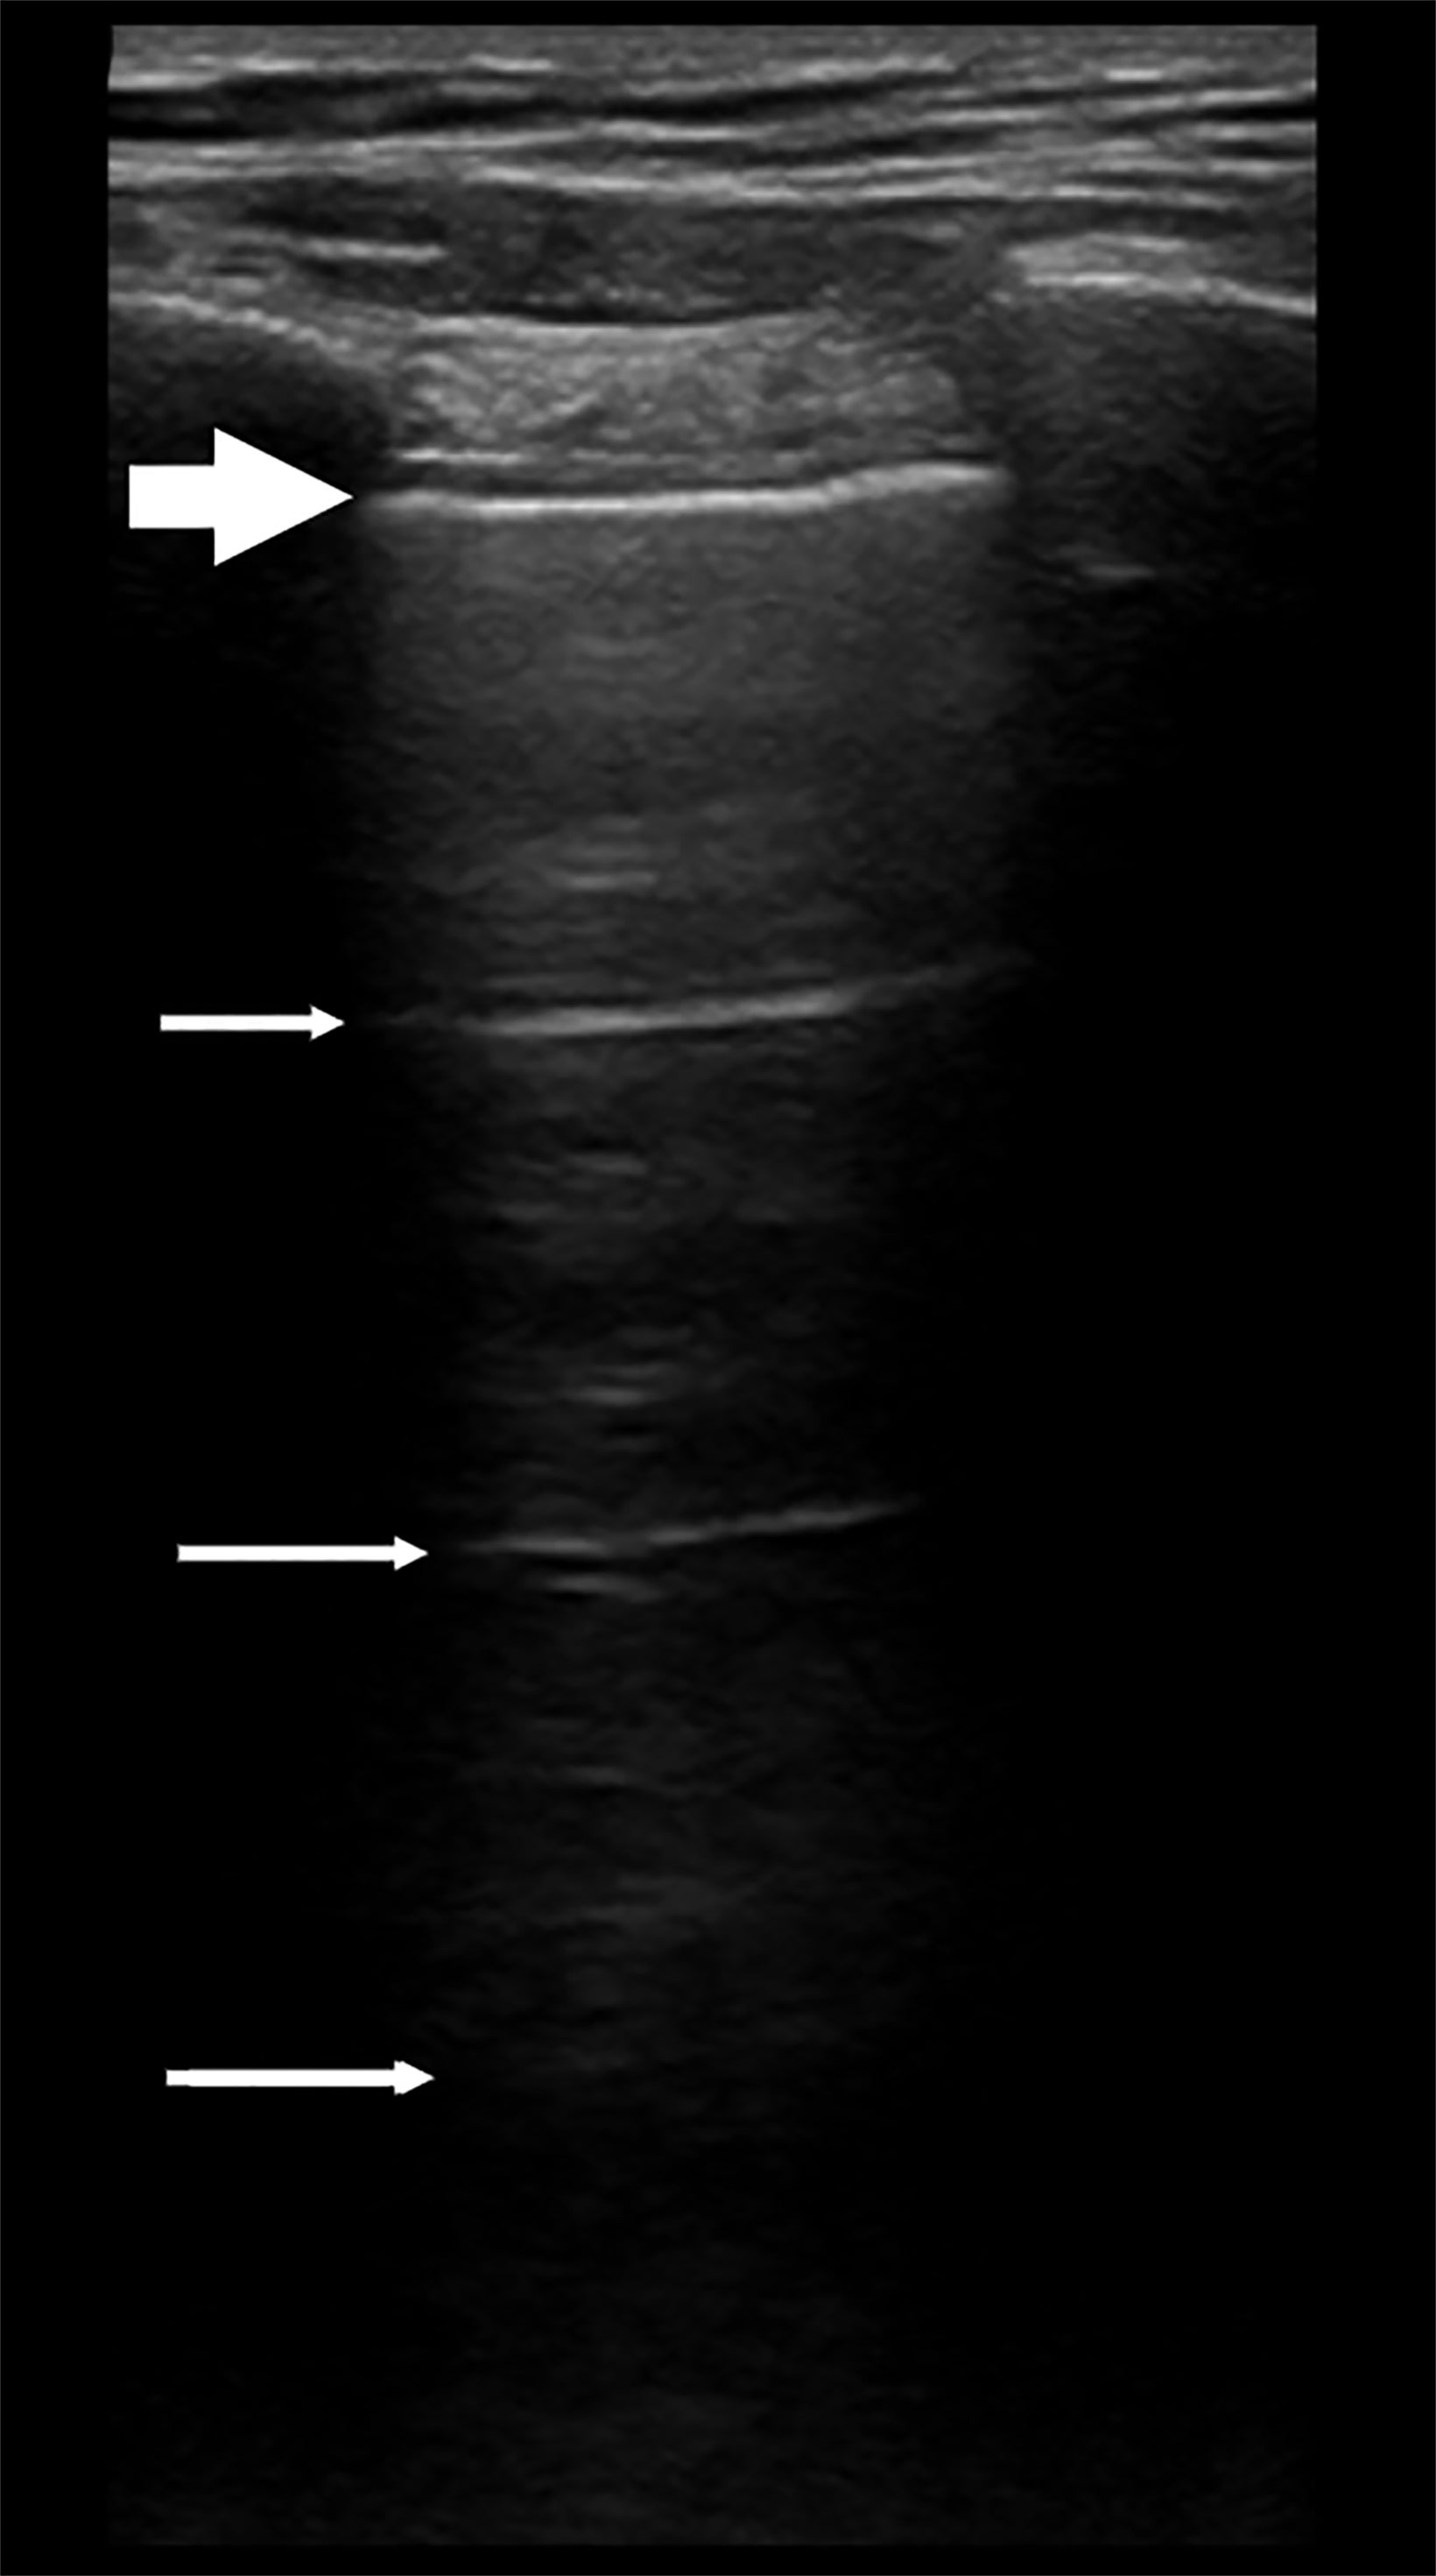
The absence of lung sliding may be indicative of a pneumothorax resulting from trauma, a thoracic and/or abdominal biopsy, or drainage procedures. In the normal lung, deep to the pleural interface, are horizontal hyperechoic lines called “A” lines, which are reverberation artifacts occurring between the transducer and the parietal/visceral pleural interface. They are displayed at equidistant intervals within the lung and, if accompanied by lung sliding, indicate no pneumothorax is present in this region (Figure 2). The ribs are seen as hyperechoic structures with dense shadowing deep to the ribs and overlying the pleura. Thus, the pleural interface cannot be identified posterior to the ribs because of the acoustic shadowing.8
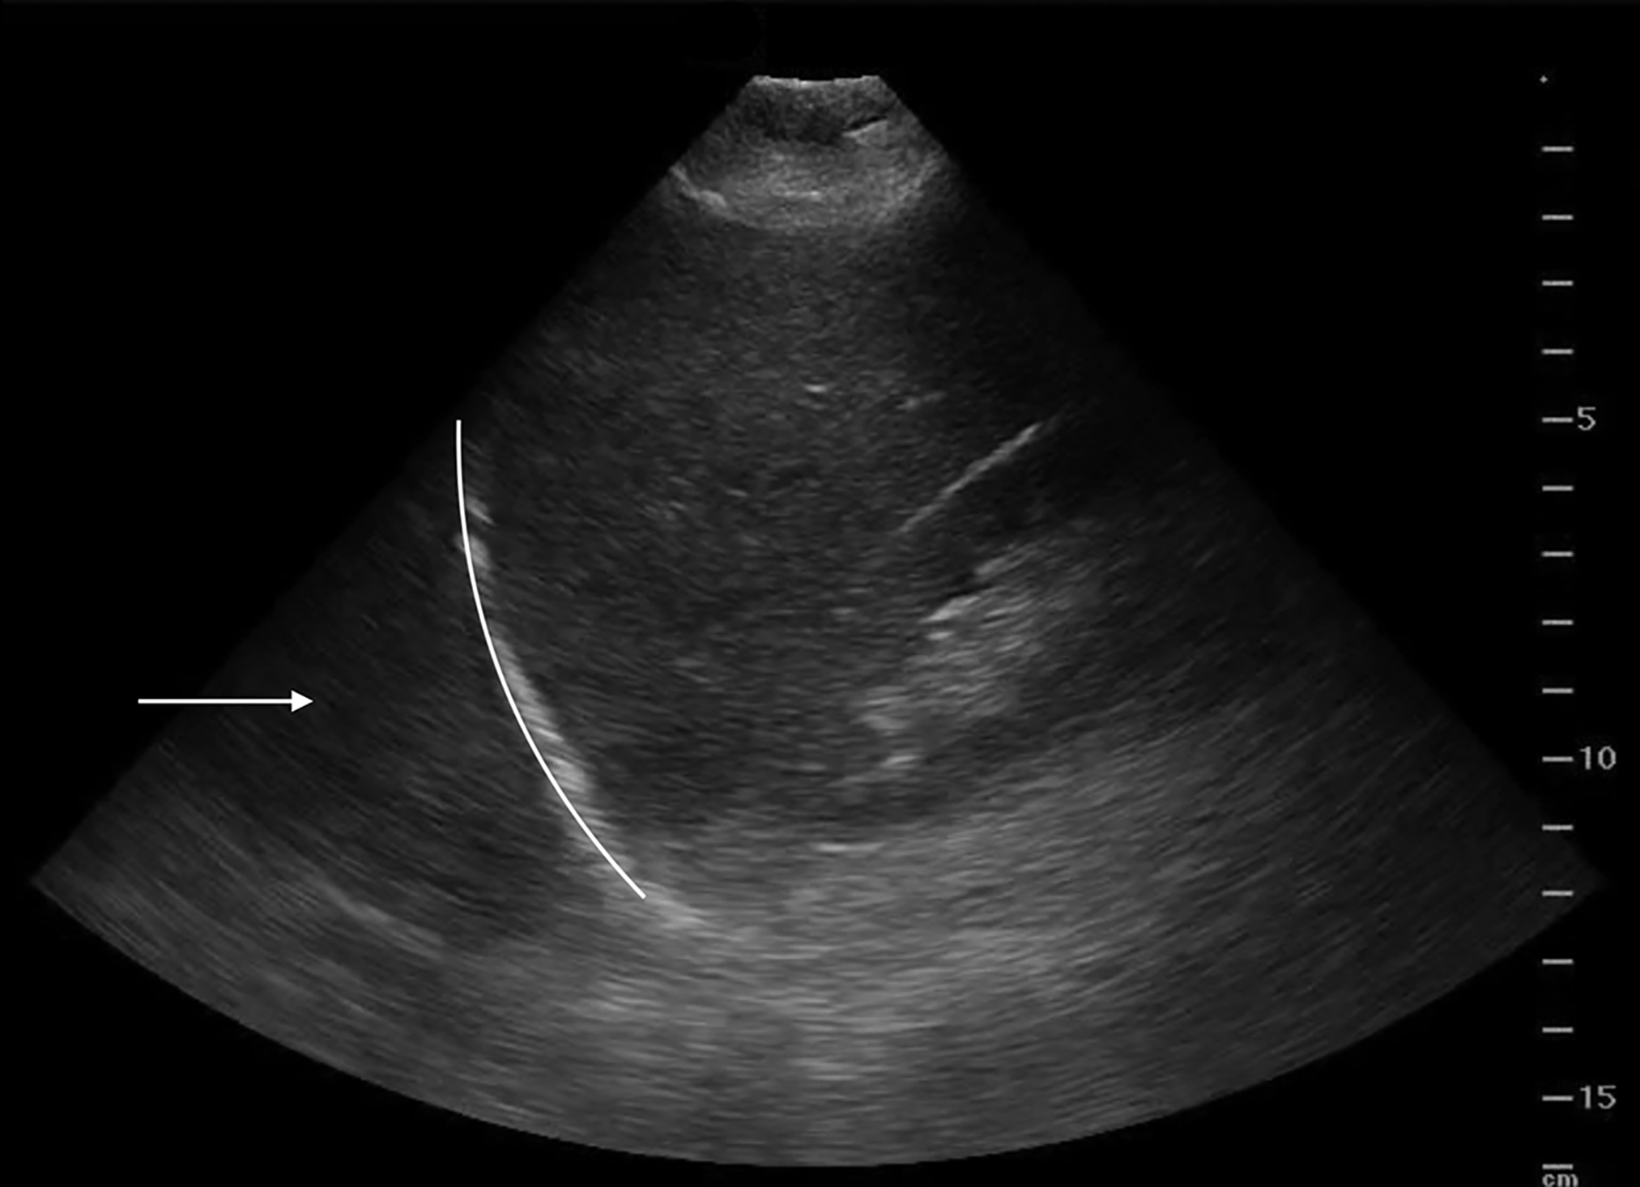
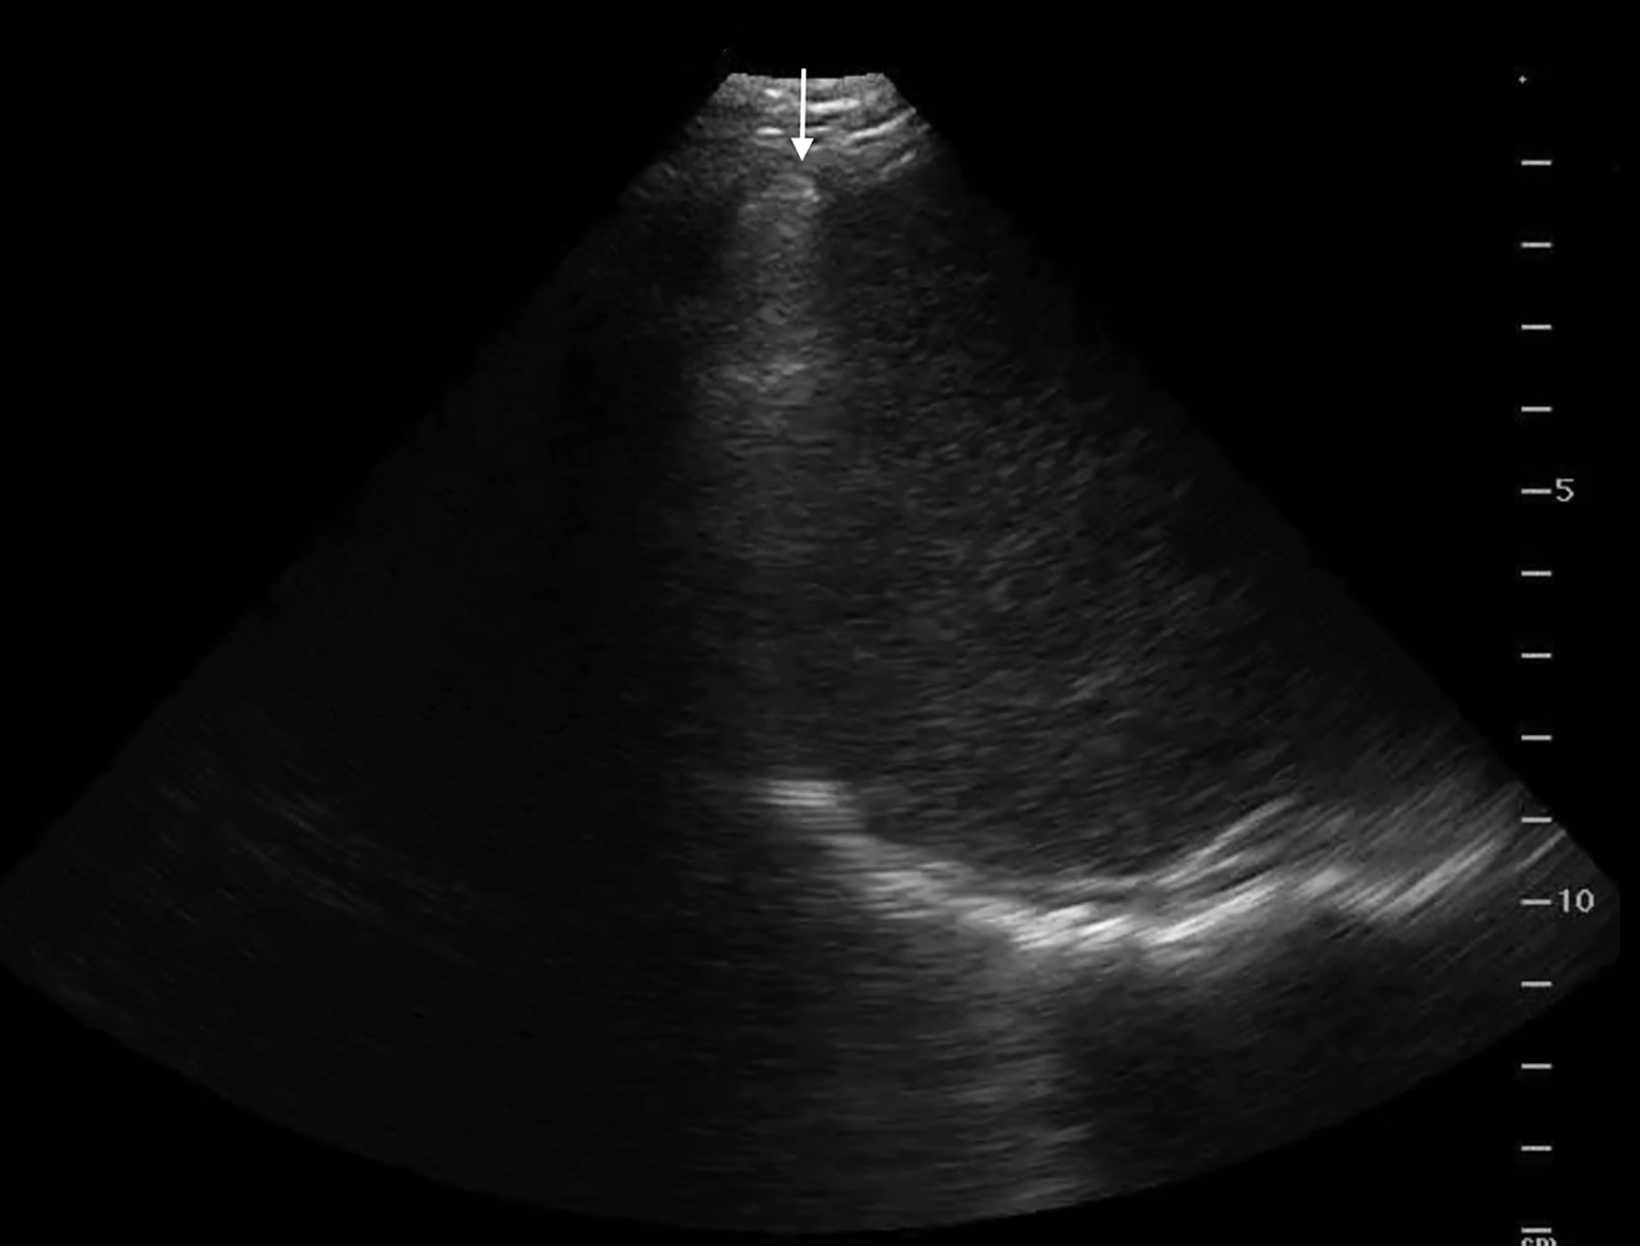
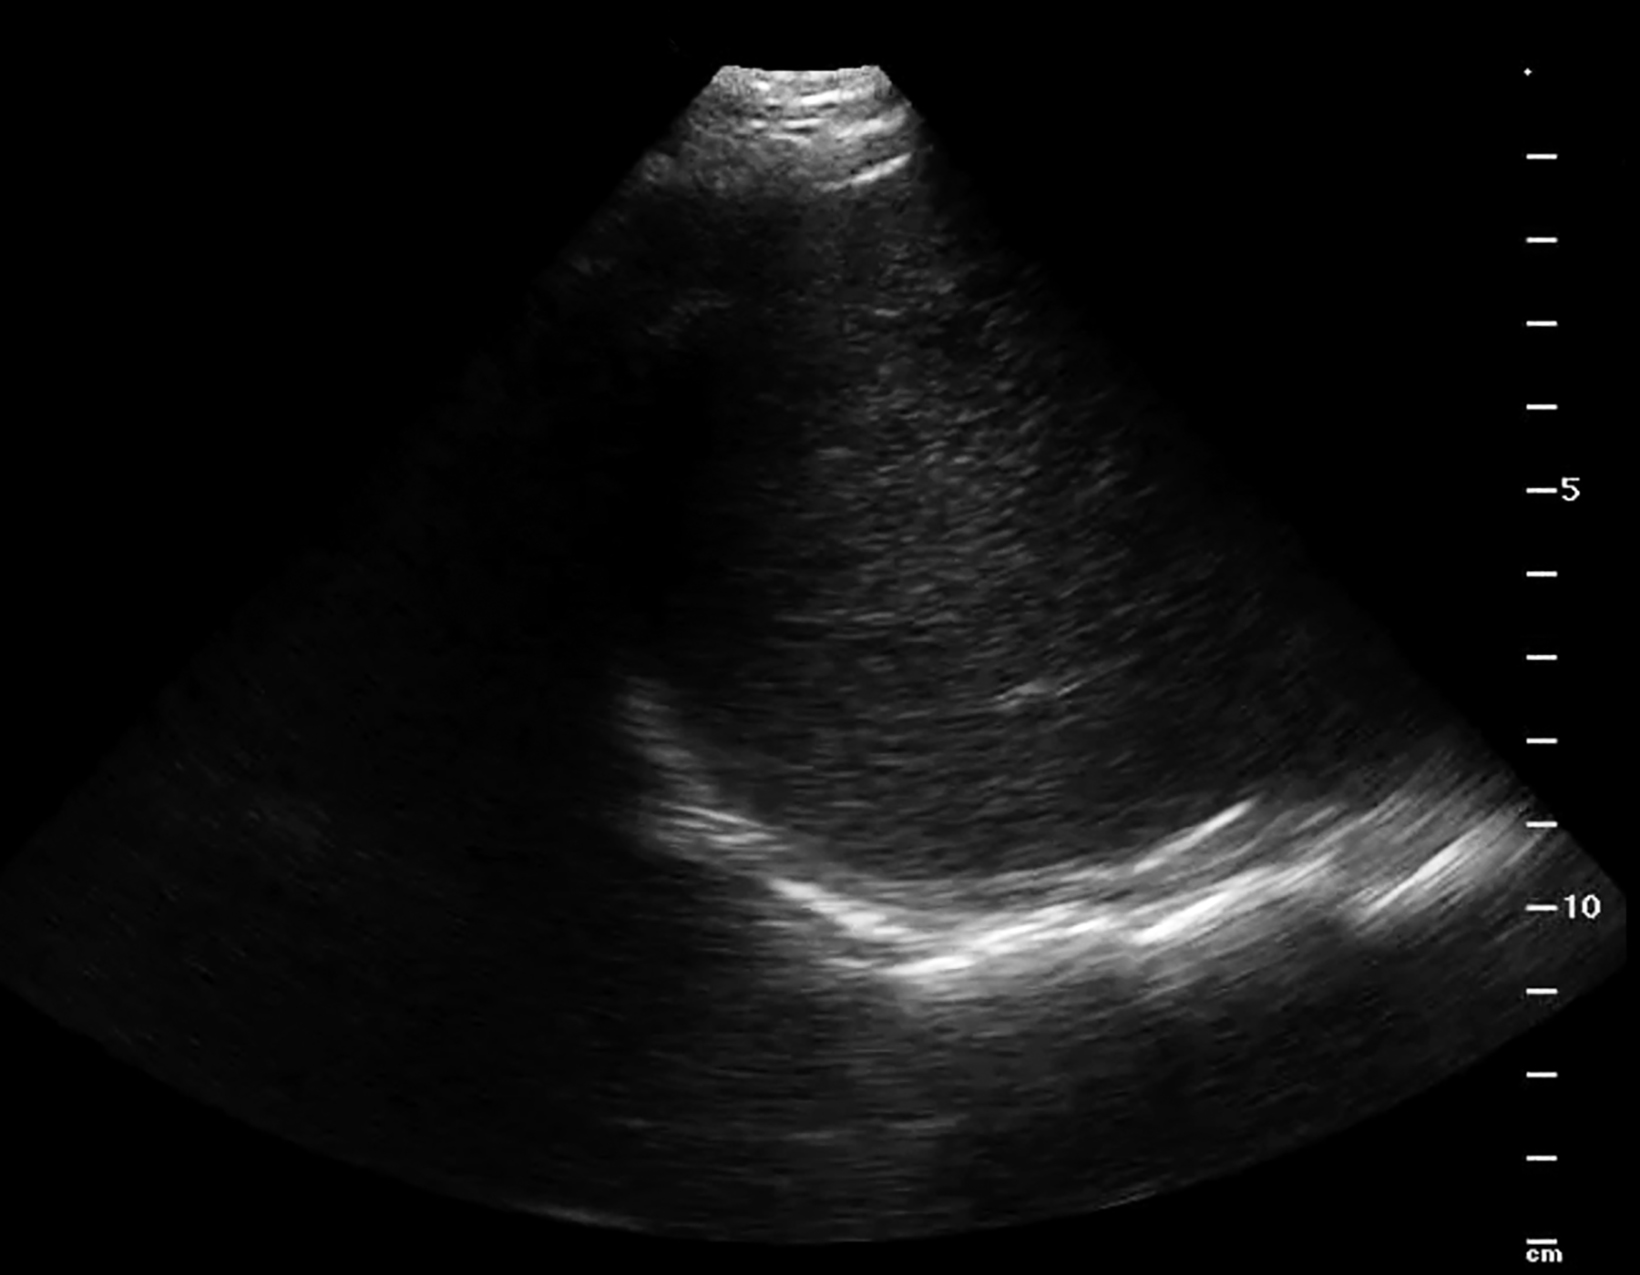
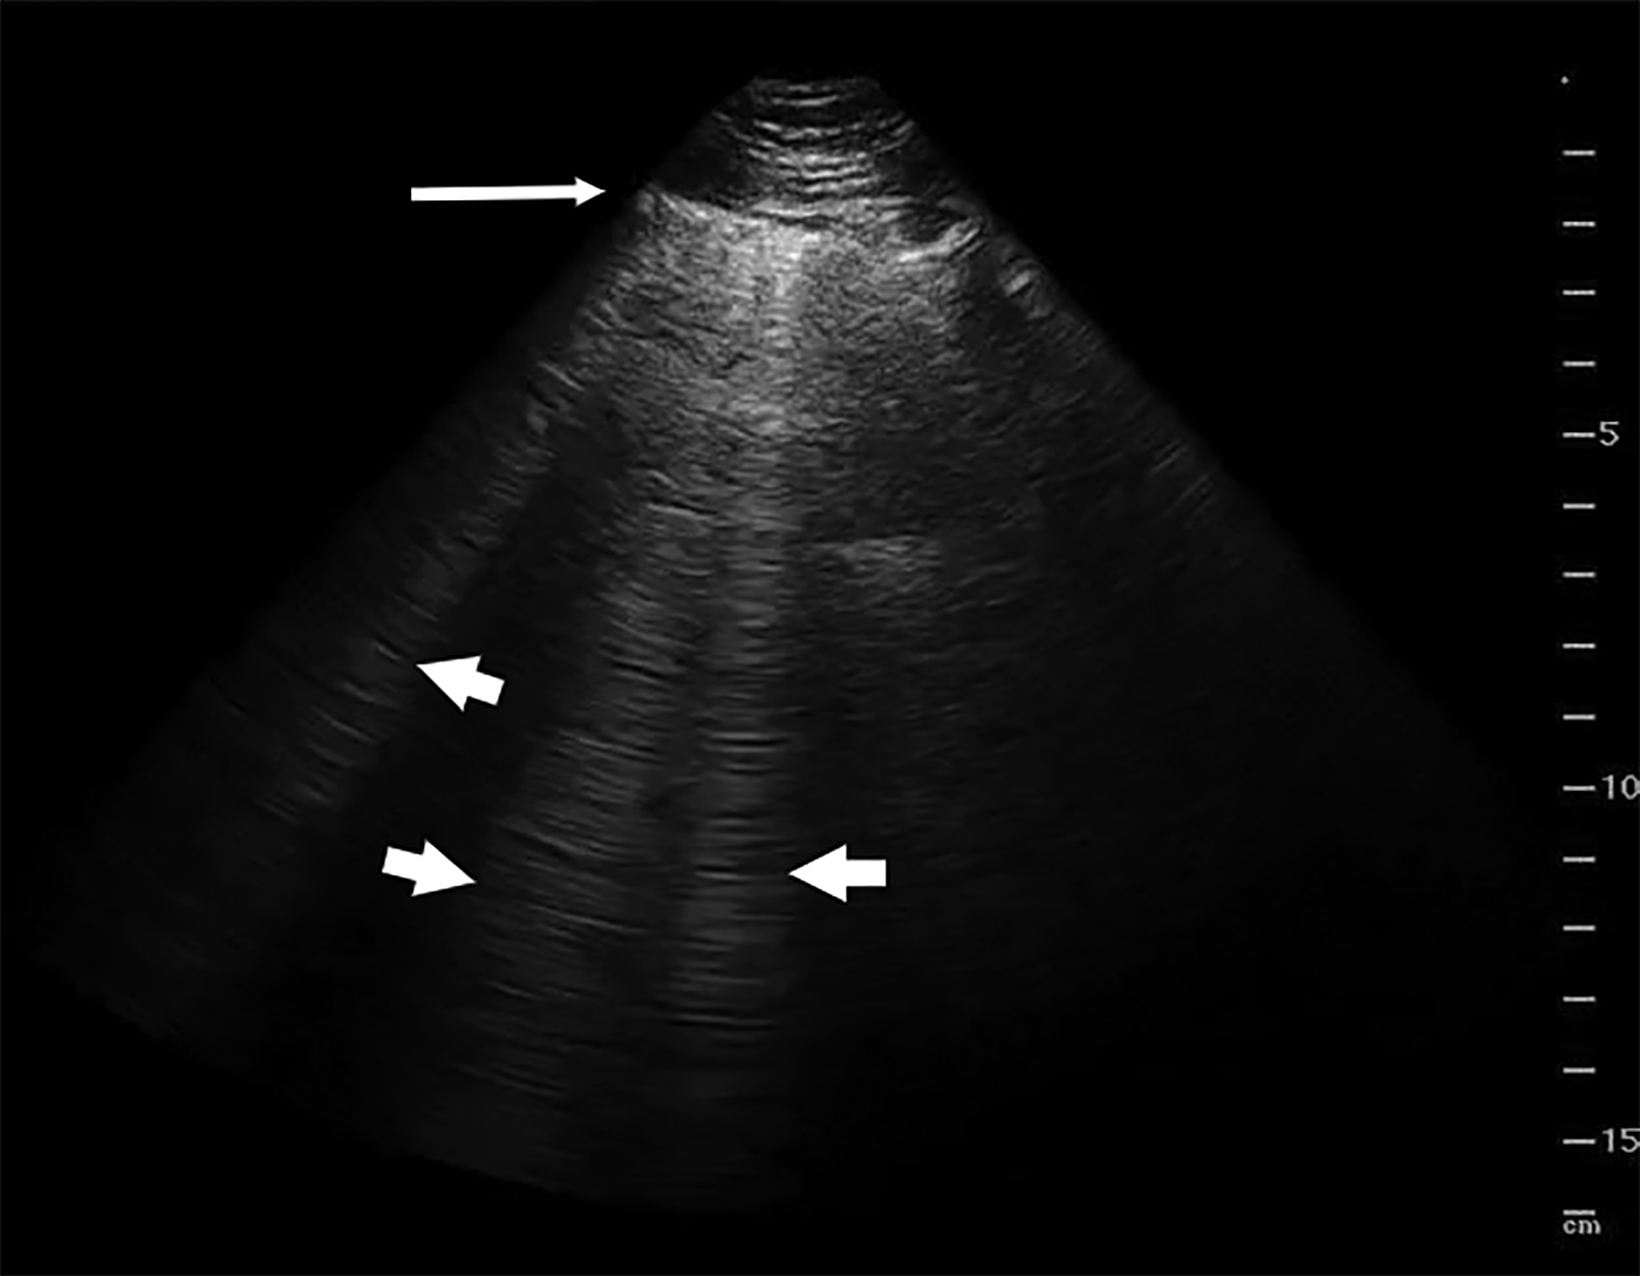
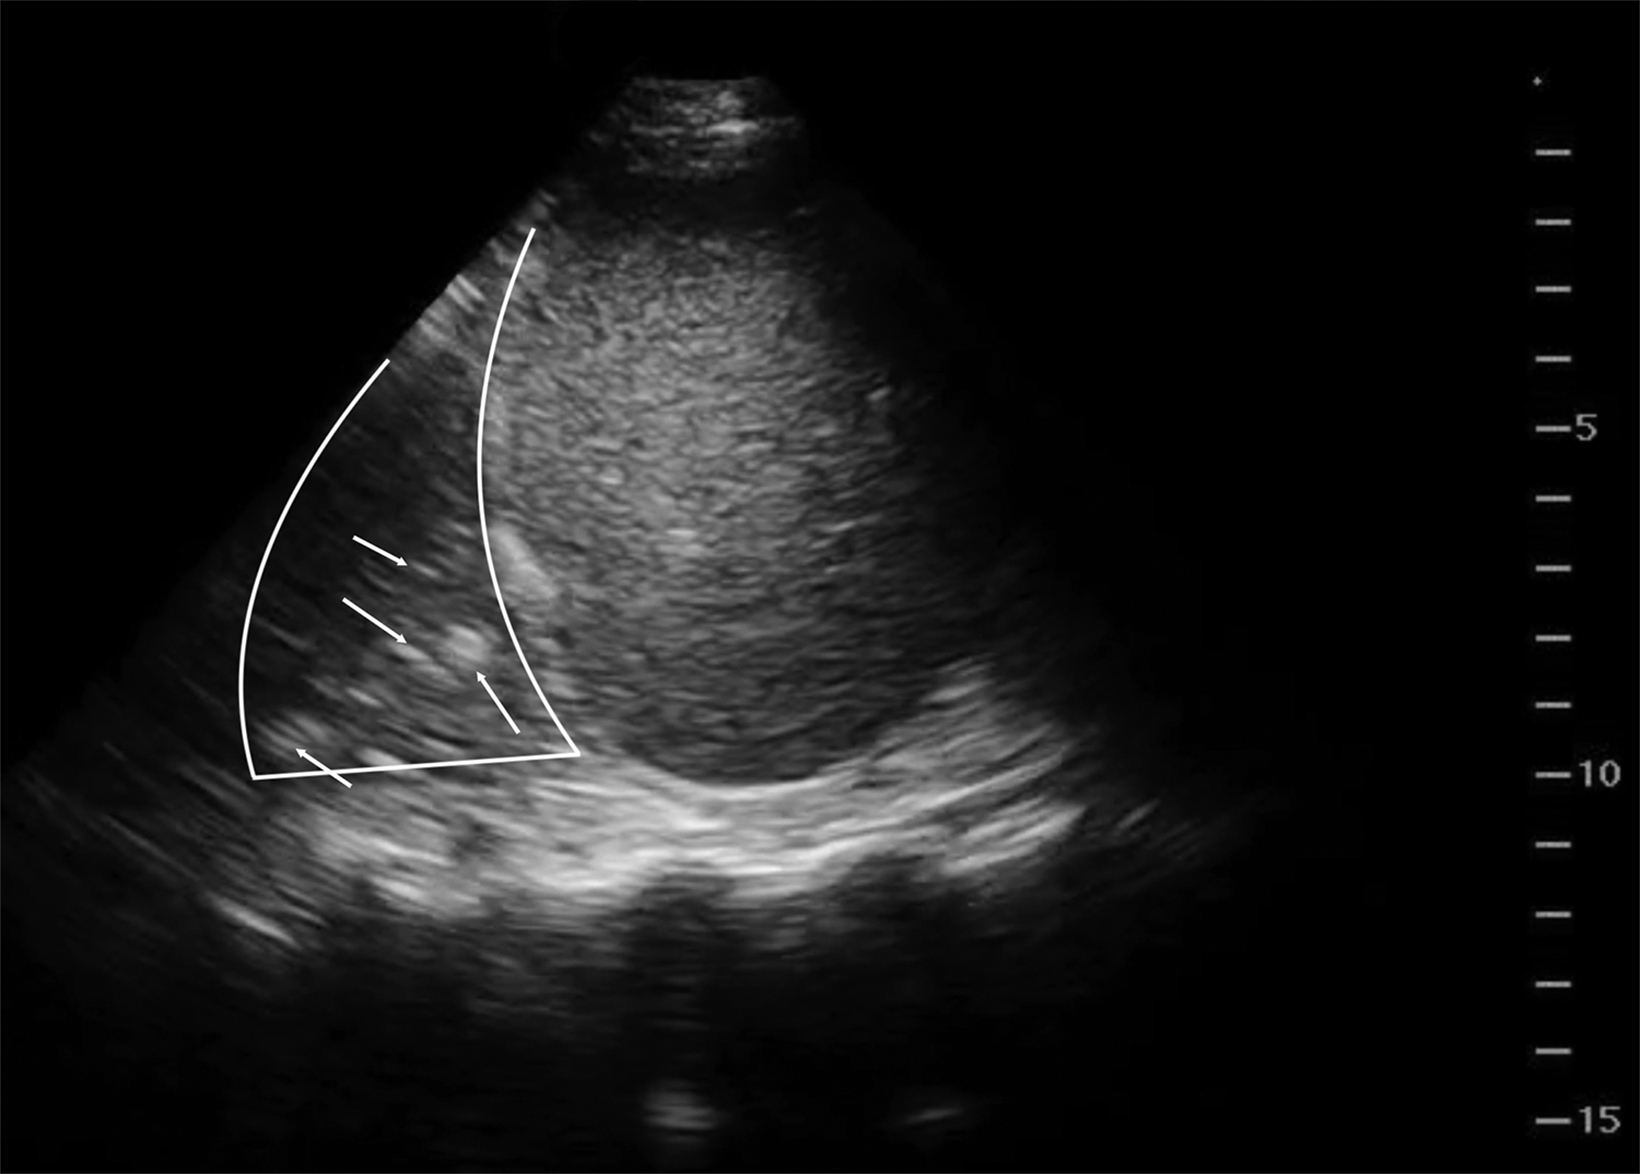
Lung ultrasound relies on the sonographer’s ability to identify the presence or absence of true structures and artifacts. Fully aerated lung scatters ultrasound waves, preventing visualization of the parenchyma and instead creating an artifactual representation.9 One artifactual pattern of normal tissue is mirror image artifact, which occurs when a false image of the liver or spleen superior to the diaphragm is created by the subdiaphragmatic ultrasound beam hitting a highly reflective curvilinear border, in this case the diaphragm (Figure 3).10 The “curtain sign” is another helpful artifact that distinguishes the inferior border of well-aerated lung from the costophrenic recess. As it moves inferiorly during inspiration, the aerated lung covers the liver and spleen like a window curtain, preventing visualization of deeper abdominal structures (Figure 4). These normal lung artifacts are further explained in Table 1.
Lung Ultrasound in Medical Pathology
Although disease processes can overlap, the combination of the distribution and pattern of ultrasound findings, along with the clinical context, can help to diagnose specific pathologies.11 Table 2 highlights pathologic findings used to build the signature of a disease process.
B-Line Normal and Abnormal
B-lines are vertical, hyperechoic lines that begin at the pleural line, extend to the depth of the image, and move with lung sliding. They are hyperechoic artifacts that have been described as “comet tails” or “spotlights in the fog.” The B-lines erase the A-lines and run from the top to the bottom of the screen. (Figure 5) Occasionally, thin B-lines can be identified in normal lung, especially in the bases.12 However, the presence of multiple B-lines (more than three between two ribs in a single image) in two or more lung regions bilaterally defines interstitial syndrome. Interstitial syndrome describes heterogeneous clinical pathologies with similar ultrasound findings that are thought to have decreased air content and increasing lung density with a diffuse pattern of B-lines.11 Interstitial syndrome is not itself a sign of interstitial lung disease; instead, it has a much broader differential of pathological processes. Those associated with areas of multiple B-lines include pulmonary edema, interstitial pneumonia or pneumonitis, and diffuse parenchymal lung disease such as pulmonary fibrosis.13 B-lines can be found focally (therefore not meeting the criteria for interstitial syndrome) in pneumonia, atelectasis, pulmonary contusion, pulmonary infarction and neoplasia, so care should be taken to identify the distribution of these B-lines within the thorax.
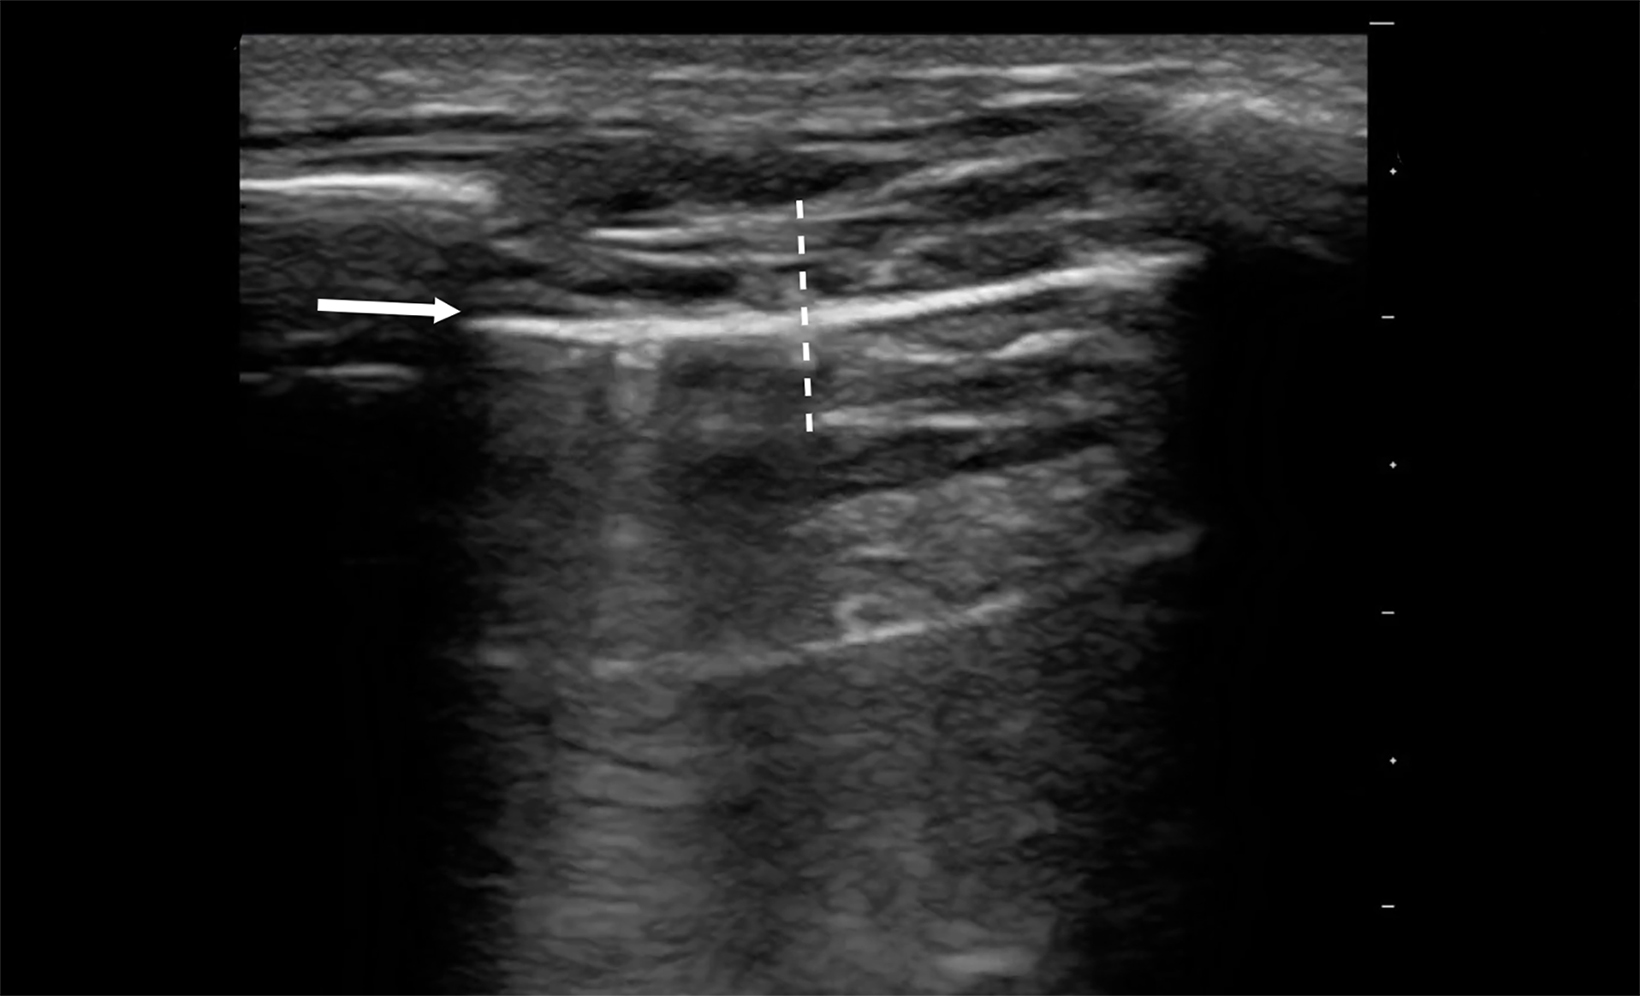
In general, the distribution of B-lines, effects on the pleural line, and concomitant ultrasound findings such as echo and inferior vena cava evaluation can help differentiate these diseases. Although significant overlap exists between interstitial processes, cardiogenic pulmonary edema (CPE) and noncardiogenic interstitial syndrome (NCIS) can be differentiated. One consistent characteristic of CPE is a normal, thin pleural line, whereas a thickened pleural line is more characteristic of NCIS (>0.2-0.5mm, Figure 6).14,15 Additionally, hypoechoic, subpleural, and echo-poor areas that move with the lung are consistent with consolidation and much less likely with CPE. Their presence would, therefore, build a case for an alternative cause of interstitial syndrome (Figure 7).13,14 Table 3 describes typical LUS findings of common causes of interstitial processes and should help to refine the differential diagnosis of an interstitial syndrome.
Pneumonia
Lung ultrasound has been shown to have improved sensitivity compared to x-ray in the detection of pneumonia.16,17 Focal pneumonia may appear with various findings.
As discussed previously, the appearance of B-lines in particular areas compared to their absence in others can suggest infection. A patient with a diffuse, multifocal pneumonia may have more persistent B-lines throughout multiple areas of the lung.17 As these areas become progressively less aerated, the B-lines tend progressively worsen.
As lung aeration declines, the number of B-lines will increase and they will coalesce into thick bands that ultimately take up the entire intercostal space, a condition referred to as “white lung” (Figure 8).18,19
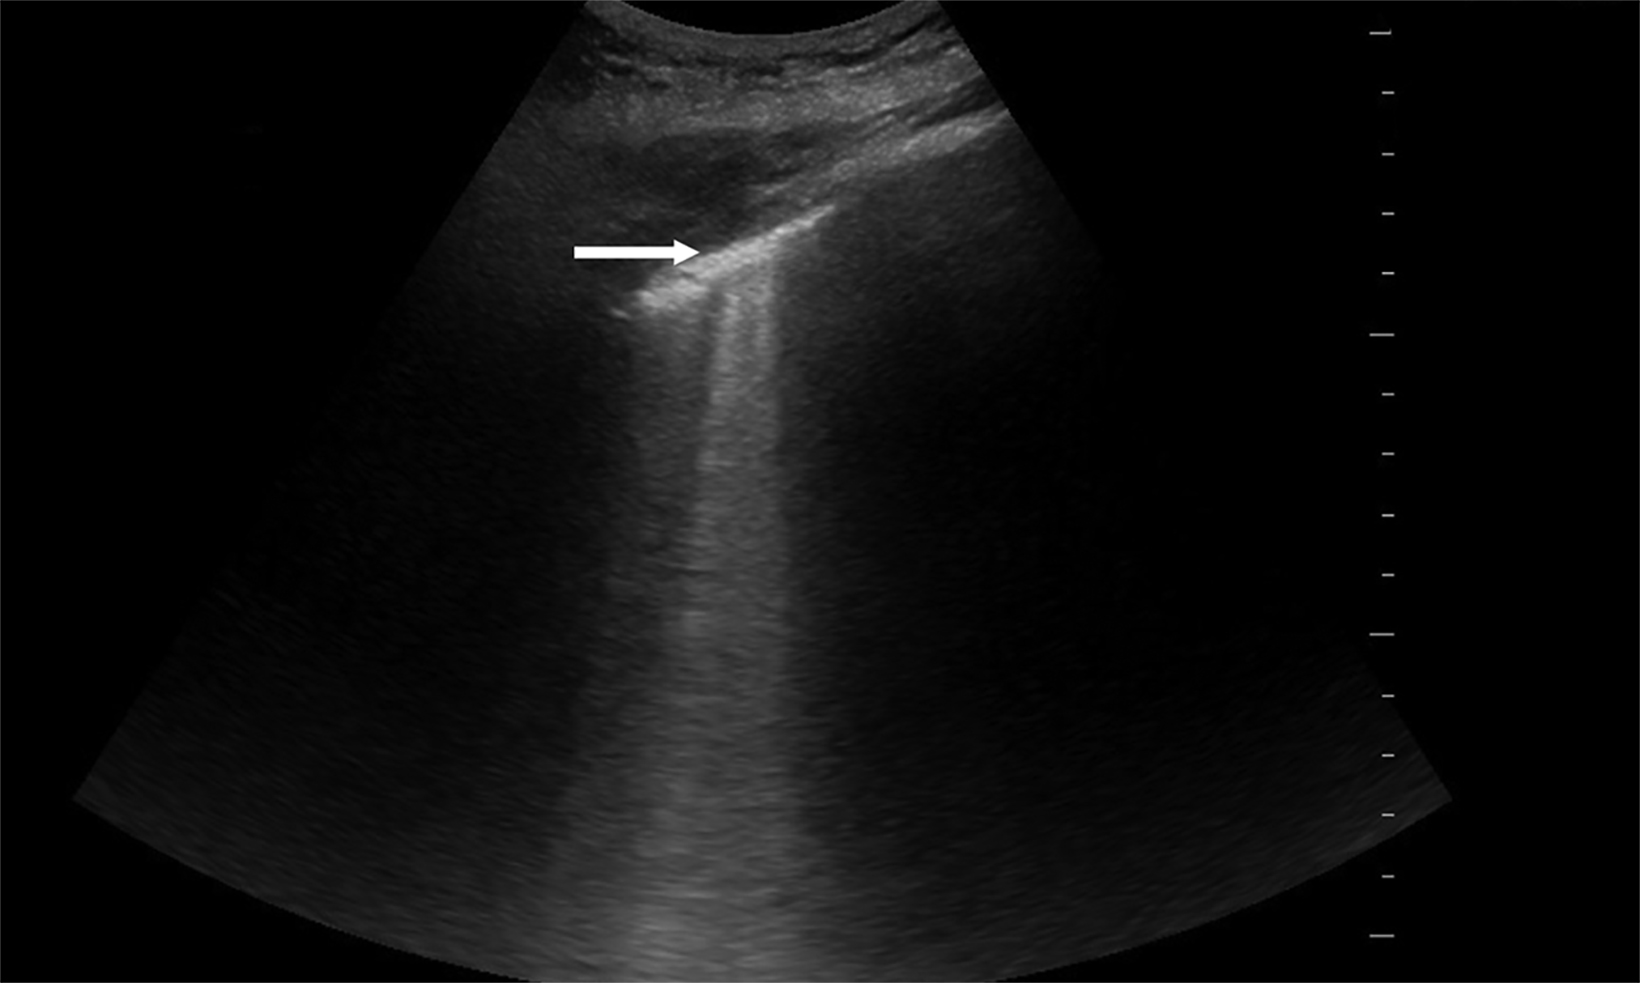
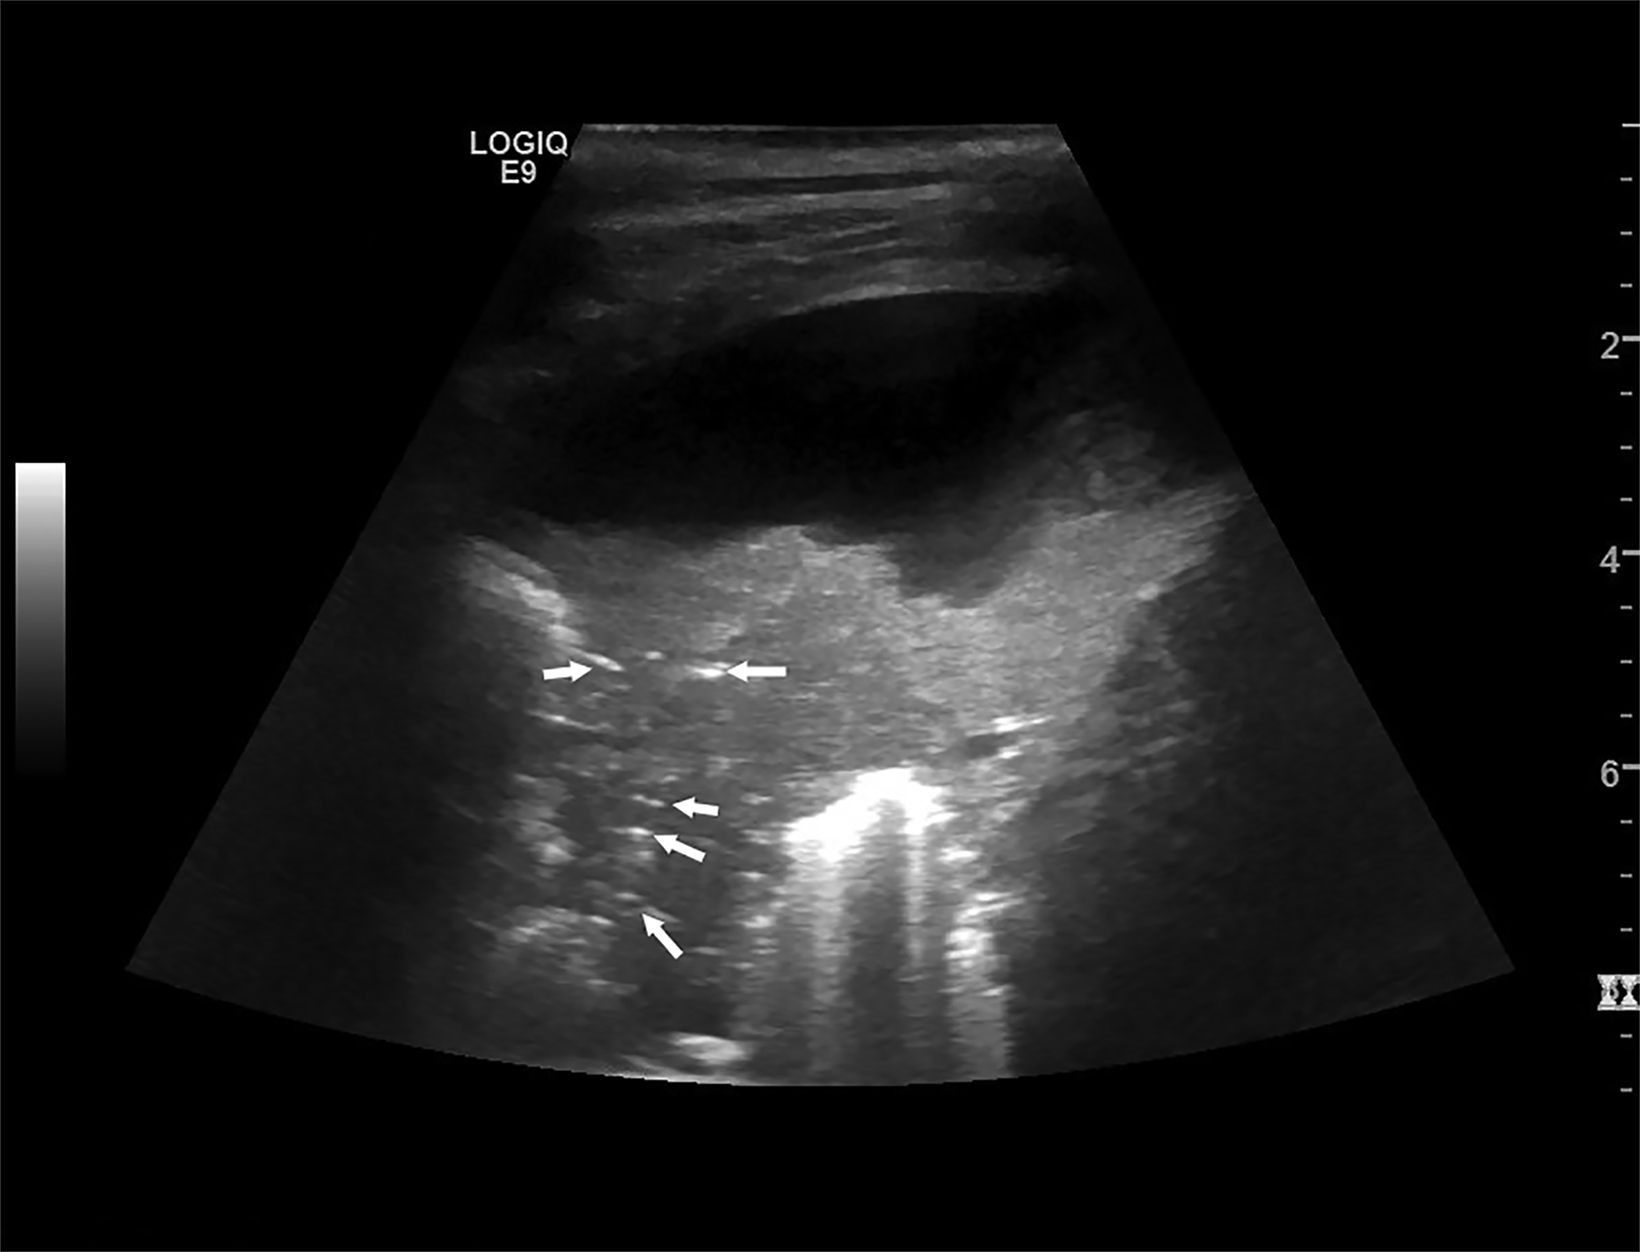
Finally, when aeration is at its lowest, B-line artifact is replaced by a real image of lung consolidation. Consolidated lung may sometimes appear as dense tissue similar to liver tissue in echogenicity. This is known as hepatization of the lung (Figure 9) and can signify consolidation in areas where infection is present.20 Sonographic air bronchograms may also be visualized in consolidated lung; these appear as hyperechoic tubular structures within lung tissue (Figure 10).
COVID-19 Pneumonia
Since the COVID-19 pandemic, LUS has been a useful bedside tool for assessing viral pneumonia caused by the SARS-CoV-2 virus.
It is able to identify the pattern consistent with COVID pneumonia, to correlate uncommon findings with disease severity, and to identify signs of recovery.21,22 A recent meta-analysis found that LUS had a sensitivity of 87% and a specificity of 69.5% for COVID pneumonia.23
The ultrasound findings of COVID-19 reflect the continuum of severity — the more severe the findings, the more severe the clinical condition.24-28 Several findings can help to make the diagnosis as well as gauge pneumonia severity. First, the pleural line is assessed for thickening which may be interrupted or discontinuous. Second, B-lines are assessed on a continuum ranging from well-defined, discrete B-lines through dense coalescence, or “white lung.” Third, B-line distribution can vary from focal or multifocal to confluent patterns across the chest wall.
Finally, small subpleural through larger lobar or translobar consolidations can be seen as disease severity increases.21,24 Given the extent and breadth of findings, many studies have proposed a 12-zone protocol (anterior, lateral, and posterior regions, each divided bilaterally into superior and inferior fields), with an associated scoring system describing the extent of disease. Each portion of the lung is scored progressively based on the artifact pattern; from an A-line predominant pattern to worsening B-lines to consolidation, each pattern receives progressively more points.22,25-28 The scores are then added together to produce a lung ultrasound severity score or other similar quantified metric.26,29 Some scoring systems include the pleural line findings that are independently correlated with severe COVID-19 disease.24,27
Clinically, high scores have been associated with low partial-pressure-of oxygen to fraction-of- inspiratory-oxygen concentration (PaO2/FiO2) ratios, adverse clinical events, incidence of acute respiratory distress syndrome (ARDS), intensive care unit (ICU) length of stay, and even mortality.25-27 Interestingly, pleural effusions are rare in COVID-19 pneumonia and portend poor prognosis when present.24,28
Pneumothorax
Lung ultrasound has transformed pneumothorax evaluation in critically ill patients who are too unstable to be transported for advanced imaging and in those with trauma or undergoing procedures.7,9,30-36 Its utility has been shown in identifying, ruling out, and quantifying the relative size of pneumothorax, as well as in identifying pneumothoraces missed by chest X-ray.34-36
Evaluating pneumothorax with ultrasound requires the absence of lung sliding. In the presence of pneumothorax, A-lines still emanate from the parietal pleura, requiring careful evaluation. Using a high frequency linear probe can increase accuracy.37
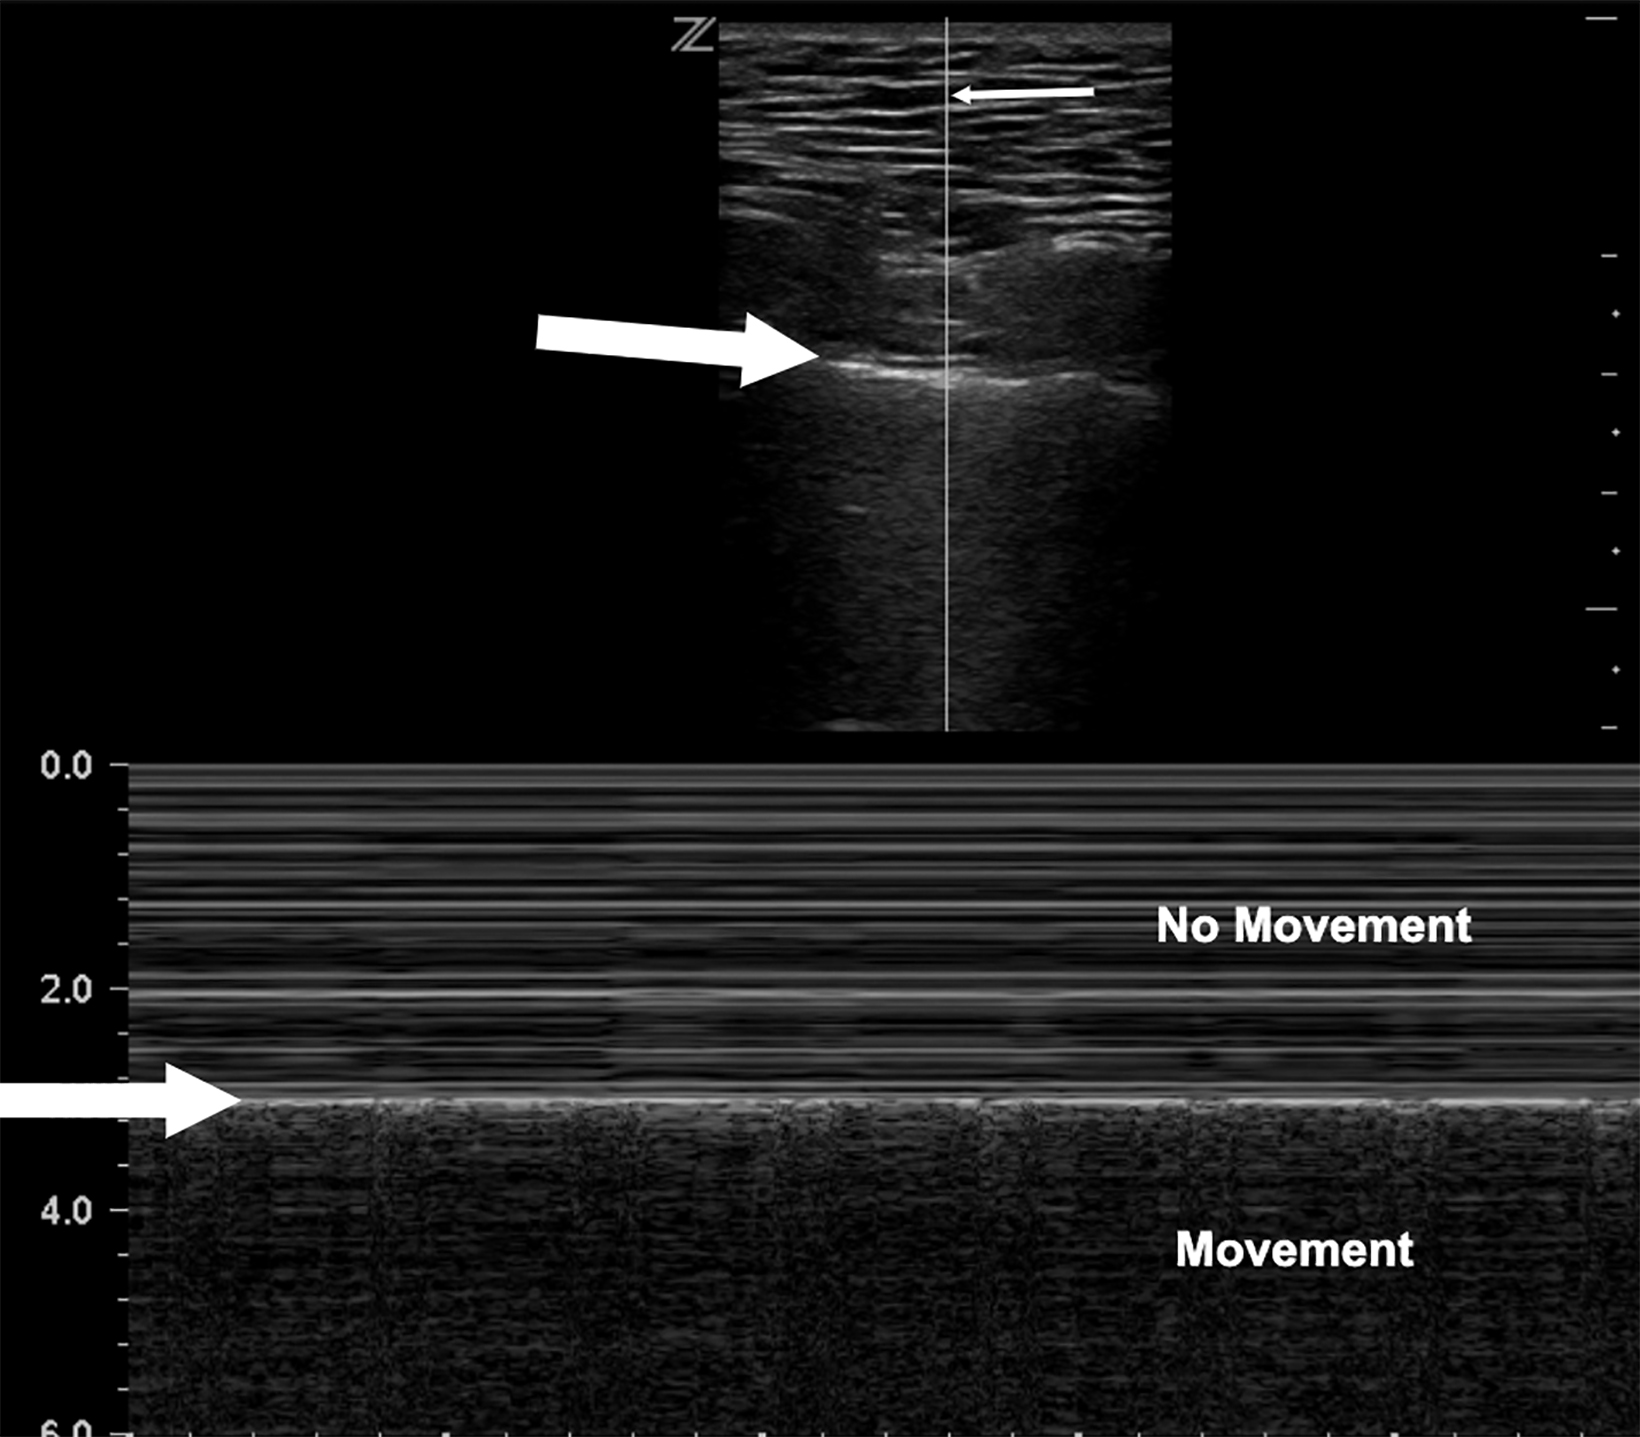
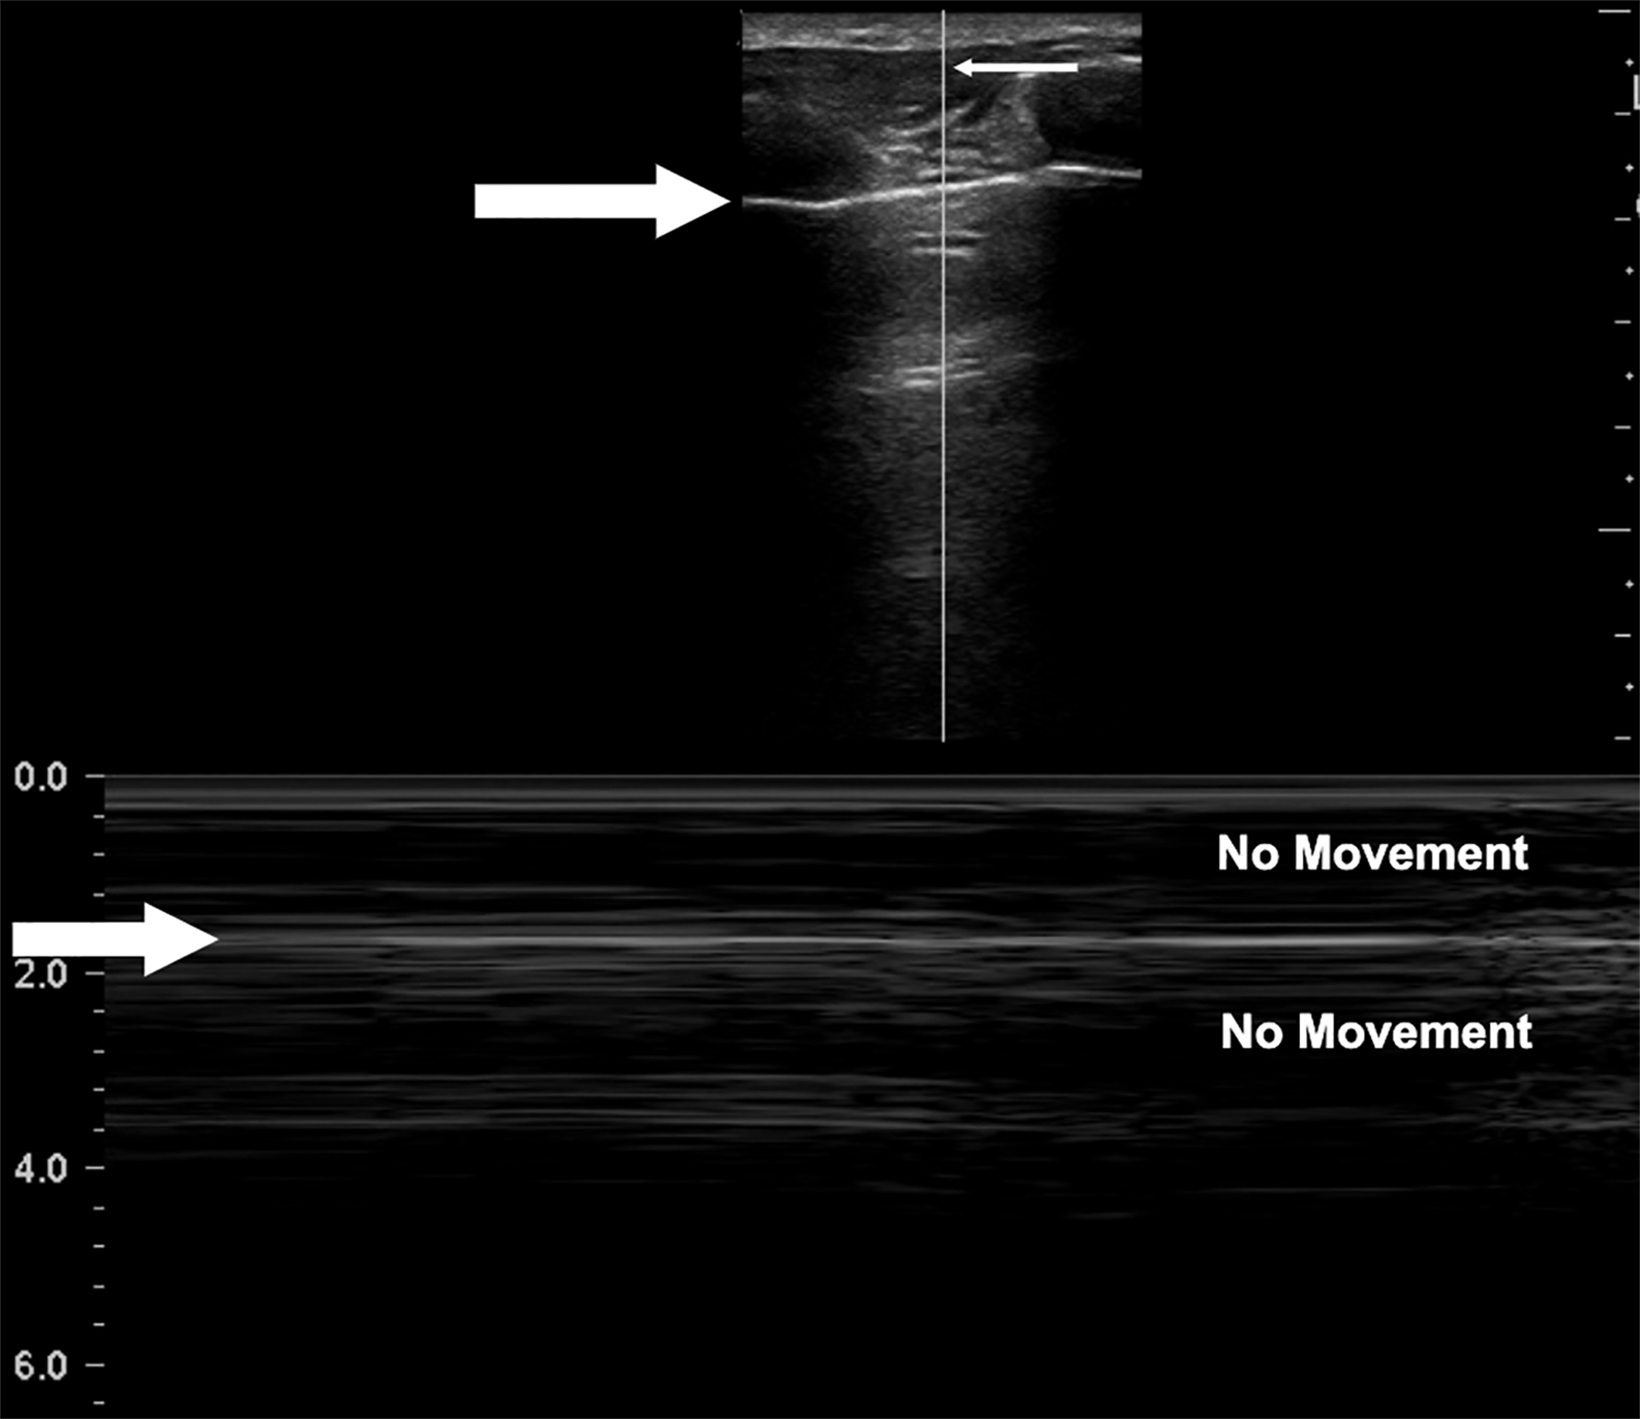
M-mode has also been found to help distinguish normal lung slide from pneumothorax. With M-mode, one vertical segment of the B-mode image is mapped to create a tracing of the segment along the y-axis and its changes across time along the x-axis. When lung sliding is present, the most superficial portion of this graph, representing the skin and subcutaneous tissue, will remain still across time, leading to static, horizontal lines superficial to the pleura while showing persistent movement below the pleura. The appearance has been likened to the static from poor signals on old television screen.
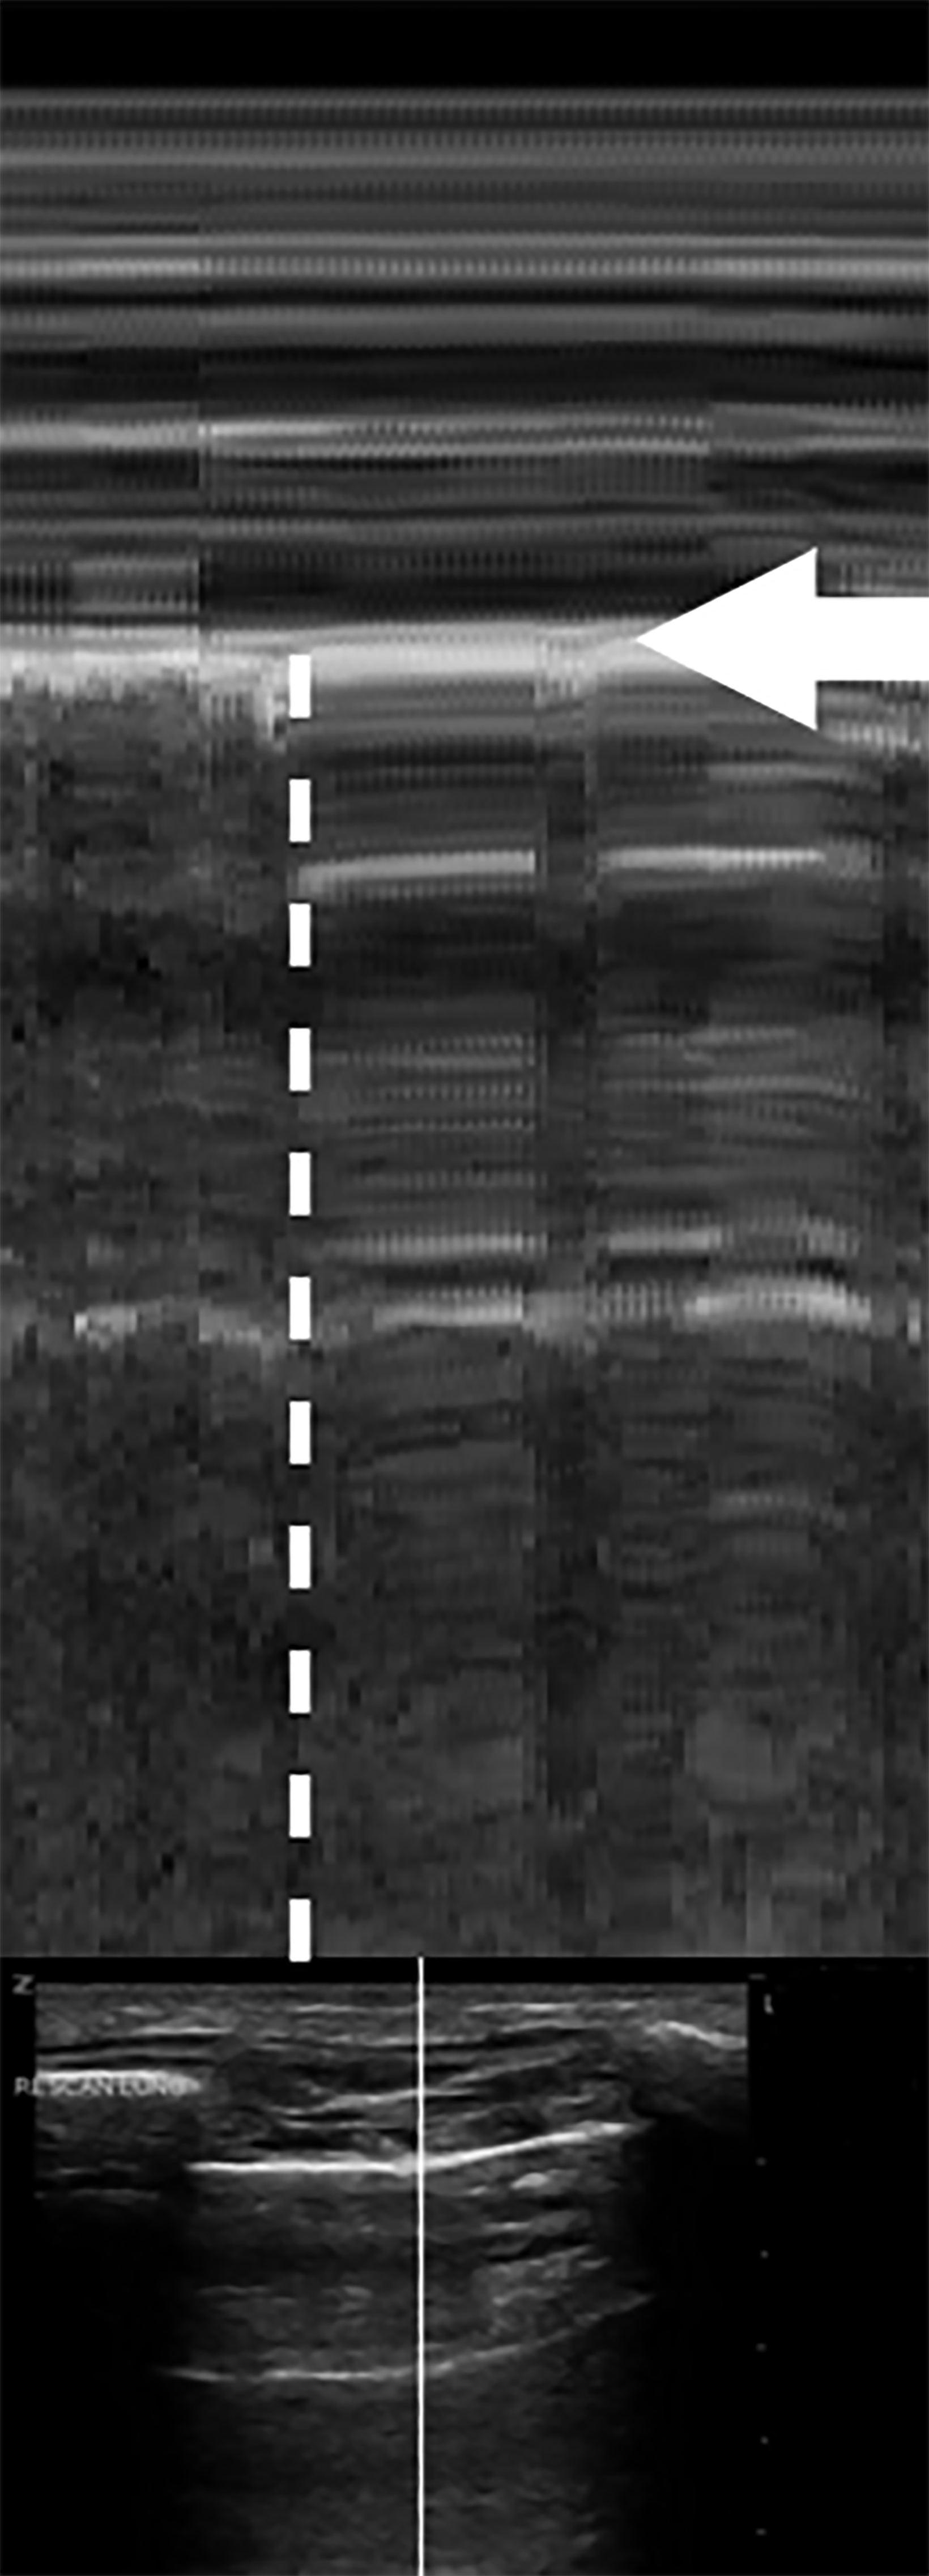
The movement below the pleural line with no movement above the line is called the “seashore sign,” and represents normal lung slide (Figure 11). Conversely, in the absence of lung slide M-mode will display horizontal lines both above and below the pleural line. This is called the “stratosphere” or “bar code” sign (Figure 12).33 These findings get their names from the horizontal lines seen both above and below the pleural line that make the M-mode image appear as layers of the stratosphere or a bar code. A lack of lung slide can be consistent with pneumothorax, but it may also be consistent with other circumstances in which the lung is not moving; these include breath holding, mainstem intubation, diaphragmatic paralysis, and non-ventilation of the side being evaluated.
The presence of a lung point has shown high specificity for pneumothorax.33 This finding is the point at which the visceral and parietal pleura no longer appose one another. This alternating pattern of lung slide/no lung slide occurs in the same interspace delineating the border of the pneumothorax (Figure 13, online video).33,38 This can also be observed on M-mode where, within the same intercostal space, the seashore and stratosphere signs are intermittently present, revealing the point at which the visceral and parietal surfaces diverge, confirming a pneumothorax.39 A false lung point may occur when evaluating peridiaphragmatic portions of the lung, as temporary visualization into abdominal structures may falsely cause similar findings.40
As noted previously, lung sliding may not be present without a pneumothorax in certain situations, such as atelectasis, ARDS, right mainstem intubation, among others (false positives). If B-lines or a lung pulse are present, no pneumothorax exists at this level. A lung pulse is a vertical pulsation of the pleural line in concordance with the heartbeat that excludes pneumothorax at a given location in the intercostal space; both findings require the pleura to be in contact with each other (online video).20,31
Pleural Effusion
Pleural effusion was one of the first pathologies studied for the utilization of LUS.4 In one study of intensive care patients, LUS showed a sensitivity and specificity of 100% for pleural effusion.41 Proper assessment of pleural fluid, particularly in the aerated lung, can help guide safe thoracentesis and reduce the risk of pneumothorax and other complications.42
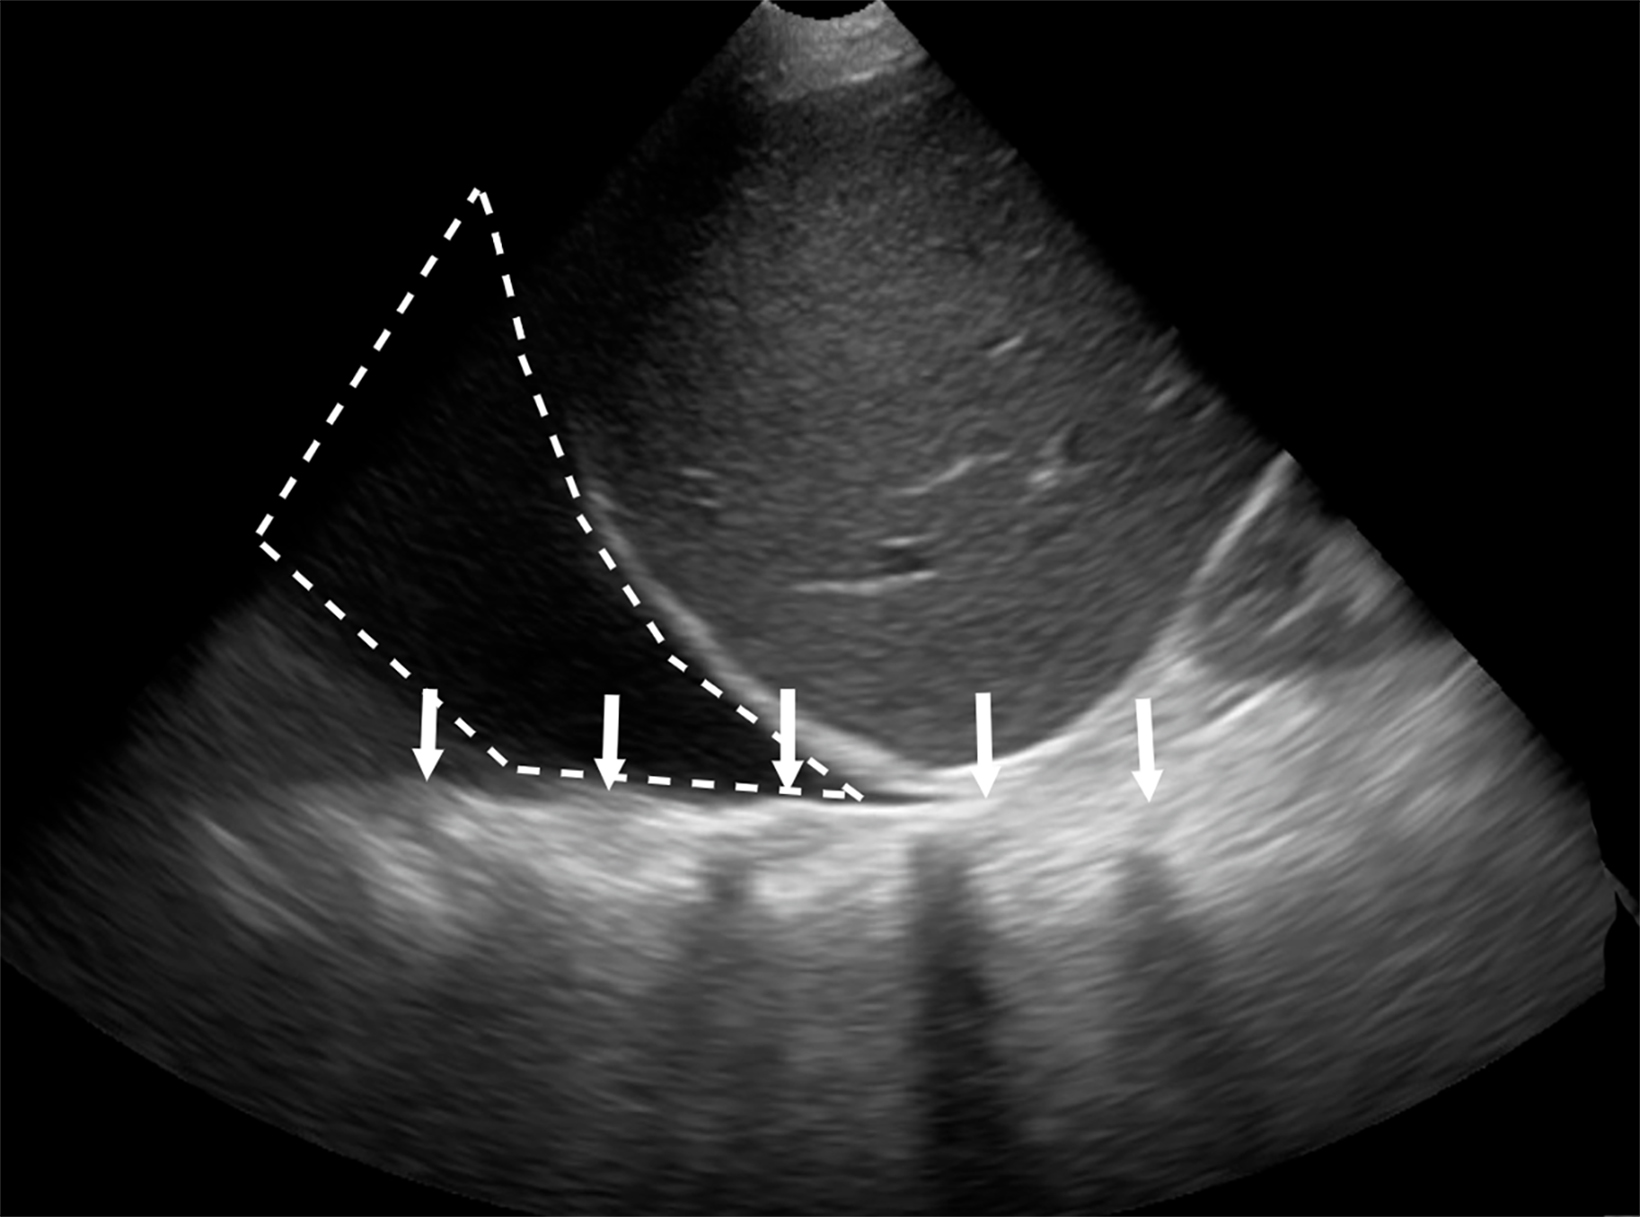
Pleural effusions are characteristically dependent fluid between the visceral and parietal pleura superior to the diaphragm.43 Simple effusions are anechoic and take the shape of their surrounding borders, typically the chest wall, lung surface. and the diaphragm. They are best visualized in intercostal spaces on dependent chest wall. The probe often will be placed in the superior abdomen, just inferior to the diaphragm and angling superiorly into the chest. Typically, sound waves through normal lung are scattered, owing to high acoustic impedance that obscures the spine superior to the diaphragm. However, if there is fluid or lung with high water content occupies the costophrenic recess (such as in the settings of pleural effusion or hemothorax), the sound waves will propagate to the spine. The spine will then be visualized superior to the diaphragm, a condition referred to as the “spine sign” (Figure 14).44-46 In the setting of trauma, fluid in the lung in the costophrenic recess of a supine patient supports the presence of blood. When clotted blood or exudative material is seen in the hemithorax, anechoic fluid will often have debris seen as hyperechoic particles floating in the fluid. This is referred to as the “plankton sign” (Figure 15).47
Conclusion
Lung ultrasound has become useful in bedside imaging across a variety of specialties. Its strengths have been documented through decades of research, and it has proven to be especially effective in diagnosing and assessing lung pathology. This practical review can serve as a quick reference to the ultrasound findings that can be used to identify pathology, to guide procedures, and to change patient management.
Supplemental Videos
Links to videos corresponding to many of the images in this article:
- Figure 1. Normal Lung Sliding
- Figure 2. Normal Lung Sliding A-lines
- Figure 3. Mirror Artifact
- Figure 4. Curtain Sign
- Figure 5. B-lines Thin
- Figure 6. B-lines Thickened
- Figure 7. B-lines Consolidations
- Figure 8. B-lines White Lung
- Figure 9. Hepatization
- Figure 13. Lung Point Pneumothorax
- Figure 14. Pleural Effusion Spine
- Figure 15. Pleural Effusion Large Plankton Sign
- Lung Point Pneumothorax
- Lung Pulse
- A-lines Rib Shadows
References
Citation
SJ T, J L, JP M. Lung Ultrasound: A Practical Review for Radiologists. Appl Radiol. 2023;(3):8-19.
May 5, 2023