Body Composition Changes from Semaglutide Use Detected with CT-Based AI Tool
Images
Automated CT-based AI tools provide biomarkers of body composition changes in patients treated with semaglutides Ozempic, Wegovy, and Rybelsus—beyond what is evident by standard clinical measures, according to an accepted manuscript published in the American Journal of Roentgenology (AJR).
“Patients using semaglutides, or glucagon-like peptide-1 (GLP-1) agonists, who lost versus gained weight demonstrated distinct patterns of changes in CT-based body composition measures,” wrote corresponding author and former ARRS Scholar Perry Pickhardt, MD, from the radiology department at the University of Wisconsin School of Medicine & Public Health in Madison.
“Those with weight loss exhibited overall favorable shifts in measures related to cardiometabolic risk,” Pickhardt added, also noting that decreased muscle attenuation in patients who gained weight was consistent with a decrease in muscle quality.
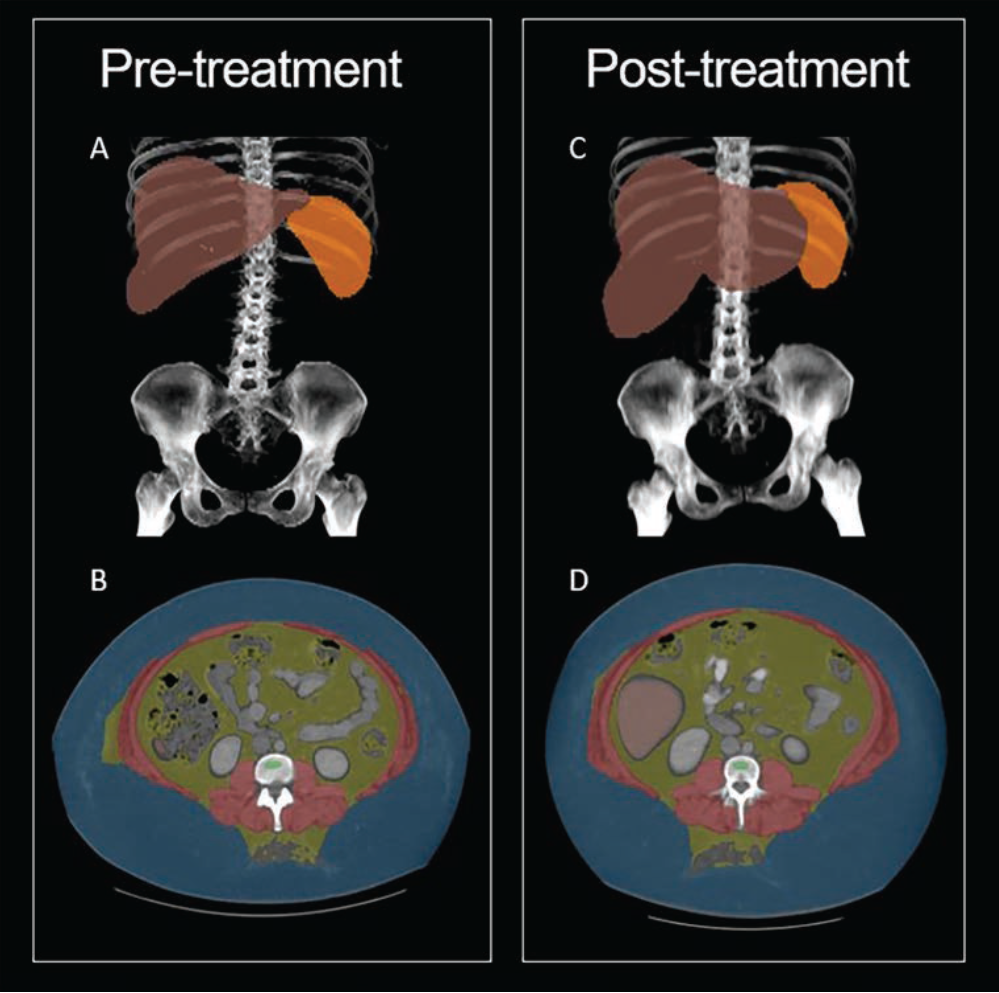
One of the first of its kind for radiology, Pickhardt et al.’s AJR study included 241 patients (mean age, 60.4 years; 151 women, 90 men) with semaglutide treatment who underwent abdominopelvic CT both within 5 years before and 5 years after semaglutide initiation (January 2016–November 2023). The researchers then applied an automated suite of previously validated CT-based AI body composition tools to pre-semaglutide and post-semaglutide scans to quantify visceral adipose tissue (VAT) and subcutaneous adipose tissue (SAT) area, skeletal muscle area and attenuation, intermuscular adipose tissue (IMAT) area, liver volume and attenuation, and trabecular bone mineral density (BMD). Pickhard’s team then compared patients with ≥ 5-kg weight loss and ≥ 5-kg weight gain between examinations.
Ultimately, in the patient cohort treated with semaglutides, those with weight loss exhibited decreases in VAT area, SAT area, muscle area, and liver volume, and increase in liver attenuation. Meanwhile, those with weight gain exhibited increase in VAT area, SAT area, muscle area, and IMAT area, as well as a decrease in muscle attenuation (all p < .05).