A Comparative Study of Renal Parenchymal Resistive Index, Ultrasonographic Grading of Renal Parenchymal Echogenicity, Kidney Length, and Estimated Glomerular Filtration Rate Among Chronic Kidney Disease Patients Undergoing Whole Abdominal Ultrasound at West Visayas State University Medical Center
Images


Abstract
Chronic kidney disease (CKD) is one of the leading causes of mortality in the Philippines. In a country with a poorly structured healthcare system, it is important to maximize available resources in the management of patients with this disease.
Ultrasound is the imaging modality of choice for screening and detection of kidney disease. Both morphologic (kidney length, renal parenchymal echogenicity grading) and hemodynamic (resistivity index) sonographic parameters are valuable in the assessment and determination of disease progression.
This is a prospective cross-sectional study correlating the ultrasonographic parameters (morphologic and hemodynamic) to the computed estimated glomerular filtration rate (eGFR) of CKD patients. A total of 42 subjects categorized as belonging to CKD grades 3 through 5 based on eGFR participated.
The study showed a significant correlation between renal parenchymal echogenicity and eGFR. In conclusion, the grading of renal parenchymal echogenicity is a useful parameter compared to the resistivity index and renal length in determining the renal status of CKD patients.
Key terms: chronic kidney disease, resistivity index, eGFR
Introduction
An estimated 1.2 million people worldwide died of chronic kidney disease (CKD) based on the 2017 Global Burden of Chronic Kidney Disease Study.1 The prevalence of CKD in Asian countries is reported to be among the highest in the world. As of 2016, it was one of the leading causes of death, according to The American Journal of Kidney Disease.2 In the Philippines, kidney diseases, especially end-stage renal disease (ESRD), are the seventh leading cause of death among Filipinos, according to the National Kidney and Transplant Institute.3 Chronic kidney disease poses a tremendous financial burden on patients in developing countries with poorly structured public healthcare systems, such as the Philippines.2
Adequate evaluation of renal diseases with readily available diagnostic tools is essential to decision making that could offer a more favorable outcome for the patient. Ultrasonography is becoming a first-line modality in suspected cases of renal disease and postintervention surveillance. Since ultrasonography is relatively affordable, does not require contrast media or expose patients to ionizing radiation, and is non-nephrotoxic, it has become the most useful tool in evaluating renal disease.4,5
Morphological changes in the renal parenchyma were indisputably found to correlate with renal disease thus, Doppler ultrasound has been incorporated in greyscale imaging and is used to calculate the resistive index (RI) flow parameter, which has been considered in numerous studies to be a promising tool in obtaining quantitative diagnostic and therapeutic insight into CKD.6
Research Question
The major question at the center of this study was: which sonographic parameter (resistivity index, renal parenchymal echogenicity grading, or kidney length) is most sensitive to and correlates well with declining eGFR levels in patients with chronic kidney disease undergoing whole abdominal ultrasound at West Visayas State University Medical Center (WVSUMC)?
Statement of the Problem
The estimated glomerular filtration rate is the most widely used indicator for renal disease. The “2002 National Kidney Foundation–Kidney Disease Outcomes Quality Initiative (NKF-KDOQI) Clinical Practice Guidelines for Chronic Kidney Disease: Evaluation, Classification, and Stratification,” and “The Kidney Disease: Improving Global Outcomes (KDIGO) 2012 Clinical Practice Guideline for the Evaluation and Management of Chronic Kidney Disease (CKD),” both define CKD as a decrease in eGFR (<60 ml/min/1.73 mm2). They also recommend the use of eGFR and creatinine in the initial assessment. However, the availability of eGFR reports may not be instantaneous in outpatient clinics. Some studies highlight common limitations that challenge the utility of eGFR in the diagnosis of CKD.7
Ultrasound has been used for decades to evaluate the degree of kidney disease using morphologic changes in the renal parenchyma. Recently, renal parenchymal resistive indices have been found to help assess CKD. A study by Heine et al in 2006 concluded that ultrasound intrarenal RI independently reflects local renal damage and systemic vascular disease.8
Kidney sonography at our institution does not involve resistive index determination despite the ease of acquisition of RI values. There appears to be an insufficient comparative study regarding which parameter—ultrasound grading of the renal parenchyma, parenchymal RI, or kidney length—best correlates with abnormal eGFR levels. Moreover, the correlation between the sonographic variables is not well-documented in our setting.
Although various studies have independently correlated each parameter to eGFR, how these variables compare with each other in evaluating CKD is not known. Thus, this study aimed to determine how well sonographic grading of renal parenchymal echogenicity, kidney size, and the resistive indices correlate with declining eGFR grades in these patients.
Significance of the Study
In clinical settings, no single diagnostic parameter is recommended for initial assessment of the patient’s condition. The KDOQI and KDIGO Guidelines define CKD based on structural abnormalities detected in imaging and decreased eGFR. Hence, this study seeks to correlate the sensitivity of ultrasound’s morphological and hemodynamic parameters to the eGFR. The acceptable correlation of the two will impact clinicians, sonographers, radiologists, and patients.
Imaging with qualitative and quantitative parameters for detecting CKD presence, severity, and progression will provide clinicians with better guidance in managing the disease and help determine treatment efficacy. In certain conditions where eGFR calculations are hampered by overestimations or underestimations owing to discrepancies in the biomarkers being analyzed, sonography offers an alternative parameter. The current scanning protocol can be modified to incorporate vascular studies for CKD assessment and serve as alternative parameters where renal parenchymal echogenicity is indiscernible. A comprehensive imaging report with qualitative and quantitative assessment can provide patients with a more conclusive diagnosis, reducing the need for additional, costly imaging procedures.
Objectives of the Study
This study aimed to compare morphologic parameters (sonographic grading of renal parenchymal echogenicity and kidney length) and the hemodynamic parameter (renal RI) and their correlation to the eGFR of CKD patients undergoing whole abdominal ultrasound at West Visayas State University Medical Center. More specifically, it was performed to:
- Identify which parameter is more sensitive to and correlates well with deranged eGFR levels (Grades 3 to 5); and,
- Determine the correlations between different sonographic parameters (RI, renal parenchymal echogenicity grading or kidney length) as eGFR grades decline.
Review of Literature
A review of the literature was conducted to determine the subjects and conclusions of studies with respect to the utility of morphologic and hemodynamic parameters in ultrasound.
eGFR
According to the “KDIGO 2012 Clinical Practice Guideline for the Evaluation and Management of Chronic Kidney Disease,” the kidney has many functions, including excretory, endocrine, and metabolic. The glomerular filtration rate (GFR) is one component of excretory function. However, it is widely accepted as the best index of overall kidney function because it is generally reduced following widespread structural damage, and most other kidney functions decline in parallel with GFR in CKD.9
For these reasons, the guidelines recommend eGFR in the assessment, management, and monitoring of disease progression of CKD patients. In a 2008 commentary appearing in the Clinical Journal of American Society of Nephrology, however, Richard J. Glassock and Christopher Winearls discouraged the use of eGFR alone in diagnosing and classifying CKD.10
Morphological Parameters
Unlike acute kidney injury, where healing is complete with total functional kidney recovery, sustained insults from chronic and progressive nephropathies progress to kidney fibrosis and destruction of the normal organ architecture.11 Ultrasound scans that demonstrate small kidneys with reduced cortical thickness, increased echogenicity, scarring, or multiple cysts suggest a chronic process. 11
In a 2015 study of 72 CKD patients with stages 1-4 disease, Lucisano et al concluded that the improved correlation of corrected parameters for body height with the GFR makes renal sonography a reliable tool for a more complete assessment of the disease.12
In 2017, Yaprak and colleagues published their findings on the role of kidney length, parenchymal thickness and echogenicity in assessing CKD. They utilized these parameters to interrogate each kidney of 120 patients with stages 1-5 CKD. An ultrasonographic CKD score was used, based on the mentioned parameters, which revealed that eGFR correlates with kidney length and parenchymal thickness.13
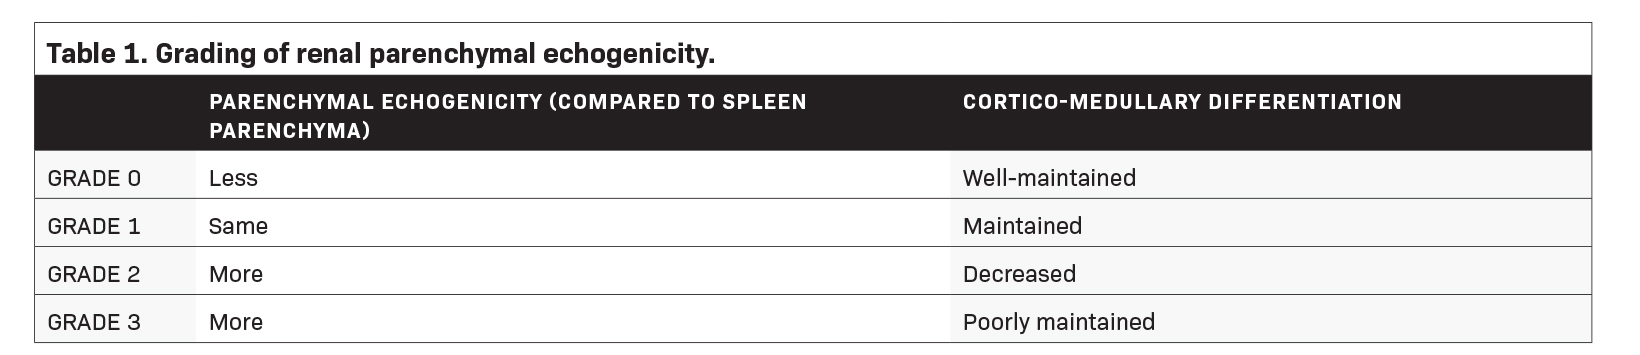
In a study by Shivashankara et al, renal parenchymal status was assessed effectively using a grading system that compared the echotexture of the renal parenchyma with that of the splenic parenchyma, as well as the degree of sonographic differentiation of the renal cortex to that of the medulla (Table 1).5
Ahmed et al in 2019 studied the correlation of the role of ultrasound with serum creatinine levels in the diagnosis of CKD. The researchers found that renal cortical echogenicity correlates best with serum creatinine over longitudinal kidney length, parenchymal thickness, and cortical thickness in patients with CKD.14
Hemodynamic Parameters
In their 2022 study, Radermacher et al hypothesized that in patients with CKD of any cause, the decline of renal function resulting from nonspecific renal scarring would correlate with a higher renal resistance index. Interstitial fibrosis and loss of capillaries and glomeruli are the hallmarks of renal scarring. Assessment of intrarenal vascular resistance helps determine the degree of renal parenchymal damage. Color Doppler ultrasonography was performed on 162 consecutive patients with renal disease. The researchers found that renal function declined over time in patients with RI >0.80. They concluded that a renal RI ≥0.80 reliably identifies patients at risk for progressive renal disease.15
A 2012 study published in Biomed Central Nephrology found an association between renal RI with histologic findings and renal outcome. The renal RI was measured prior to biopsy in 58 CKD patients. The study revealed that RI > 0.65 were associated with severe interstitial fibrosis, arteriosclerosis, and declines in renal function.16 However, the sample size was small, and CKDs arise primarily from glomerulonephritis.
In 2020, Sutikno et al compared the diagnostic value of renal RI and cortical echogenicity in 41 CKD patients. Resistive indices and degree of echogenicity were taken from both kidneys of subjects, all with a GFR < 90 ml/min./1.73 m2 at screening. They found renal RI to be superior to renal cortical echogenicity in terms of specificity for CKD.4
The literature clearly shows the significant correlation of morphologic and hemodynamic parameters of ultrasound in the diagnosis and management of CKD. The absence of studies comparing these parameters to the GFR challenges their sensitivity to CKD. It also raises the question of whether they can be reliable imaging tools in assessing CKD or in determining the potential for disease progression.
Methods
Study Design and Setting
This is a prospective observational (cross-sectional) study correlating ultrasonographic morphologic and hemodynamic parameters to the computed eGFR of CKD patients. The data collection and processing were conducted at West Visayas State University Medical Center, a 300-bed tertiary hospital in Jaro, Iloilo City, Iloilo, Philippines.
Study Period, Patient Selection, Scope, and Limitations
Prospective reviews were conducted on the charts of admitted CKD patients scheduled to undergo abdominal ultrasound examination at the WVSU-MC between March and November 2022. Patients diagnosed with CKD were further evaluated according to inclusion/exclusion criteria, resulting in a sample size of 42 subjects. The following are the inclusion and exclusion criteria:
Inclusion criteria
- CKD patients with eGFR ≤59 mL/min/1.73 m2 (computed using the MDRD formula) or eGFR Grades 3 to 5 (Table 2);
- Age ≥ 18 years
Exclusion criteria
- Undergoing renal replacement therapy (hemodialysis, peritoneal dialysis) or post-kidney transplant)
- Patients with major physical dismemberment; and
- Presence of nephrolithiasis, hydronephrosis, renal malignancies, or acute febrile illnesses.
Scope and Limitations of the Study
This study utilized a creatinine-based eGFR calculation in determining the severity of CKD, as it is a widely available and reliable assay recommended by the latest clinical practice guidelines. Although inulin clearance remains the gold standard for measuring GFR, the test is expensive and not readily available.
Study Population and Procedure
Forty-two patients who underwent whole abdominal ultrasound examinations at WVSUMC within the aforementioned timeframe were included. No randomization was done. The examinations were performed using either the Toshiba Ultrasound System Xario 200 (with serial number 99B1463412) or Sonoscape S50 (with serial number 0502505103).
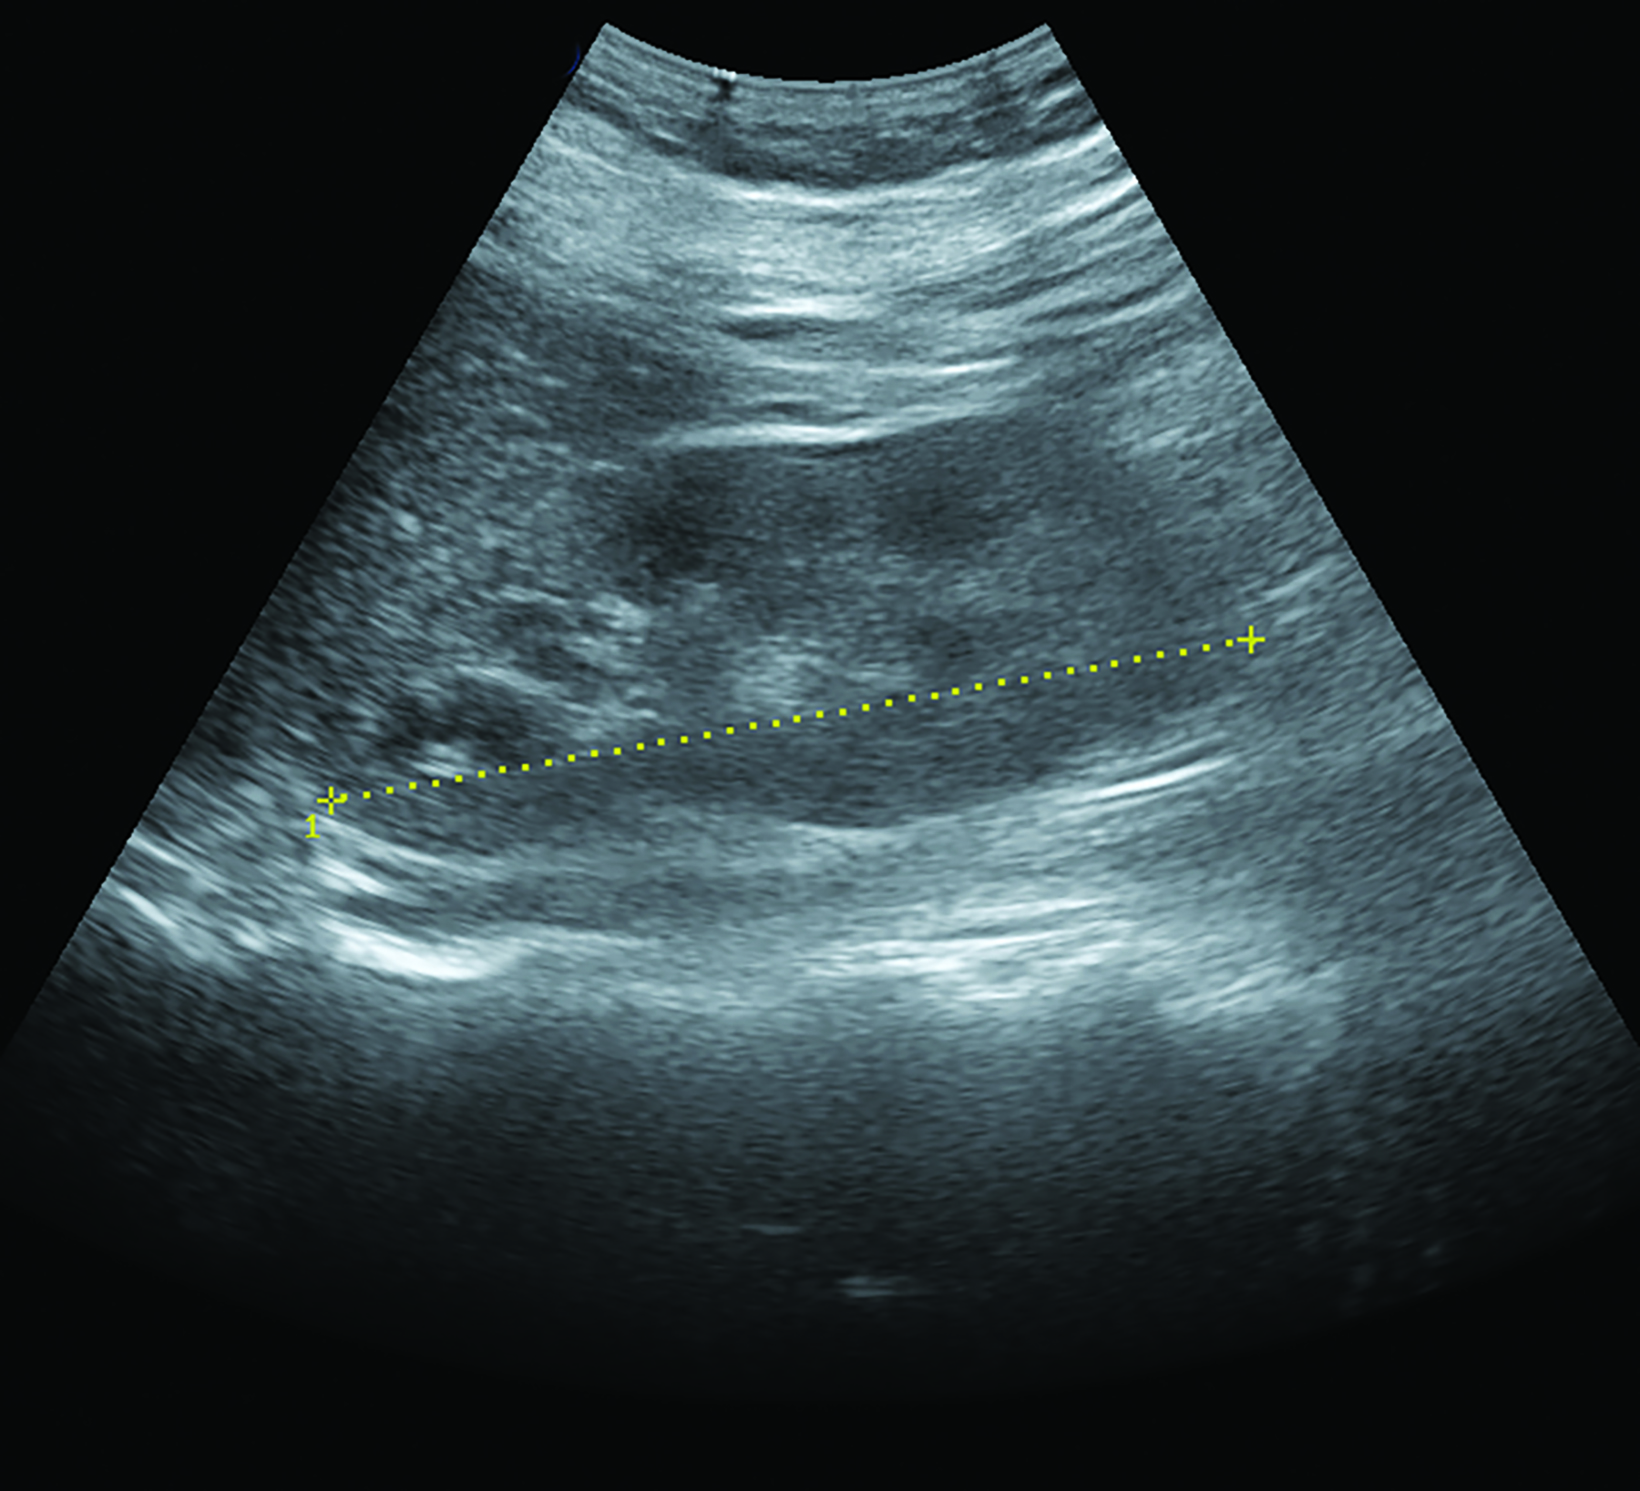
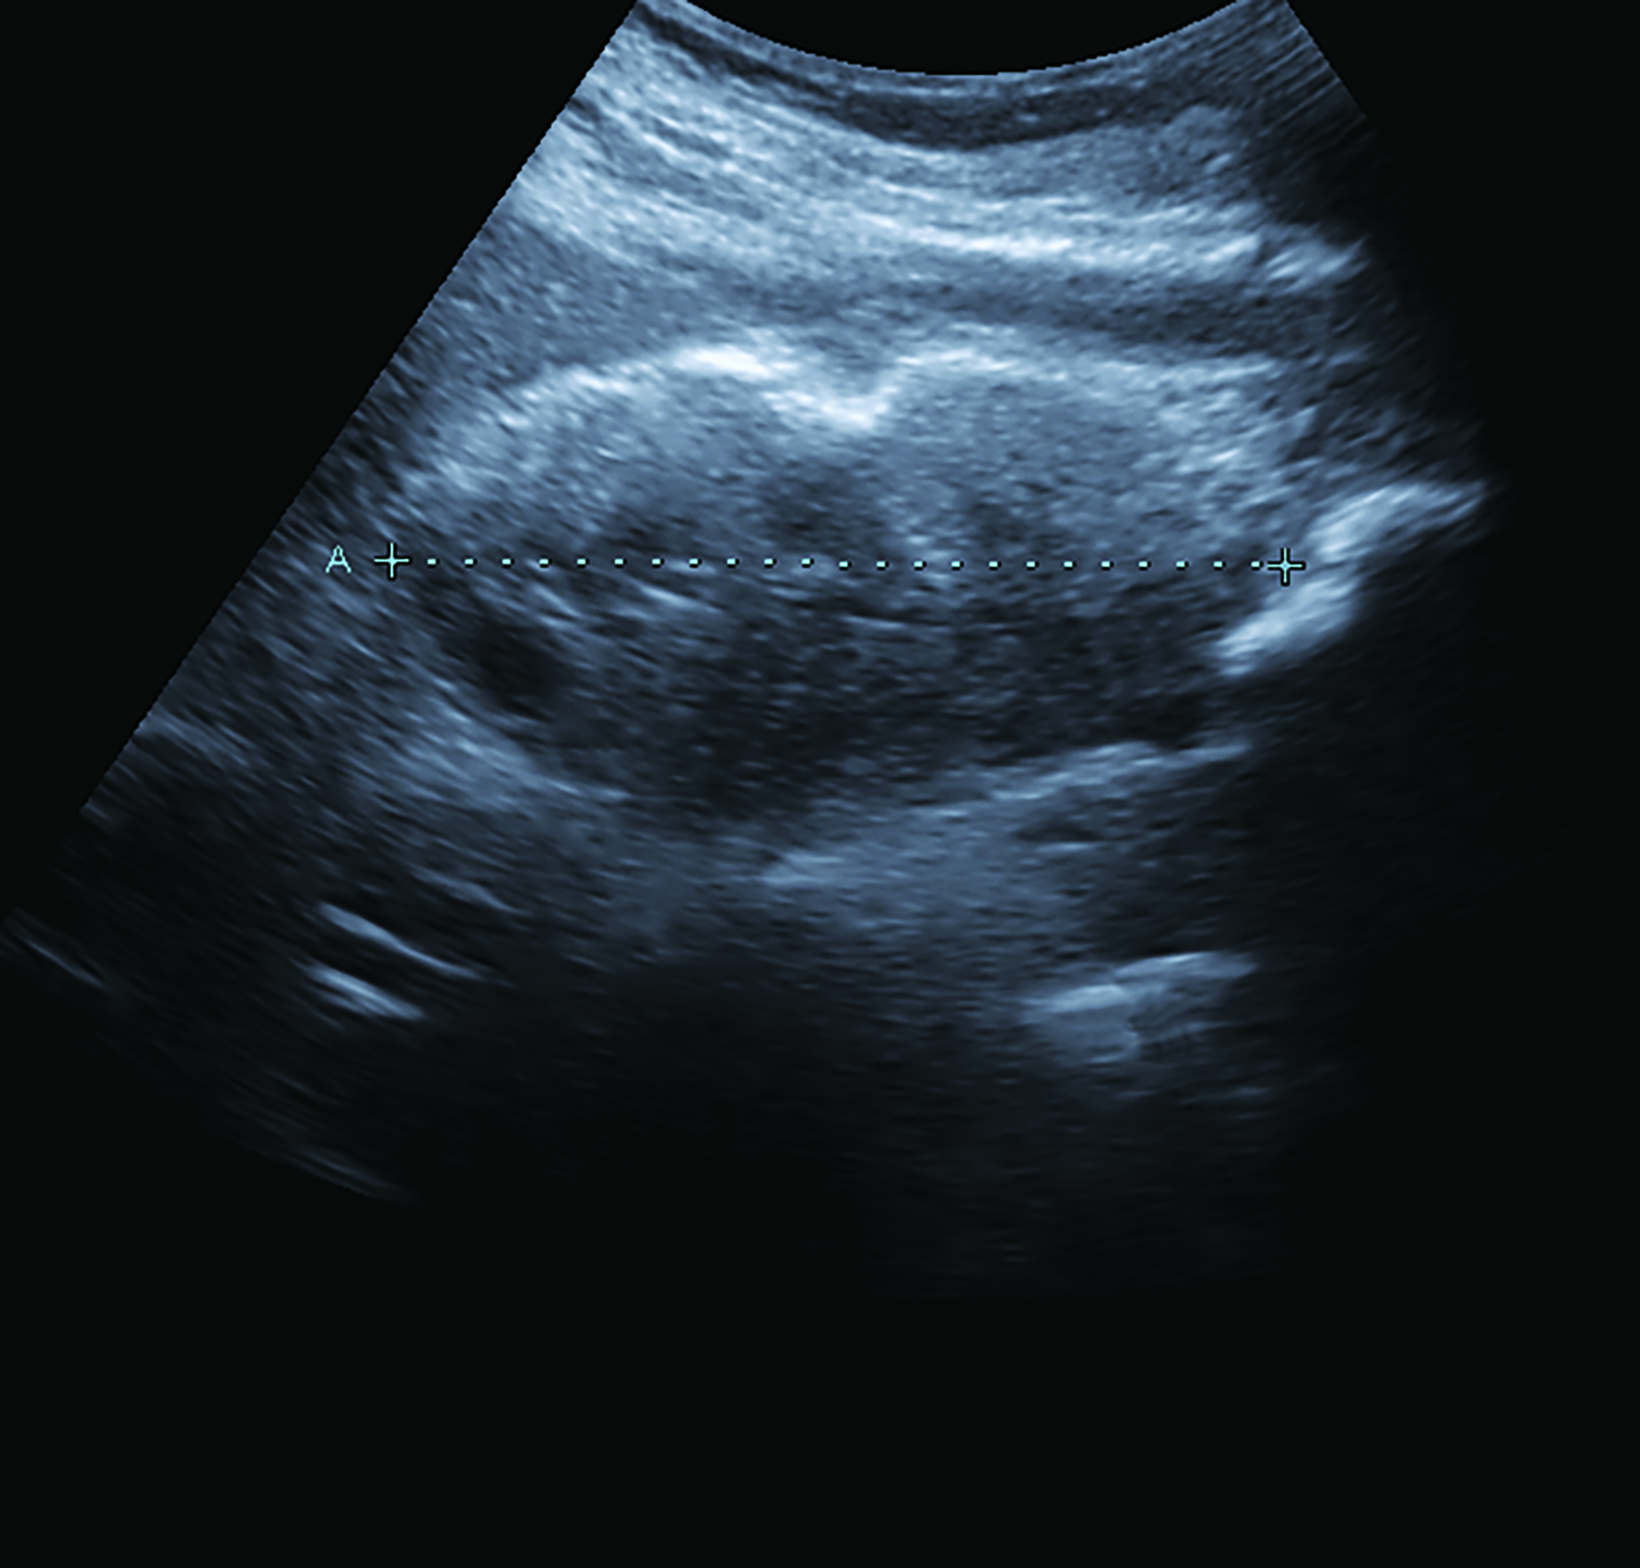
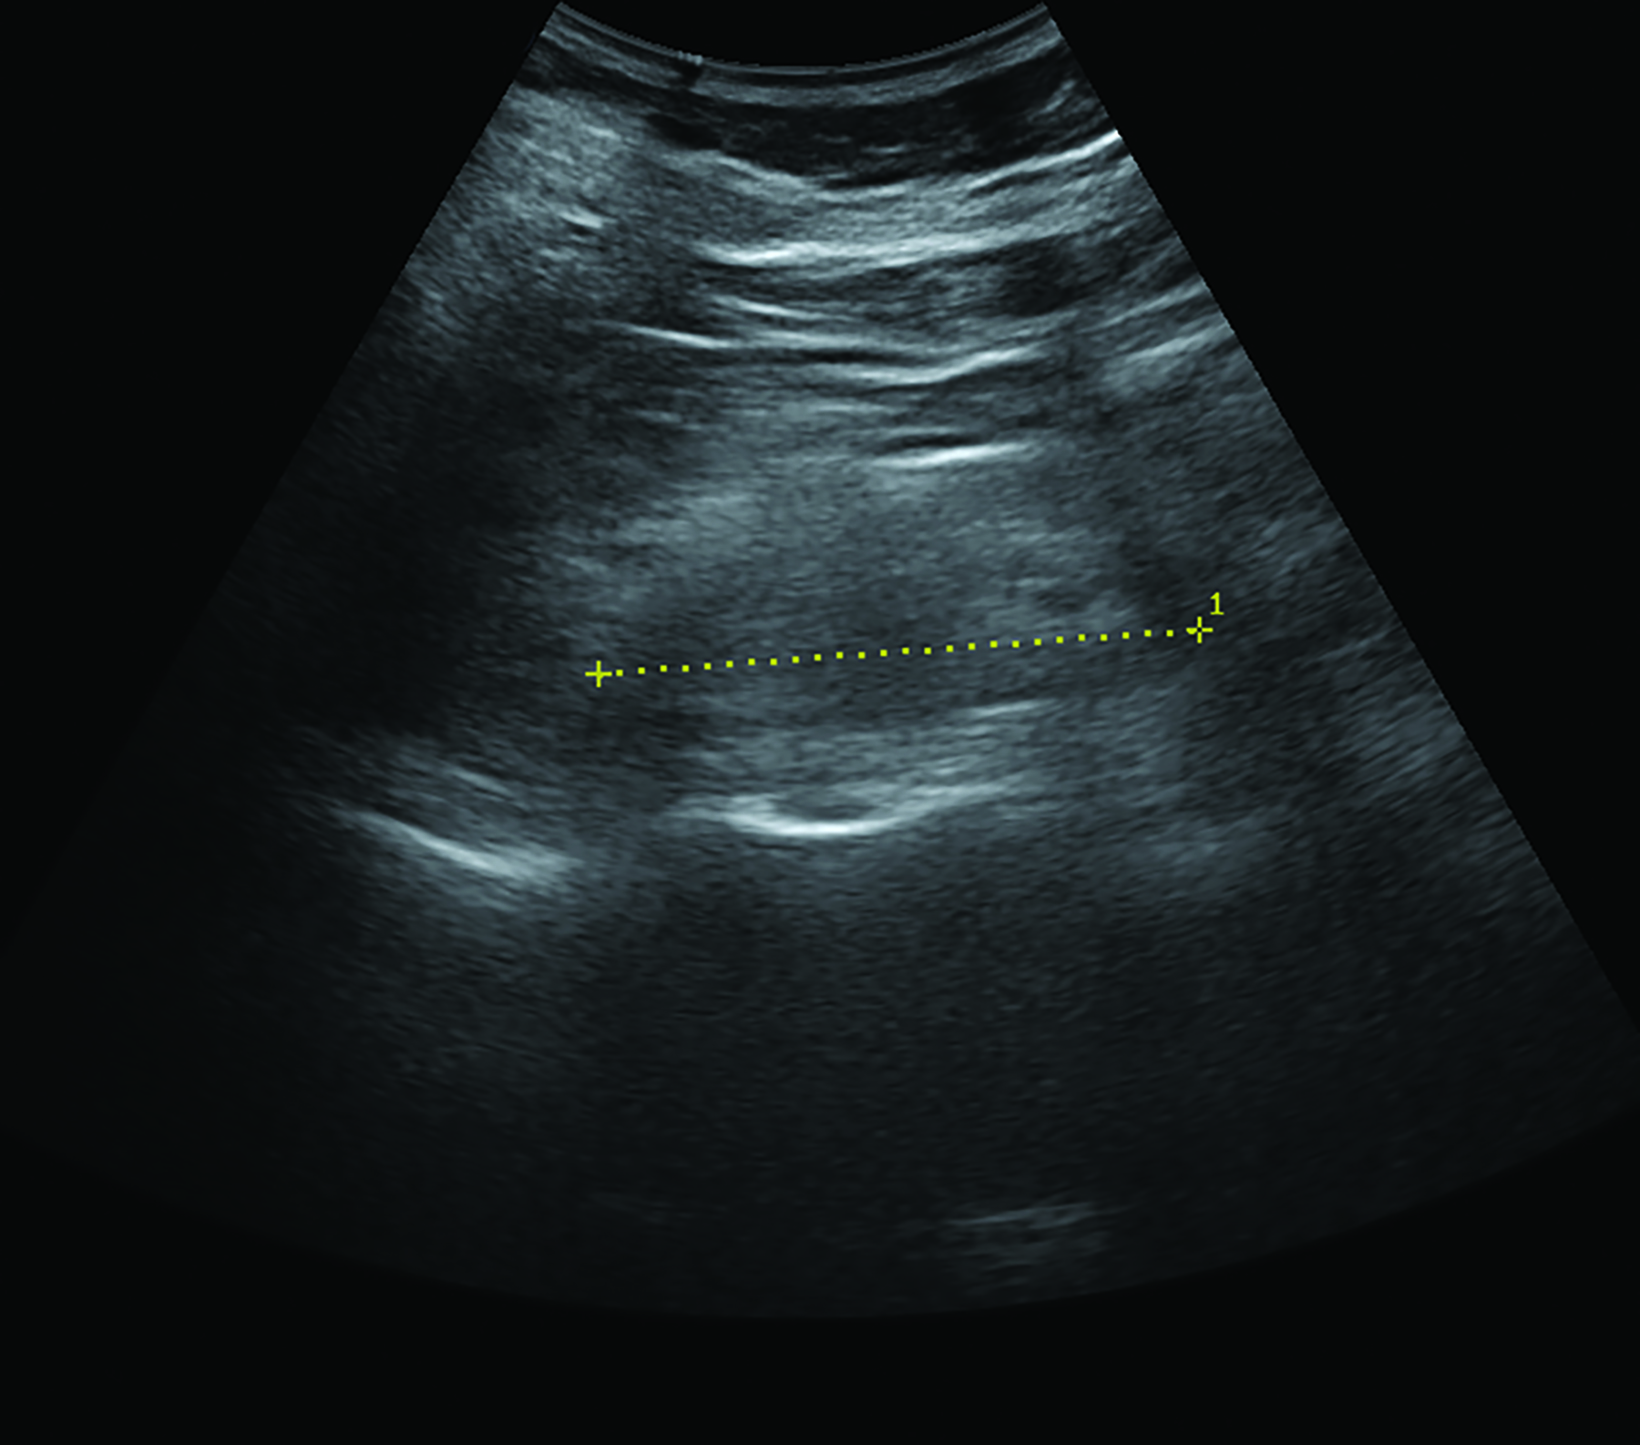
Renal parenchymal echogenicity grading and kidney length measurements were obtained by the radiology resident-in-charge and double-checked by the radiology consultant on duty (Figure 1). Parenchymal echogenicity grading was based on comparative echogenicity for the spleen (Table 1), while a kidney length of <8 cm was considered decreased. Resistivity indices were obtained by a radiology resident experienced in vascular sonography, with >0.70 considered an abnormally increased RI.
Patient demographic and clinical data were uploaded to a secure database for patient confidentiality and privacy. Each patient was assigned a code to maintain anonymity and data organization.
Resistive Index Determination
The patients were scanned using a curvilinear probe. Spectral Doppler images with clear waveform patterns were captured. The peak systolic velocity (PSV) and the end diastolic velocity (EDV) were measured. The RIs were automatically calculated by the machine presets using the equation (PSV-EDV)/PSV. The ntraparenchymal arteries in the upper, middle, and lower poles of both kidneys were sampled. The sample volume was set to a minimum with a narrow angle of insonation. The three RI measurements for each kidney were averaged. Only the highest average RI value from one sample was recorded. Reports were validated by a sonologist with adequate experience in vascular sonography.
Renal Length and Parenchymal Echogenicity
Kidney length was measured with a curvilinear probe in the coronal plane with the patient in the supine or lateral decubitus position. The maximum longitudinal section from both pole ends was recorded.
The renal parenchymal echotexture was compared to the splenic parenchymal echotexture and graded according to the criteria in Table 1 as in the study by Shivashankara et al. Representative sonograms at different renal parenchymal echogenic grades are also shown in Figure 1. All sonographic morphological parameters were conducted by resident radiology physicians and validated by experienced consultant radiologists.
eGFR Calculation
Serum creatinine (in mg/dl) level at patient admission, age, and sex were used for eGFR computation (in ml/min/1.73 m2) using the Modified Diet in Renal Disease (MDRD) formula:
(175 × (serum creatinine) – 1.154 × (Age) – 0.203 × (0.742 if female) × (1.212 if African American)
Chronic kidney disease, as defined by KDIGO, is the presence of abnormalities of kidney structure or function for >3 months and with health implications and graded according to serum creatinine-based eGFR computation (Table 2), with <60 ml/min/m2 (Grades 3a to 5) as the threshold for CKD.
Data Processing and Analysis
Data processing and analysis were performed using the Stata MP Version 17. The mean and standard deviation were calculated for age, eGFR, and kidney length. Frequencies and percentages were used to determine other sociodemographic characteristics and morphological and hemodynamic parameters. – RIs and longitudinal kidney length were calculated for each eGFR grade. The eGFR was calculated for each grade of renal parenchymal echogenicity.
The Kruskal-Wallis H Test was performed to check for association between groups, and Spearman’s rank correlation coefficient was used to determine the strength of association between variables. A p-value <0.05 was considered statistically significant.
Results
This study compared and identified the correlation between morphological parameters (sonographic grading of the renal parenchymal echogenicity and kidney length), hemodynamic parameters (renal RI), and eGFR of patients with CKD who underwent whole abdominal ultrasound.
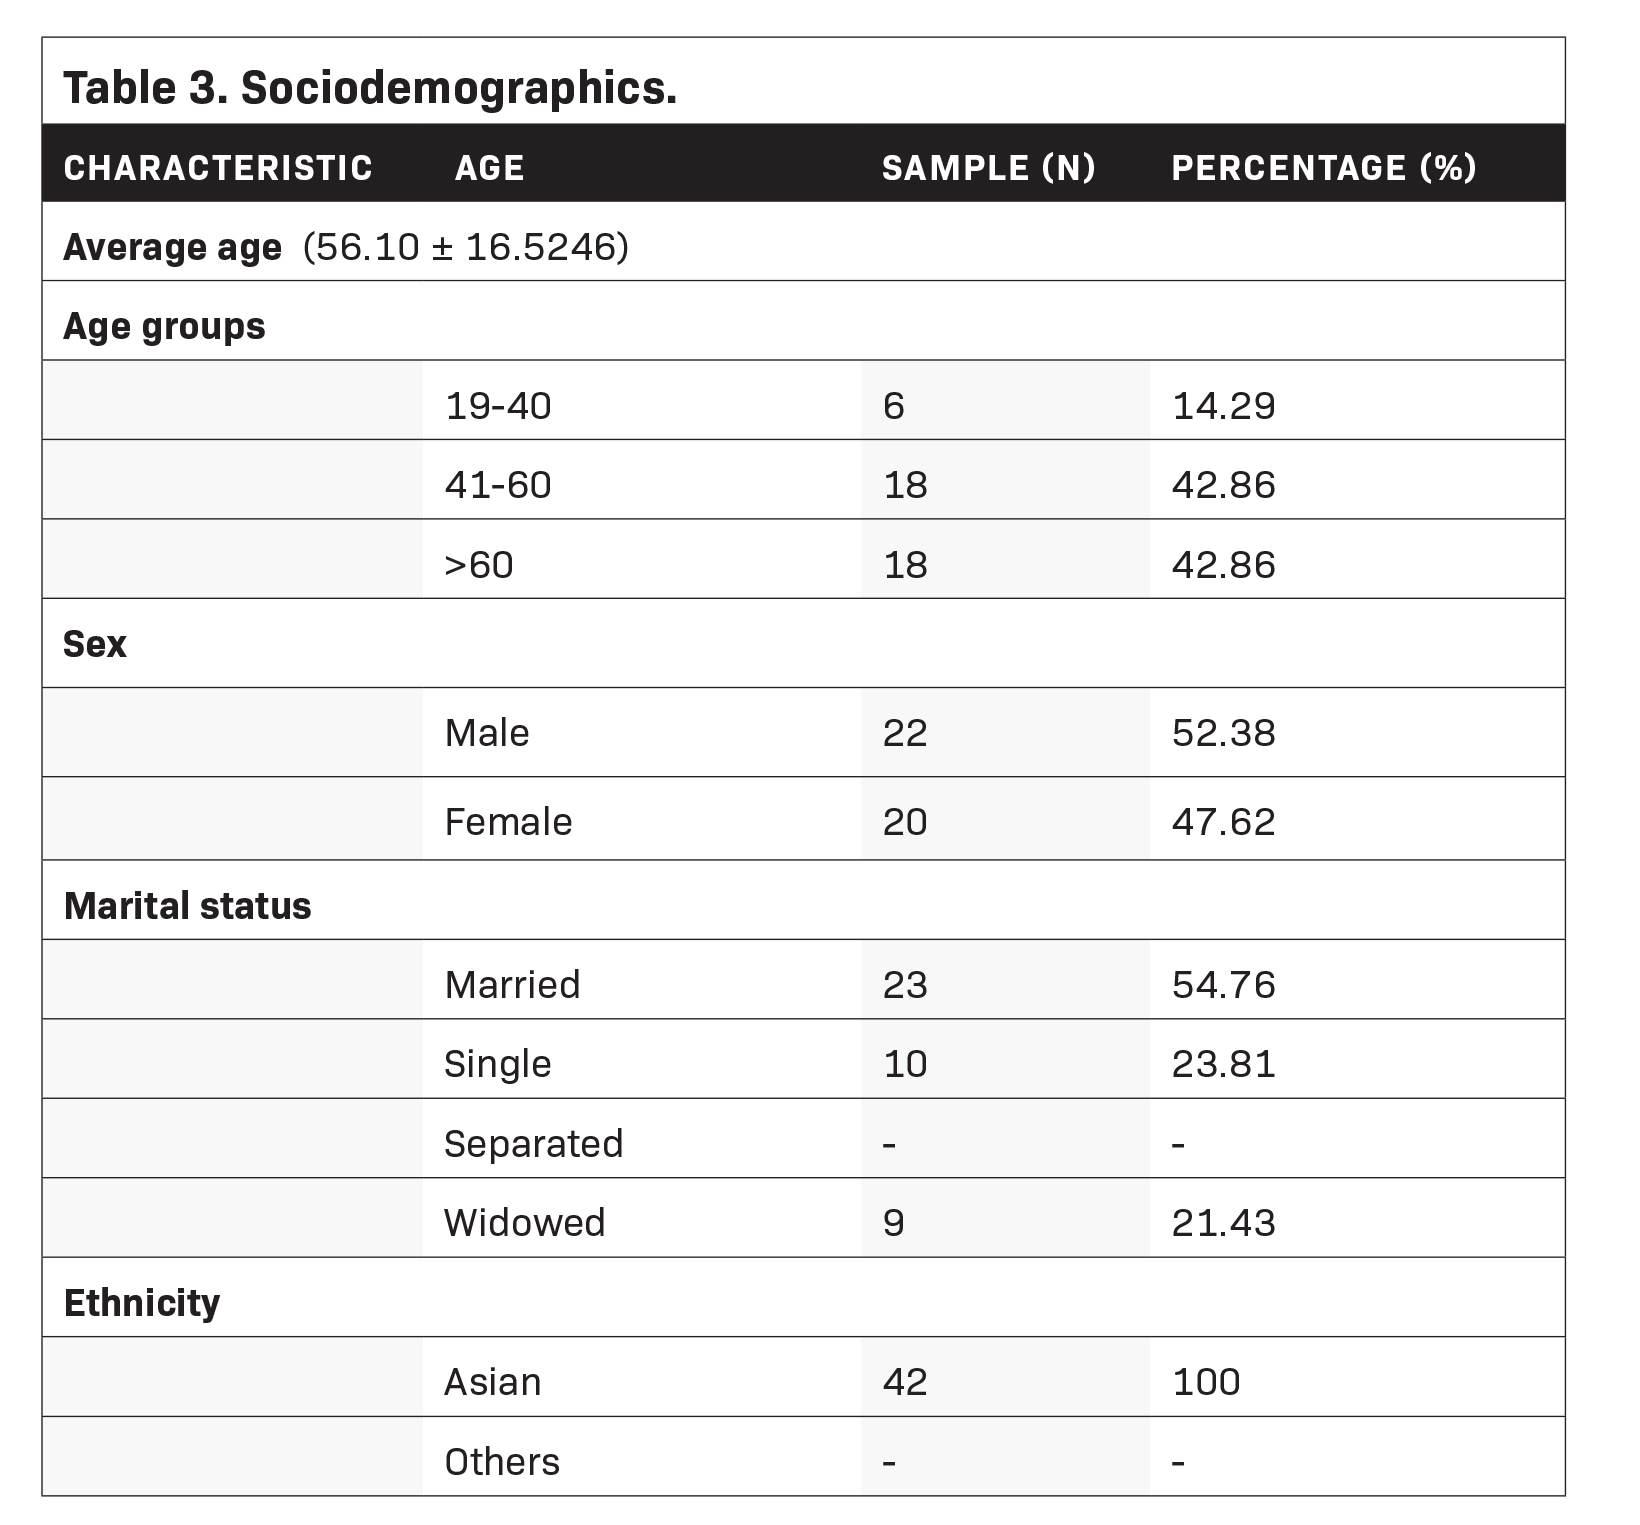
A total of 42 subjects were accounted for in this study. All of them were Asians with an average age of 56 years (± 16.5246). About 52.4% were male and 47.6% were female. The majority were married (54.8%), followed by single (23.8%), and separated (21.43%) (Table 3).
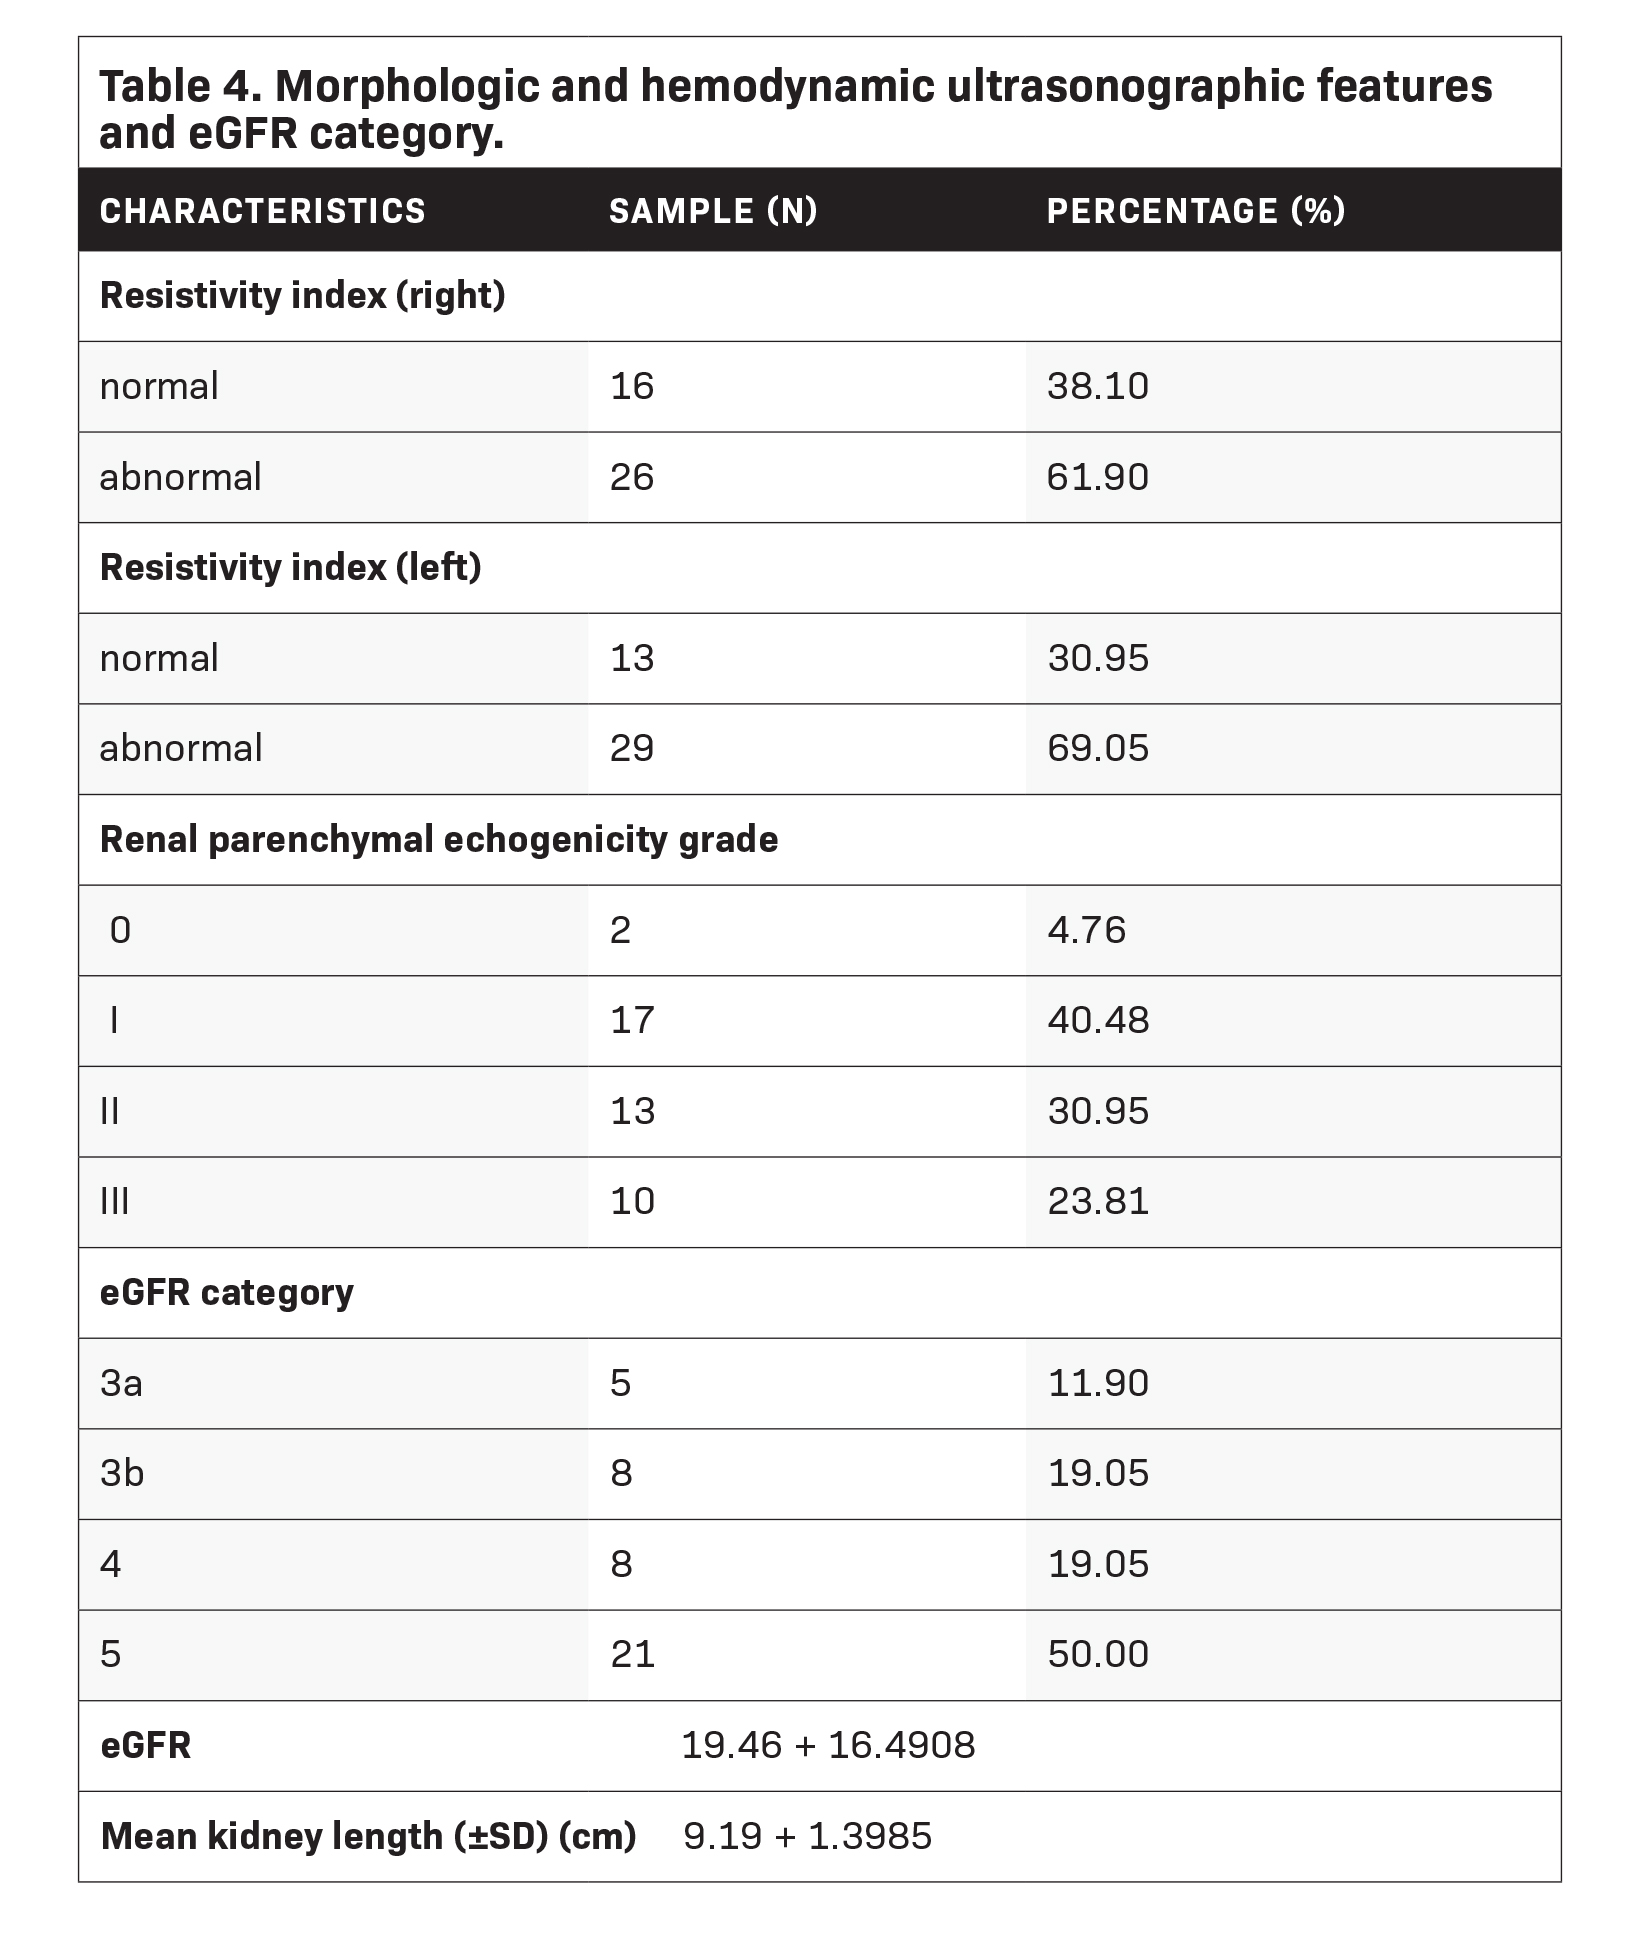
Resistive index results showed that 61.9% of patients had an abnormal right kidney, while 69.1% had an abnormal left kidney. Patients with renal parenchymal echotexture (RPE) grade I comprised 40.5% of the population, followed by those with RPE grade II at 31.0%, RPE grade III at 23.8%, and RPE grade 0 at 4.8%. The average eGFR was 19.5 ml/min/m2 (± 16.4908), and most of the patients fell in Grade 5 (n=21; 50%), followed by Grade 3b, Grade 4 (n=8; 19.1%), and Grade 3a (n=5; 11.9%). The average kidney length measured 9.19 cm (± 1.3985) (Table 4).
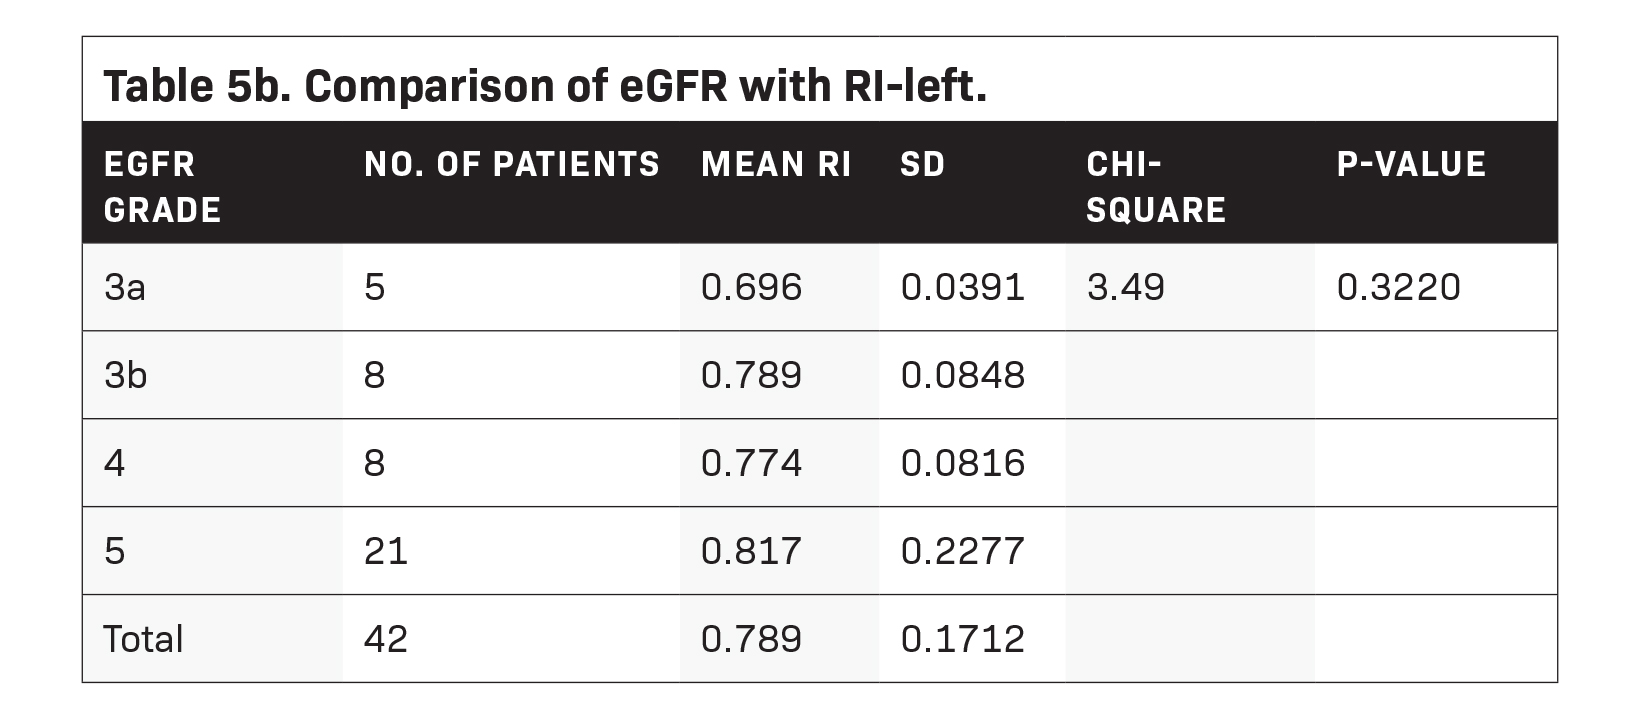
Statistical results showed that patients with eGFR grade 3a had an average right kidney RI of 0.662 (± 0.1096), eGFR Grade 3b patients had an average right-RI of 0.755 (± 0.0438), Grade 4 patients, an average right-RI of 0.794, and Grade 5 patients, an average of 0.768 (± 0.1459) (Table 5a). Meanwhile, the average RI of the left kidney for patients with eGFR grade 3a was 0.696 (± 0.0391), that for patients with Grade 3b had an average of 0.789 (± 0.0848), Grade 4, an average of 0.774 (± 0.0816), and Grade 5, an average of 0.817 (± 0.2277) (Table 5b).
Results of the Kruskal-Wallis test to compare the RIs of the left and right kidneys for each eGFR grade showed no significant difference between each grade (p-value > 0.05).
Comparing the actual eGFR values with the renal parenchymal echogenicity grade (RPEG). the average eGFR for RPEG 0 was 33.90 ( ± 19.790), RPEG I was 28.76 ( ± 17.3868); RPEG II, 10.47 ( ± 9.9457); and RPEG III, 12.47 ( ± 12.0532). Using the Krustal-Wallis
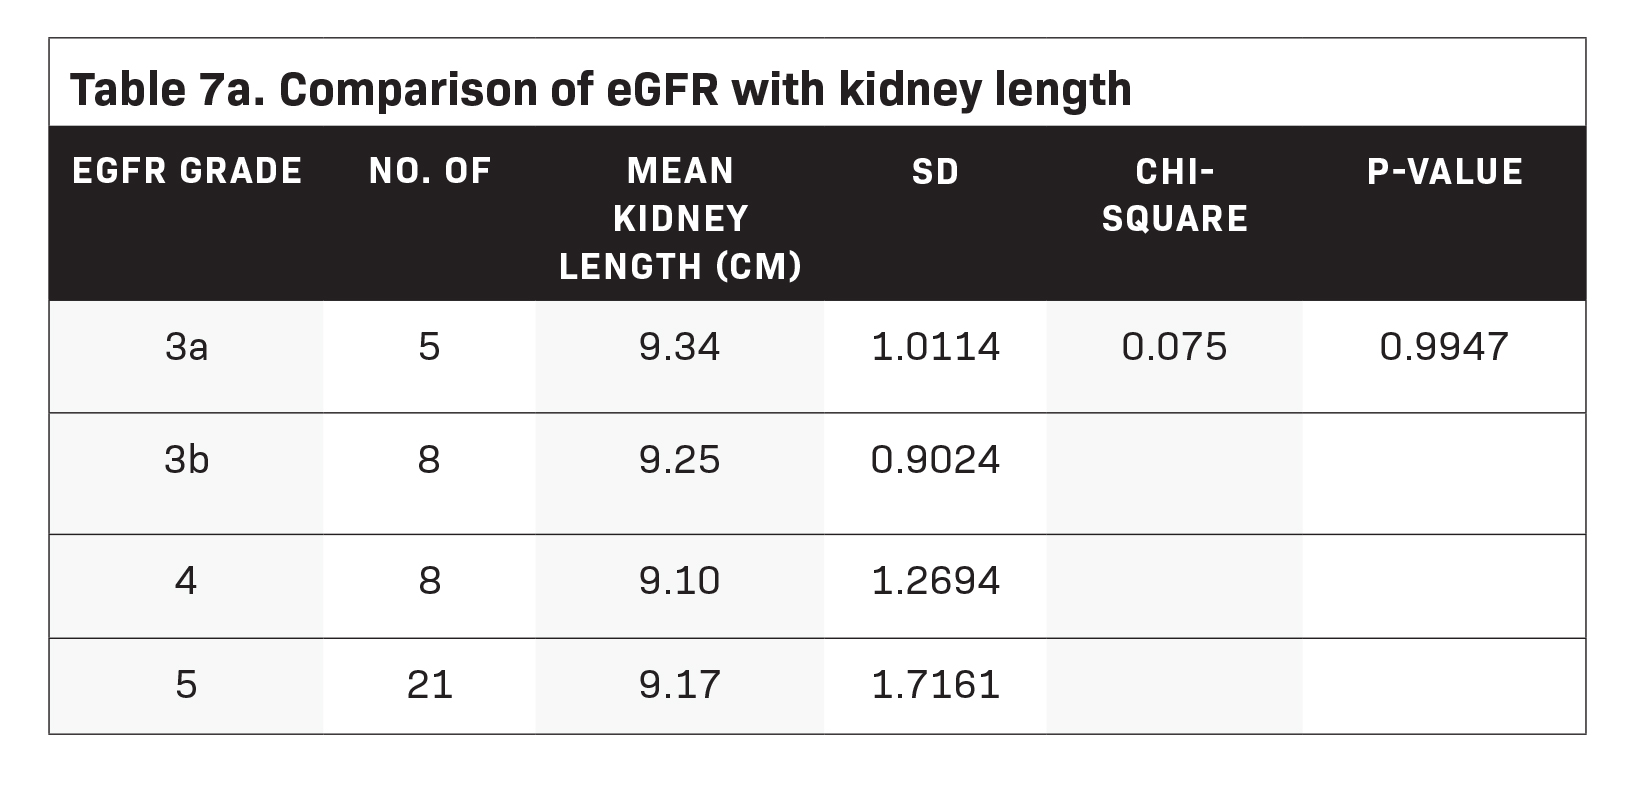
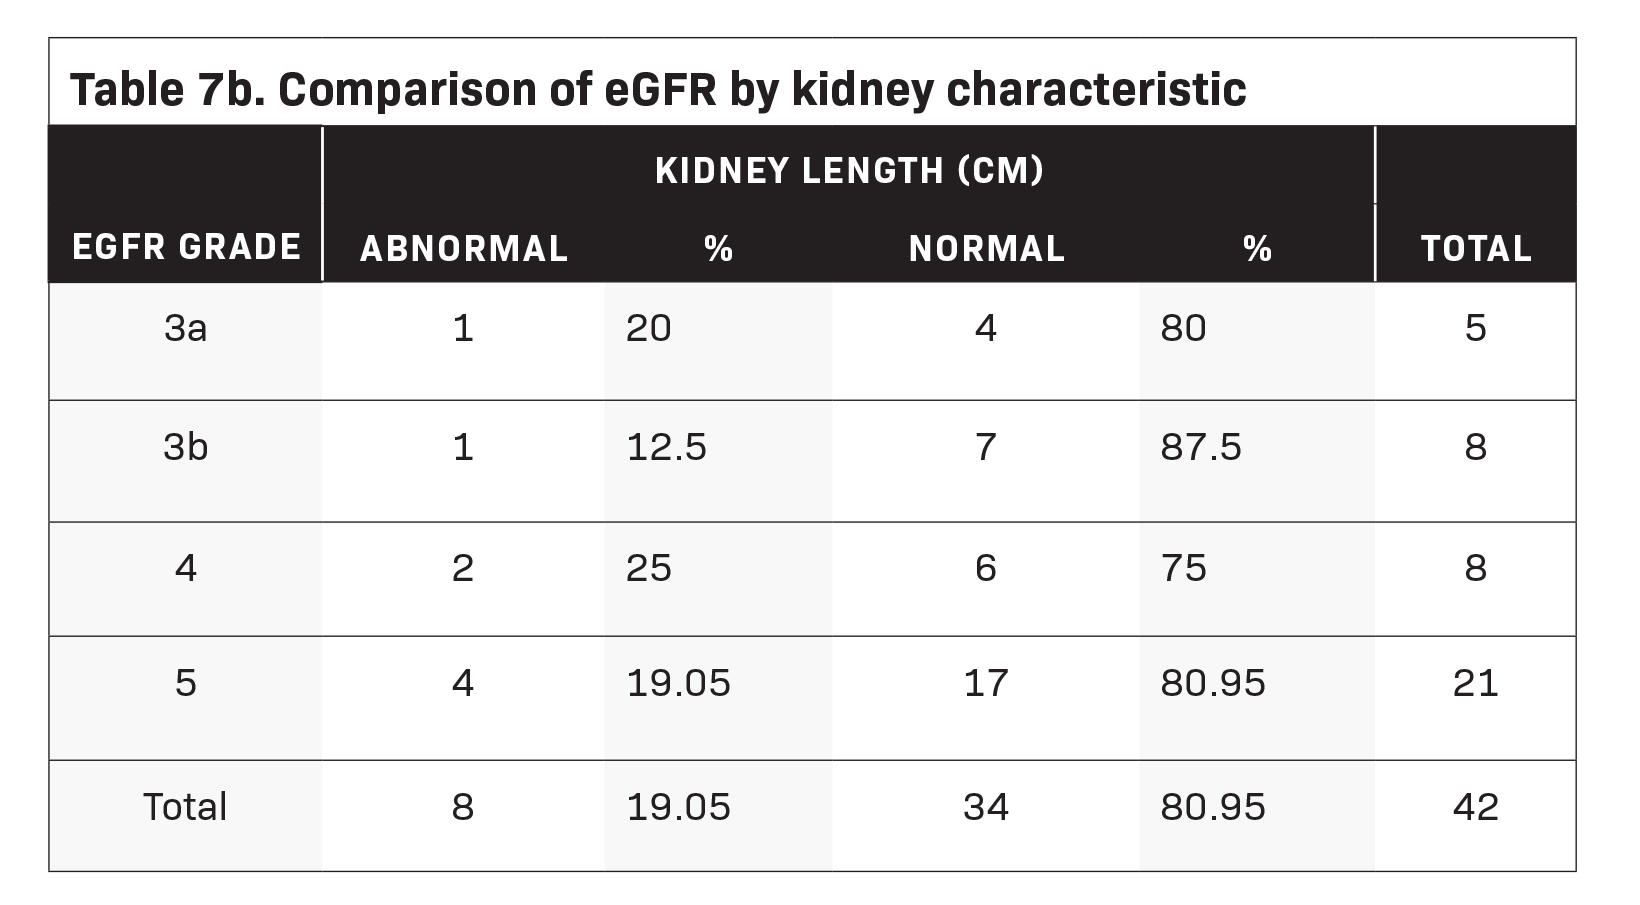
test, our study found evidence to conclude that a significant difference exists between eGFR and RPEG levels (see Table 6). The average kidney length of patients with eGFR grade 3a was 9.34 ( ± 1.0114); those with eGFR grade 3b was 9.25 ( ± 0.9024); grade 4, 9.10 ( ± 1.2694); and grade 5, 9.17 ( ± 1.7161). Kruskal-Wallis test results showed no significant difference between the aver- age kidney length for each eGFR grade (Table 7a). Additionally, only one out of five patients with eGFR grades 3a and 3b had been diagnosed with small kidneys. Meanwhile, two patients with eGFR grade 4 and four with eGFR grade 5 were identified to have abnormally-sized kidneys Table 7b).
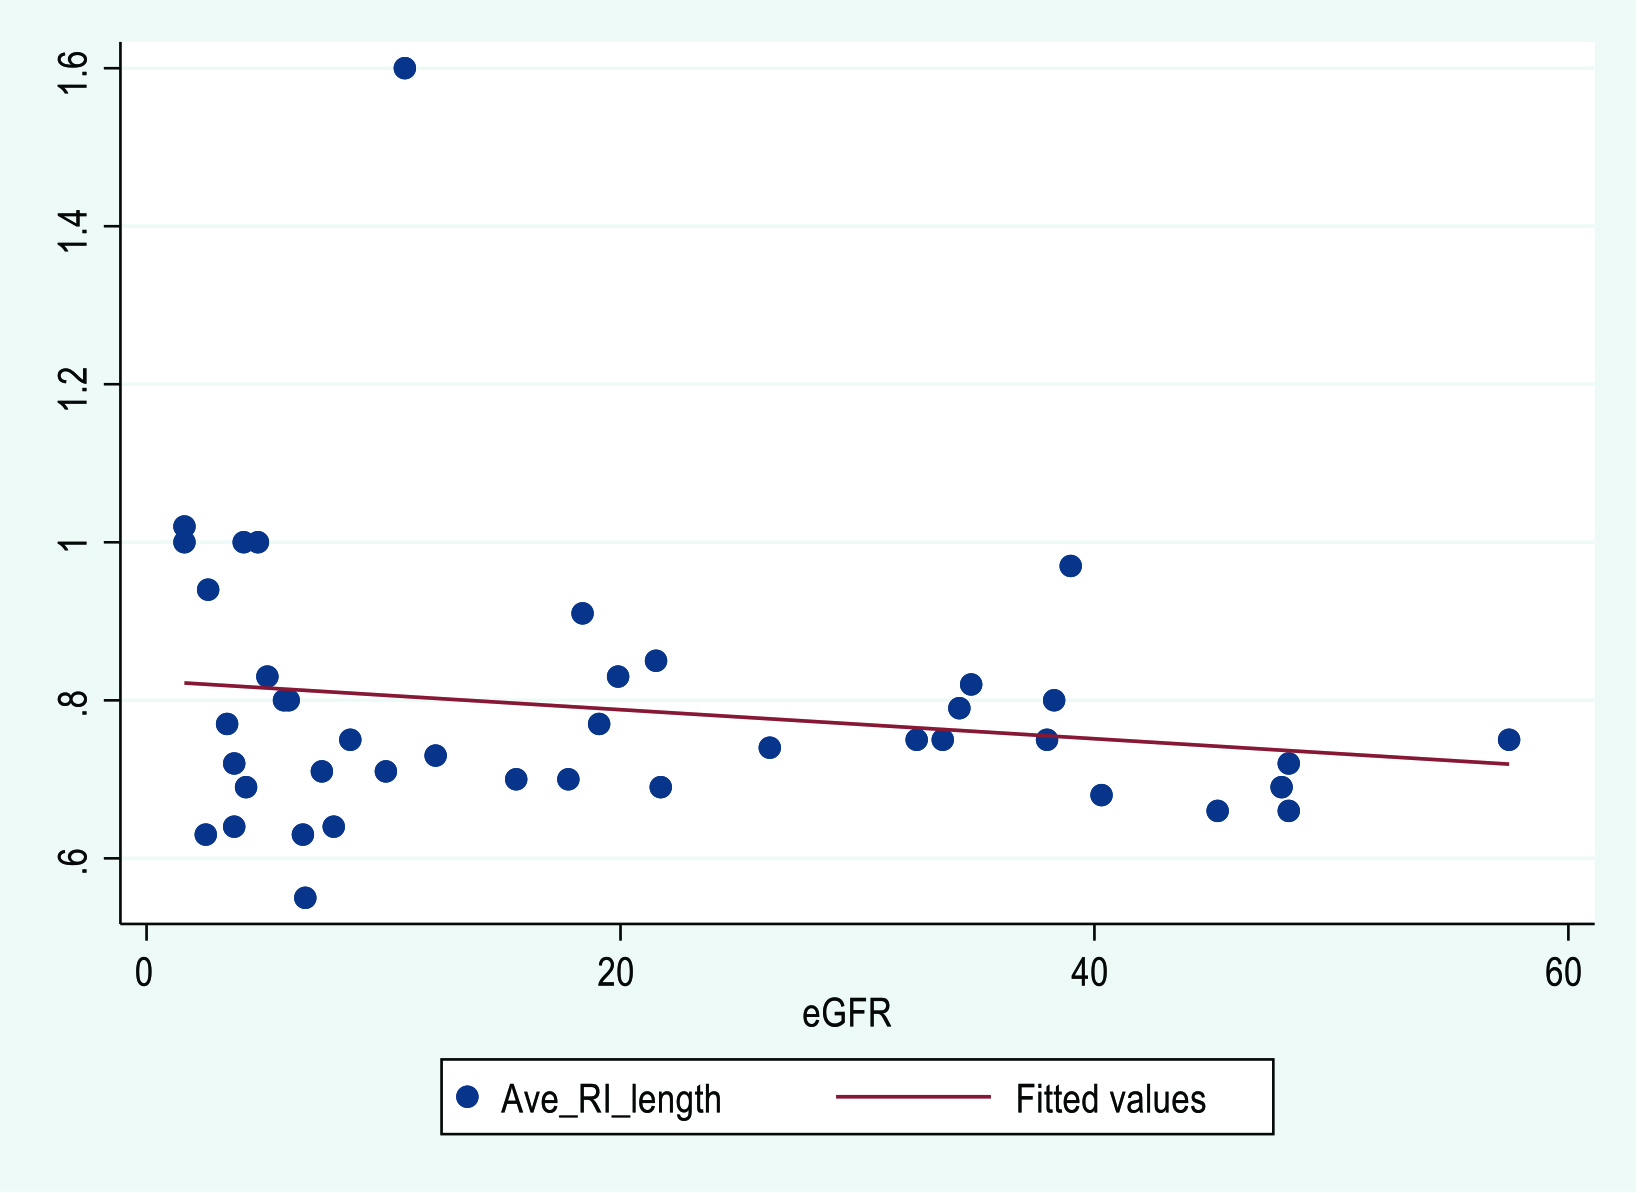
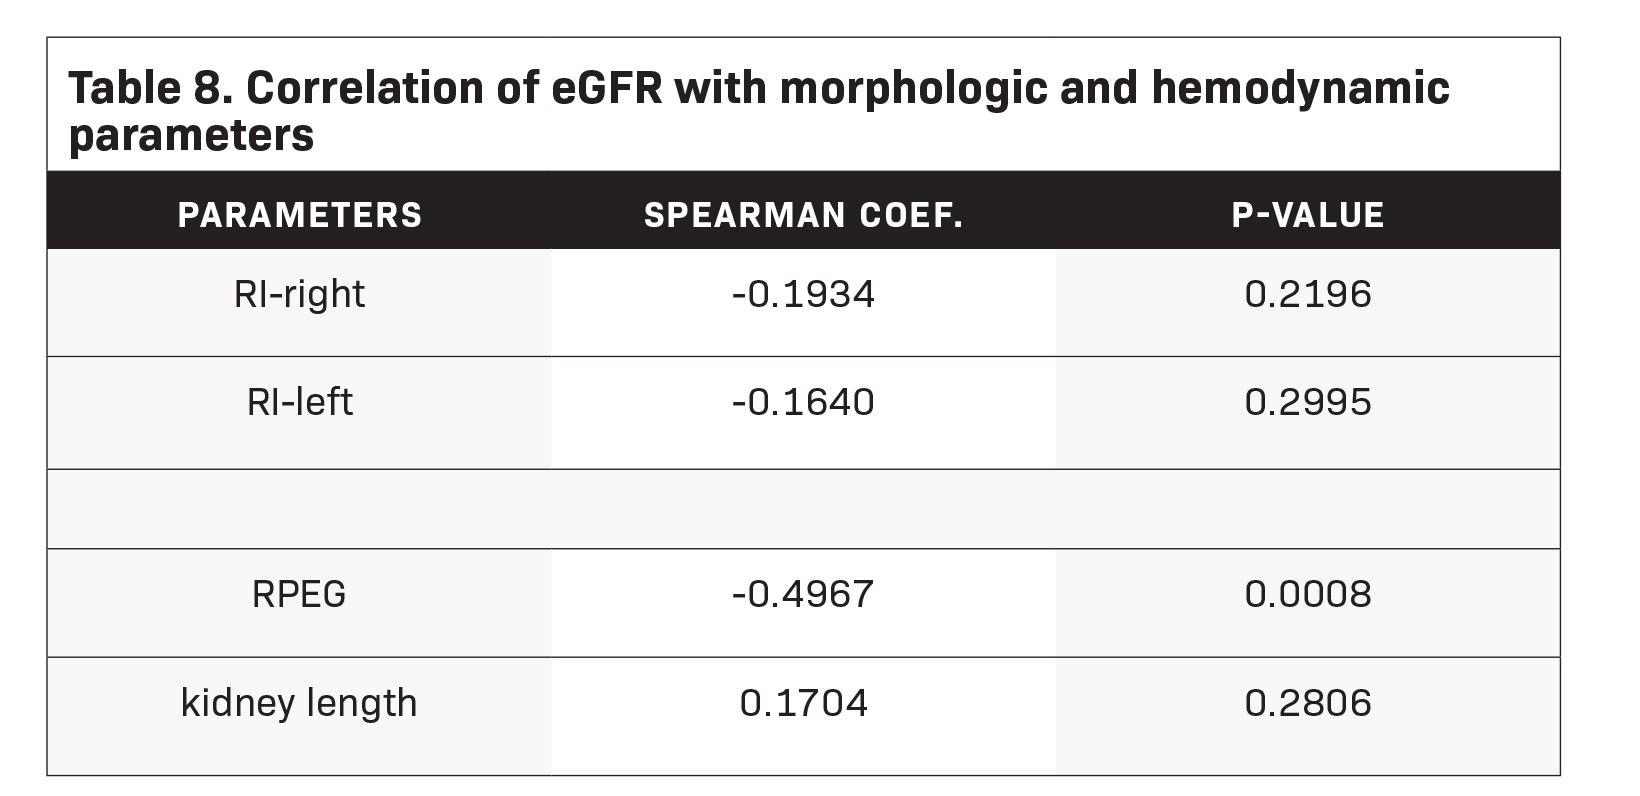
Table 8 shows that RI has a weak negative correlation with eGFR (right: -0.1934; left: -0.1640). This means that as eGFR increases, the kidneys’ resistivity decreases. Results also showed that the RPEG has a moderate negative correlation with eGFR (-0.4967). This implies that higher eGFR is associated with lower RPEG.
Lastly, kidney lengths positively associated with eGFR (0.1704) although weakly correlated. This indicates that eGFR increases with kidney length. These correlations were confirmed by Figures 2, 3, and 4, wherein the plots reflect linear but almost flat lines. Using Spearman’s correlation test, only RPEG demonstrated a significant correlation with eGFR (p-value: 0.008). The remaining parameters did not show evidence of statistical significance (p-value > 0.05).
Discussion
Ultrasonography remains an important diagnostic imaging modality in the evaluation of the kidneys, giving clinicians an overview of renal status and function. Evaluation of renal parenchymal echogenicity, RI, and renal length are sonographic parameters used to correlate kidney status, especially in patients with CKD. Each of these parameters has advantages and disadvantages, as explored in this study.
This study comprised CKD patients, most with increased resistivity indices; however, a poor correlation was found with increasing eGFR grade. Although the samples with deranged RI belonged to CKD patients in stages 3b to 5, a linear correlation could not be established to properly set range RI values for each CKD stage. It has been shown that some factors may influence RI values despite the presence of renal disease; these include systemic vascular resistance, heart rate, and atherosclerosis. Systemic and nonrenal factors should be considered in the use of RI for evaluating renal disease.4 Because of the pitfall as mentioned earlier, studies suggest that RI may be useful for predicting AKI, as values may increase in the setting of sepsis, hepatorenal syndrome and obstructive uropathy. The utility of RI has been correlated with patient age and histological changes such as sclerosis and tubulointerstitial damage in kidney tissue samples. Studies have also shown that in CKD patients with RI values >0.70, there is poorer renal survival compared to patients with RI of <0.65 upon follow-up.6
Kidney length showed the least statistically significant correlation with eGFR, although most of the patients with decreased kidney length fell into CKD categories 4 and 5. This implies that changes in renal dimensions may not be sonographically apparent, even though worsening renal function and kidney atrophy are more common at the severe end of the CKD spectrum. This also highlights the relative differences in kidney size based on gender, age, weight, and height.4 Obtaining renal volume and cortical thickness may be more meaningful in assessing renal status compared to renal length alone. Renal size assessment through ultrasonography has been shown to be of value for residual renal function evaluation in patients who are already undergoing renal replacement therapy.9
Findings suggest that renal cortical echogenicity correlates well with eGFR in CKD compared to RI and renal length,. Local and wide-spread renal cortical changes in the setting of interstitial and cicatricial conditions, respectively, produces consequent linear cortical echogenicity changes. This may be attributed to findings that support significant histologic correlation (glomerular sclerosis, tubular atrophy, interstitial inflammation, and fibrosis) with echogenicity of the renal cortex.
Flow changes, cell infiltration and deposition of substances such as fat, connective tissue and calcium contribute to increased cortical echogenicity of the kidneys.3 The renal echogenicity grading also correlated well with the use of creatinine levels in patients with CKD in comparison to other sonographic parameters in one study.
Furthermore, changes in renal echogenicity are irreversible compared to serum creatinine levels, which can be corrected with renal replacement therapy. As a tool for determining renal status in CKD patients, sonographic grading of the renal cortex relative to the liver or splenic parenchyma can be performed easily, with a high reproducibility rate.17
Conclusion
Parenchymal echogenicity grading can be a useful sonographic parameter, among others, in determining the renal status of patients with CKD, correlating well with declining levels of eGFR. This may be due to renal parenchymal echogenicity being more representative of changes occurring at the tissue level. In addition, nonrenal factors may affect renal length and RI values; thus, they may not correlate well with the current renal status of CKD patients.
For further study, the authors suggest that more than one evaluator be used for RI determination. Increasing sample size and study duration may also be needed. A more meaningful, albeit tedious, measurement may be performed through the acquisition of renal volume rather than length alone.
References
- Bikbov B, Purcell CA, Levey AS, et al. Global, regional, and national burden of chronic kidney disease, 1990–2017: a systematic analysis for the Global Burden of Disease Study 2017. The Lancet. 2020;395(10225):709-733. doi:10.1016/S0140-6736(20)30045-3
- Tang SCW, Yu X, Chen HC, et al. Dialysis care and dialysis funding in Asia. Am J Kidney Dis. 2020;75(5):772-781. doi:10.1053/j.ajkd.2019.08.005
- Kidney Health Plus Quezon City, Manila. National Kidney and Transplant Institute. https://nkti.gov.ph/index.php/patients-and-visitors/kidney-health-plus.
- Sutikno DA, Baskoro N. Comparing diagnostic value of renal parenchymal resistive index and cortical echogenicity in chronic kidney disease patients. Resistive Index; renal cortex echogenicity; chronic kidney disease; glomerulus filtration rate (GFR). Int J Human Health Sci. 2020;4(3):6. doi:10.31344/ijhhs.v4i3.200
- Shivashankara VU, Shivalli S, Pai BHS, et al. A comparative study of sonographic grading of renal parenchymal changes and estimated glomerular filtration rate (eGFR) using modified diet in renal disease formula. J Clin Diagn Res: JCDR. 2016;10(2):TC09-TC11. doi:10.7860/JCDR/2016/16986.7233
- Viazzi F, Leoncini G, Derchi LE, Pontremoli R. Ultrasound Doppler renal resistive index: a useful tool for the management of the hypertensive patient. J Hypertension. 2014;32(1):149-153. doi:10.1097/HJH.0b013e328365b29c
- Alaini A, Malhotra D, Rondon-Berrios H, et al. Establishing the presence or absence of chronic kidney disease: Uses and limitations of formulas estimating the glomerular filtration rate. World J Methodol. Sep 26 2017;7(3):73-92. doi:10.5662/wjm.v7.i3.73
- Heine GH, Reichart B, Ulrich C, Köhler H, Girndt M. Do ultrasound renal resistance indices reflect systemic rather than renal vascular damage in chronic kidney disease? Nephrology Dialysis Transplantation. 2007;22(1):163-170. doi:10.1093/ndt/gfl484
- KDIGO 2012 Clinical Practice Guideline for the Evaluation and Management of Chronic Kidney Disease. Kidney International Supplements. 2012;3(1)
- Glassock RJ, Winearls C. Screening for CKD with eGFR: doubts and dangers. Clin J Am Soc Nephrol. Sep 2008;3(5):1563-8. doi:10.2215/cjn.00960208
- Vaidya SR, Aeddula NR. Chronic Kidney Disease. In: StatPearls. Treasure Island (FL): StatPearls Publishing; October 24, 2022.
- Lucisano G, Comi N, Pelagi E, Cianfrone P, Fuiano L, Fuiano G. Can renal sonography be a reliable diagnostic tool in the assessment of chronic kidney disease? J Ultrasound Med. Feb 2015;34(2):299-306. doi:10.7863/ultra.34.2.299
- Yaprak M, Çakır Ö, Turan MN, et al. Role of ultrasonographic chronic kidney disease score in the assessment of chronic kidney disease. Int Urol Nephrol. 2017;49(1):123-131. doi:10.1007/s11255-016-1443-4
- Ahmed S, Bughio S, Hassan M, Lal S, Ali M. Role of ultrasound in the diagnosis of chronic kidney disease and its correlation with serum creatinine level. Cureus. Mar 12 2019;11(3):e4241. doi:10.7759/cureus.4241
- Radermacher J, Ellis S, Haller H. Renal Resistance Index and progression of renal disease. Hypertension. 2002;39(2):699-703. doi:10.1161/hy0202.103782
- Bigé N, Lévy PP, Callard P, et al. Renal arterial resistive index is associated with severe histological changes and poor renal outcome during chronic kidney disease. BMC Nephrol. 2012;13:139. doi:10.1186/1471-2369-13-139
- Karunakar C, T D. Sonographic grading of renal cortical echogenicity and raised serum creatinine in patients with chronic kidney disease. Int. J Health Clin Res. 2021;4(8):211-214. https://ijhcr.com/index.php/ijhcr/article/view/1450
Citation
P C, E P. A Comparative Study of Renal Parenchymal Resistive Index, Ultrasonographic Grading of Renal Parenchymal Echogenicity, Kidney Length, and Estimated Glomerular Filtration Rate Among Chronic Kidney Disease Patients Undergoing Whole Abdominal Ultrasound at West Visayas State University Medical Center. Supplement to Applied Radiology. 2024;(1):16-25.
January 25, 2024