3T MR imaging protocol for characterization of renal masses
Images
Supplement to Applied Radiology December 2012, sponsored by Philips
Dr. Khatri is an Assistant Professor of Radiology, Body/Body MRI Section, and Dr. Pedrosa is Chief-of-MRI, Associate Professor of Radiology, Department of Radiology, University of Texas Southwestern Medical Center, Advanced Imaging Research Center, Dallas, TX.
Renal cell carcinoma (RCC) is the third most common genitourinary tumor and seventh most common cancer in the United States. Radical or partial nephrectomy has historically been the standard treatment; however, given the trend towards earlier diagnosis, less invasive treatment options are feasible in appropriate cases.1 Imaging plays a vital role in detection of renal lesions, in assessing local stage, providing crucial information for planning surgical resection and predicting prognosis, thus contributing to management decision making. Although ultrasonography and computed tomography (CT) have been used for evaluation of renal lesions, magnetic resonance (MR) imaging offers certain advantages over these modalities.
Technology
MR imaging possesses higher inherent contrast resolution than CT or ultrasound. In addition, it has a high sensitivity for detecting tissue enhancement when gadolinium is administered. It is free of known pitfalls, such as pseudoenhancement, seen routinely on CT.2-4 MR imaging with 3.0 Tesla (3T) systems, high-density phased-array coils, and newly developed sequences, such as multiecho Dixon (mDIXON),5 offers robust image quality and excellent spatial resolution. 3T magnets have the advantage of higher signal-to-noise, which can be used to yield shorter acquisition times and/or increased image resolution.2 Multiplanar imaging, homogeneous fat suppression, and dynamic contrast-enhanced imaging are also routinely achievable on 3T MR platforms, all of which aid in lesion detection and characterization.
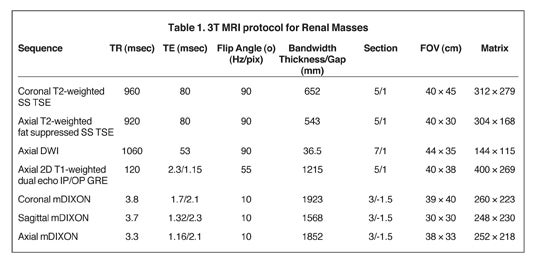
Our institutional 3T renal-mass evaluation protocol is performed with the patient supine with arms placed above his head using a 16-channel phased-array torso coil. Each sequence is obtained as a breathhold acquisition during patients’ end-expiration, which allows for more reproducible anatomic co-registration.2 Breath-hold times range from 16 to 22 seconds. Coaching prior to actual image acquisition helps improve breath-hold consistency with resultant successful postprocessing of the subtraction images.2 A gadolinium-based contrast agent (GBCA) is administered to patients with baseline estimated glomerular filtration rate (eGFR) >30 mL/min/1.73 m2 and without evidence for acute exacerbation of renal disease. The GBCA is administered intravenously via power injector at a dose of 0.1mmol/Kg or 0.1mL/Kg followed by a bolus of 20 mL of saline, both at an injection rate of 2 cc/second. The protocol is detailed in Table 1.
T2-weighted sequences
Half-fourier T2-weighted single shot turbo spin echo (SS TSE) images provide excellent image quality due to faster acquisition times than that of conventional multislice echo-train imaging offering a virtual breath-hold independent imaging strategy.2 However, breath-hold imaging or respiratory triggering with respiratory bellows (when necessary) is recommended to ensure proper anatomic registration of the images and coverage. Visualization of renal lesions can be optimized by improving the dynamic range when utilizing fat-suppression techniques.
Echo-planar with diffusion-weighted imaging
Echo-planar imaging (EPI) is utilized to obtain diffusion-weighted images (DWI) that allow for detection and characterization of lesions based on degree of restriction of water motion. The authors acquire images using respiratory triggering and multiple b values: b0, b50, b400, b800. Apparent diffusion coefficient (ADC) maps are generated based on the diffusion images.
T1-weighted sequences
Pre-contrast T1-weighted images include 2-dimensional (2D) dual echo in-phase (IP) and opposed-phase (OP) gradient-echo (GRE) images acquired in the axial plane.
Although dynamic imaging was traditionally performed utilizing 3-dimensional (3D) T1-weighted fat-saturated spoiled gradient-echo images, recently developed DIXON-based acquisitions, such as the mDIXON sequence, allow for more robust fat saturation (ie, fat-water separation) than traditional sequences that utilize frequency selective fat saturation techniques.6,7 The combination of parallel imaging strategies, such as SENSE, with the mDIXON technique allows for a fast volumetric acquisition of the abdomen with decreased motion artifacts due to shorter breath-hold times. Furthermore, the mDIXON technique offers the possibility of reconstructing the acquired data set as T1-weighted IP, OP, and fat-only images (without penalty of added acquisition time) in addition to the water-only images (ie, fat saturated), which are used for the dynamic contrast-enhanced portion of the study. Pre-contrast mDIXON acquisitions are obtained in oblique sagittal orientation along the long axis of each kidney and also in the coronal plane. Coronal ‘fat-saturated’ T1-weighted spoiled gradient-echo images (mDIXON) are then acquired during a properly timed corticomedullary phase using a real-time bolus tracking technique (BolusTrack, Philips Healthcare), and then during the early and late nephrographic phase at 40 and 90 seconds after the initiation of the corticomedullary phase. Sagittal oblique mDIXON images are again acquired along the long axis of each kidney during the excretory phase after the coronal dynamic acquisition. Finally, an axial mDIXON acquisition is obtained and ‘water only’ and ‘fat only’ image datasets are generated. Subtraction of the pre-contrast images from each of the post-contrast images produce subtracted volumetric image datasets, which are useful for assessing the presence of enhancement in a renal lesion.
Clinical applications
T2-weighted images
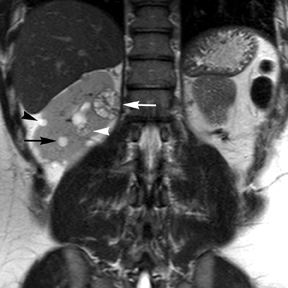
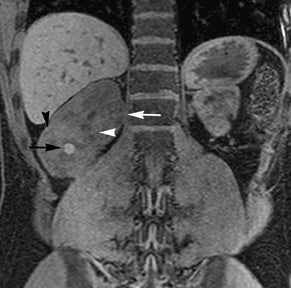
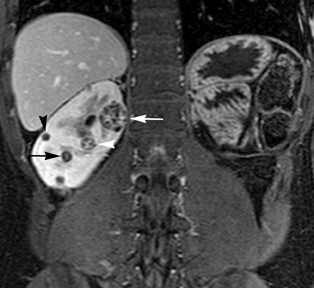
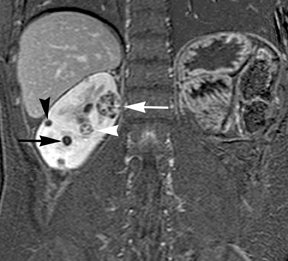
Simple cysts appear as homogeneously hyperintense thin-walled structures on T2-weighted images, while septations or solid elements appear hypointense relative to the hyperintense fluid (Figure1). Numerous thickened septations increase the likelihood of lesions being malignant.8 Hypointense lesions on T2-weighted images may represent solid lesions or cystic lesions with hemorrhagic or proteinaceous contents.9 Signal characteristics of solid lesions on T2-weighted images may suggest specific histologic subtyping. Clear-cell RCC, accounting for 65% to 80% of RCC,10 most commonly demonstrates increased signal intensity relative to the normal renal parenchyma on T2-weighted images.9 Intralesional necrosis, common in clear cell RCC,11 appears as moderate to high signal intensity on T2-weighted images, although it can occasionally appear hypointense.12 Intratumoral hemorrhage and fibrosis can be present and exhibits variable signal on T2-weighted images. Clear-cell RCC may present with a capsule or pseudocapsule, which is hypointense on T2-weighted images and discontinuity of the capsule suggests invasion of the perirenal fat and higher grade.9,13 Papillary RCC, accounting for approximately 10% to 15% of all RCC,14 demonstrate homogeneous low signal intensity on T2-weighted images,11 although it may also exhibit foci of hemorrhage and necrosis resulting in a more heterogeneous appearance.9 Predominantly fat-containing lesions, such as some angiomyolipomas (AMLs), appear hyperintense on T2-weighted images, and exhibit lower signal on T2-weighted fat-suppressed images. AMLs with minimal fat on the other hand, exhibit homogeneous hypointense signal relative to renal parenchyma on T2-weighted images, but should not demonstrate necrotic elements.9
In situations where administration of contrast is contraindicated, T2-weighted images may demonstrate the presence of tumor thrombus in the renal veins and IVC as a filling defect of increased signal intensity against background of dark flow voids.
Diffusion-weighted images
DWI allows for characterization of renal lesions as either solid or cystic based on their degree of restriction of water motion.15 This may be particularly helpful when intravenous contrast cannot be administered (allergies, renal failure, etc.), precluding evaluation for enhancement. A lesion that remains hyperintense on high b-value images and demonstrates low signal on ADC maps is more indicative of a solid rather than cystic lesion.15 However, restricted diffusion may be seen in hemorrhagic non-neoplastic contents within a cystic lesion. Although some authors have shown utility of ADC values in differentiation of benign lesions and RCC16 or between subtypes of RCC,17 there is considerable overlap in these results, and DWI is not considered as accurate as contrast-enhanced imaging at this time.16 Although DWI may aid in the detection of lymph nodes, malignant from benign lymph nodes cannot be reliably differentiated based on ADC values.18
T1-weighted images
Non-contrast T1-weighted dual-phase in-phased (IP) and opposed-phase (OP) gradient refocused echo (GRE) images, a form of chemical shift imaging, are particularly useful when evaluating renal lesions. Intracellular lipids are a relatively common histologic characteristic of clear-cell RCC (approximately 40% of tumors) and can be detected as foci of decreased signal intensity on the OP images when compared to the IP images.11,19 Low signal on OP images relative to IP images can be also seen in the setting of AMLs that contain only trace amounts of fat, however, those lesions are indistinguishable from clear cell RCC on these images; the presence of intravoxel fat (ie, decreased signal intensity on OP imaging compared to IP imaging) should not be considered diagnostic of AML as clear cell RCC can also exhibit this finding on MR imaging.20 AMLs with minimal fat, however, tend to be homogeneously hypointense on T2-weighted images compared to the renal parenchyma, whereas clear cell carcinomas tend to be heterogeneous hyperintense on T2-weighted images. The IP and OP phase images may also be helpful to confirm bulk fat in a lesion, which will appear as high signal on both sets of images, however, will exhibit a hypointense rim on OP images (India-ink or edge artifact) at its interface with normal renal parenchyma.9 Homogeneous high-signal intensity within a lesion on unenhanced T1-weighted images (without India-ink artifact at its interface with the adjacent renal parenchyma on OP images), as well as on fat-saturated T1-weighted images (Figure 1) is indicative of hemorrhagic or proteinaceous contents.
Contrast enhancement within a lesion after the administration of gadolinium is the most reliable way of differentiating solid from cystic lesions.21 Enhancement within a cystic lesion can differentiate debris from true solid tissue (Figure1). Contrast-enhanced T1-weighted images are also used to characterize the degree and pattern of enhancement, as this is a reliable differentiating factor between the three most common subtypes of RCC.22-24 During the corticomedullary phase, clear-cell RCC demonstrates avid enhancement, papillary RCC demonstrates relatively low grade enhancement, and chromophobe RCC demonstrates intermediate enhancement. A percentage SI change threshold of 84% in the corticomedullary phase has been shown to differentiate clear cell RCC from papillary RCC with 93% sensitivity and 96% specificity.23
Post-contrast imaging in the coronal or oblique sagittal planes is particularly helpful to detect small peripheral enhancing components within lesions that are predominantly cystic. Although most of these lesions containing “simple” fluid and small solid components represent low-grade clear-cell RCC, cystic lesions with internal hemorrhage and peripheral-papillary nodules are more likely to be papillary RCC.19 Other features, such as a delayed enhancing central scar, may favor diagnosis of oncocytoma rather than RCC.9
Besides small size, other challenges in detection of enhancing elements include pre-contrast high signal within lesions, which may either mimic or mask enhancing components. Subtraction imaging allows detection of enhancement above and beyond the native pre-contrast hyperintense signal within the lesion25 (Figure 1). It also allows for easier detection of low-grade enhancement in lesions, such as in papillary RCC.11 On the other hand, it may reveal lack of enhancement in a lesion that is hyperintense on post-contrast images owing to inherent high T1-weighted signal. Another potential confounding factor when evaluating a renal lesion on T1 pre- and post-contrast images may be inhomogeneous fat suppression. In addition to decreasing lesion-to-background contrast, inhomogeneous fat suppression can potentially mask enhancement when seen adjacent to the lesion in question. The authors have seen much more reliable and homogeneous exclusion of the fat signal on mDIXON images compared with 3D, T1, fat-suppressed GRE images.7 Furthermore, mDIXON acquisition allows for reconstruction of IP, OP, water-only (used for dynamic imaging) and fat-only image datasets. The fat-only reconstructed images may assist in detection of small amounts of intracellular lipid within lesions, not readily identified when comparing the 2-dimensional IP and OP GRE images.
Post-contrast images can help assess the renal vascular anatomy including the arterial supply to the kidney, which may have surgical implications, as well as the presence of tumor (ie, enhancing) and/or bland (ie, nonenhancing) thrombus with the renal vein and IVC.
Conclusion
MR imaging offers advantages over CT and US for characterization of renal masses and is especially attractive due to its lack of exposure to ionizing radiation, superior inherent contrast differentiation, and multiplanar capabilities. A robust high-quality MR protocol, such as the one outlined in this article, can help facilitate clinical management or provide viable options for imaging follow-up.
References
- Mourad WF, Dutcher J, Ennis RD. State-of-the-art management of renal cell carcinoma. American Journal of Clinical Oncology. Epub ahead of print Aug, 2012.
- Zhang J, Pedrosa I, Rofsky NM. MR techniques for renal imaging. Radiologic Clinics of North America. 2003;41:877-907.
- Birnbaum BA, Maki DD, Chakraborty DP,et al. Renal cyst pseudoenhancement: Evaluation with an anthropomorphic body CT phantom. Radiology. 2002;225:83-90.
- Maki DD, Birnbaum BA, Chakraborty DP, et al. Renal cyst pseudoenhancement:Beam-hardening effects on CT numbers. Radiology. 1999;213:468-472.
- Eggers H, Brendel B, Duijndam A, et al. Dual-echo Dixon imaging with flexible choice of echo times. Magnetic resonance in medicine: Official journal of the Society of Magnetic Resonance in Medicine / Society of Magnetic Resonance in Medicine. 2011;65:96-107.
- Perkins TG, Van Tilburg JL, Herigault G, et al. Preliminary clinical experience with a multiecho 2-point Dixon (mDixon) sequence at 3t as an efficient alternative for both the SARintensive acquired in- and out-of-phase chemical shift imaging as well as for 3D fat-suppressed T1-weighted sequence used for dynamic gadolinium-enhanced imaging. Proceedings, International Society for Magnetic Resonance Medicine. Stockholm, Sweden2010; p. 556.
- Sims RD, Yuan Q, Khatri G, et al. Multiecho 2-point Dixon (mDixon) imaging as an alternative to separate 2D chemical shift imaging and 3D fat-suppressed T1-weighted sequences for gadolinium enhanced imaging. Poster Presentation, International Society for Magnetic Resonance in Medicine. Melbourne, Australia 2012.
- Bosniak MA. The Bosniak renal cyst classification: 25 years later. Radiology. 2012;262:781-785.
- Pedrosa I, Sun MR, Spencer M, et al. MR imaging of renal masses: Correlation with findings at surgery and pathologic analysis. Radiographics: A review publication of the Radiological Society of North America, Inc. 2008;28:985-1003.
- Bostwick DG, Murphy GP. Diagnosis and prognosis of renal cell carcinoma: Highlights from an international consensus workshop. Seminars in Urologic Oncology. 1998;16: 46-52.
- Pedrosa I, Chou MT, Ngo L, et al. MR classification of renal masses with pathologic correlation. European Radiology. 2008;18:365-375.
- Eilenberg SS, Lee JK, Brown J, et al. Renal masses: Evaluation with gradient-echo Gd-DTPA-enhanced dynamic MR imaging. Radiology. 1990;176:333-338.
- Yamashita Y, Watanabe O, Miyazaki T, et al. Cystic renal cell carcinoma. Imaging findings with pathologic correlation. Acta Radiol. 1994;35:19-24.
- Leroy X, Zini L, Leteurtre E, et al. Morphologic subtyping of papillary renal cell carcinoma: Correlation with prognosis and differential expression of MUC1 between the two subtypes. Modern Pathology: An official journal of the United States and Canadian Academy of Pathology, Inc. 2002;15:1126-1130.
- Qayyum A. Diffusion-weighted imaging in the abdomen and pelvis: Concepts and applications. Radiographics: A review publication of the Radiological Society of North America, Inc. 2009;29:1797-1810.
- Taouli B, Thakur RK, Mannelli L, et al. Renal lesions: Characterization with diffusion-weighted imaging versus contrast-enhanced MR imaging. Radiology. 2009;251:398-407.
- Wang H, Cheng L, Zhang X, et al. Renal cell carcinoma: Diffusion-weighted MR imaging for subtype differentiation at 3.0 T. Radiology. 2010;257:135-43.
- Kwee TC, Takahara T, Luijten PR, et al. ADC measurements of lymph nodes: inter- and intra-observer reproducibility study and an overview of the literature. European Journal of Radiology. 2010;75:215-20.
- Pedrosa I, Alsop DC, Rofsky NM. Magnetic resonance imaging as a biomarker in renal cell carcinoma. Cancer. 2009;115(10 Suppl):2334-45.
- Hindman N, Ngo L, Genega EM, et al. Angiomyolipoma with minimal fat: Can it be distinguished from clear cell renal cell carcinoma with standard mr imaging techniques? In press Radiology.
- Rofsky NM, Bosniak MA. MR imaging in the evaluation of small (< or =3.0 cm) renal masses. Magnetic Resonance Imaging Clinics of North America. 1997;5:67-81.
- Kim JK, Kim TK, Ahn HJ, et al. Differentiation of subtypes of renal cell carcinoma on helical CT scans. AJR American J Roentgenol. 2002;178:1499-1506.
- Sun MR, Ngo L, Genega EM, et al. Renal cell carcinoma: Dynamic contrast-enhanced MR imaging for differentiation of tumor subtypes—correlation with pathologic findings. Radiology. 2009;250:793-802.
- Vargas HA, Chaim J, Lefkowitz RA, et al. Renal cortical tumors: Use of multiphasic contrast-enhanced MR imaging to differentiate benign and malignant histologic subtypes. Radiology. 2012;264:779-788.
- Hecht EM, Israel GM, Krinsky GA, et al. Renal masses: Quantitative analysis of enhancement with signal intensity measurements versus qualitative analysis of enhancement with image subtraction for diagnosing malignancy at MR imaging. Radiology. 2004;232:373-378.