Multidetector CT of valvular heart disease
Images

Dr. McGinley is a third-year Radiology Resident at Stanford University Medical Center, Stanford, CA. He completed his undergradulate and master's training in Mechanical Engineering with research interests in Biomechanics and Cardiovascular Function. He completed the MD/PhD program at Temple University in Philadelphia, PA. His thesis project addressed the progression of cardiac dysfunction in the setting of functional mitral valve regurgitation.
Multidetector computed tomography (MDCT) imaging of the cardiac valves has advanced significantly with the development of 16- and 64-detector scanners. Early MDCT imaging was primarily used to assess valvular calcifications; however, with improved temporal resolution, current scanners can visualize subtle anatomy and can also evaluate valve function. With advancing technology, the role of MDCT as a convenient and accurate imaging modality is increasing in both preoperative assessment and the evaluation of postsurgical patients with valvular disease.
Technologic advancements in computed tomography (CT) from the early single-detector scanners presented by Ledley et at 1 in 1974 to current 64-detector scanners have resulted in temporal and spatial resolutions capable of accurately evaluating cardiac valvular anatomy and disease. Early attempts at cardiac imaging in the late 1970s were limited by the poor temporal resolution of the single-detector scanners that required at least 1 second to scan each individual slice. 2-4 Throughout the 1980s and 1990s, development of the electron-beam CT (EBCT) scanner resulted in marked improvement of spatial and temporal resolution, which allowed accurate assessment of cardiac motion and anatomy. 5,6 By the mid 1990s, development of helical and multislice scanners began the technologic push toward 64-detector helical scanners with spatial resolutions of 0.4 to 0.6 mm and temporal resolutions of 90 to 180 msec. 7
Aortic valve calcification and stenosis
Initial studies of multidetector CT (MDCT) to evaluate the cardiac valves focused on valve calcification and its association with aortic stenosis (AS). 8 The prevalence of nonrheumatic calcific AS in the elderly ranges from 2% to 7%, which makes it the most common valvular heart disease in patients 65 and older. 9 The imaging features of AS include left ventricular (LV) hypertrophy, dilatation of the ascending aorta, and valvular calcification. 10 The pathology of AS is based upon one of two general categories: congenital disease and acquired degenerative disease. The pattern of calcification differs based upon the disease process. With congenital aortic valve disease, calcification tends to deposit along the commissural edges of the leaflets. In acquired degenerative disease, calcification tends to be more severe and develops within the annulus and leaflets. 10 Koos et al 11 evaluated the prevalence of aortic valve calcification that was incidentally detected on MDCT scans. The study retrospectively evaluated CT scans in 402 patients who also underwent echocardiographic evaluations. The CT scans were performed on 4-detector (181 patients) and 16-detector (215 patients) scanners. A total of 18% of patients had incidental calcifications of the aortic valve, and the grade of calcification correlated with echocardiographic measurements of mean and peak transvalvular gradient. 11 Previous studies have established the importance of aortic valve calcification re porting moderate-to-severe calcification as a strong, independent predictor of adverse clinical outcomes 12 as well as the correlation between severity of calcification and the severity of AS. 13-15
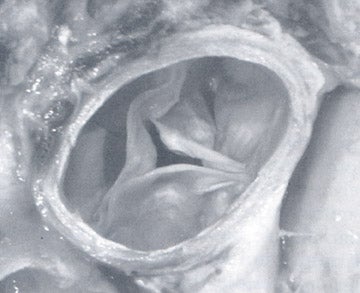
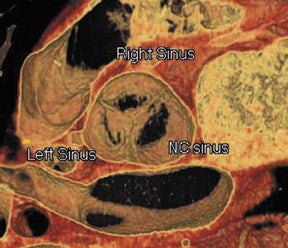
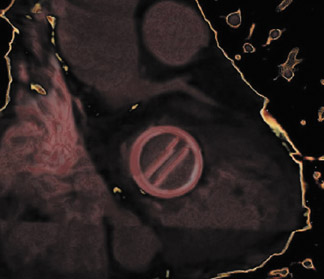
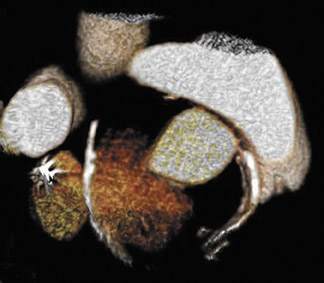
Figure 1 illustrates the normal appearance of the aortic valve. The aortic valve apparatus consists of the cusps, sinuses, commissures, and coronary artery ostia. The sinuses include the right coronary, left coronary, and posterior noncoronary sinus. Figure 1A depicts a normal cadaveric specimen of the aortic valve as viewed from the base of the heart. Figure 1B presents a 3-dimensional axial oblique representation of the aortic valve in diastole imaged with a 64-detector CT scanner. Scan parameters include 1-mm slice thickness with 10% reconstructions of the R-R interval from 0% to 90%. Three-dimensional reconstructed images were produced using commercially available software.
Previous studies of CT evaluation of the aortic valve have reported a correlation between aortic valve calcification severity and transvalvular gradients. 15-19 Liu et al 20 investigated the correlation between the severity and location of aortic valve calcification with echocardiographicly determined pressure gradients. This retrospective study evaluated 115 patients with aortic valve calcification incidentally noted on chest CT performed on 4 single-detector scanners and one 4-detector scanner. All patients had also undergone transthoracic echocardiography (TTE). The severity of valvular calcification correlated with both increased mean and peak pressure gradients across the aortic valve (r = 0.70 to 0.78). 20 Furthermore, this study found the highest correlation with calcification of the peripheral left-posterior commissure and central right-left commissure.
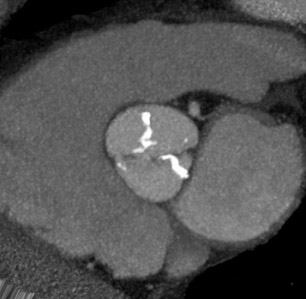
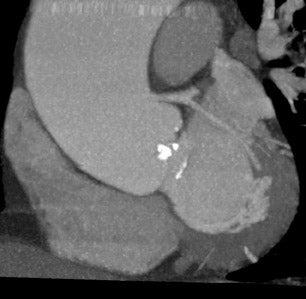
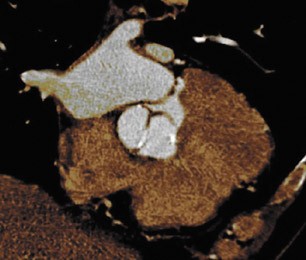
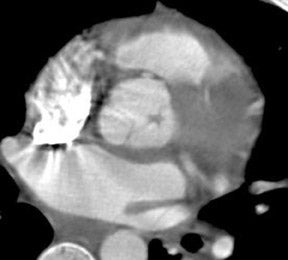
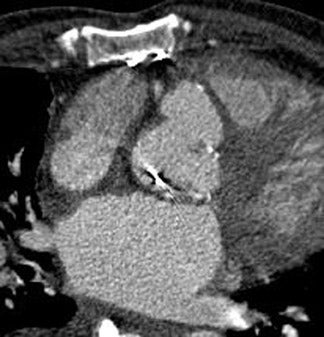
The progression of AS is faster in patients with severely calcified valves. 12,21 Previous studies have shown a correlation between the calcification score and the rate of disease progression. 22 The extent and association of aortic valve calcification in patients with AS was investigated by Cowell et al. 16 A total of 157 patients with known AS (that had been documented on echocardiography) were evaluated using helical MDCT scans. The calcium score, as determined with automated software, correlated with the aortic postvalve velocity and peak gradient. 16 All patients with severe AS had calcium scores >3700 AU. Figure 2 presents a contrast-enhanced, electrocardiographic (ECG)-gated, 64-detector CT evaluation of a patient with aortic valve calcification incidentally noted on a coronary examination. Axial and sagittal oblique images reveal valvular calcification primarily along the commissures.
The use of intravenous contrast for the evaluation of valve morphology and calcification is debated. Most authors agree that the use of contrast is beneficial for the evaluation of valve morphology. 23,24 However, there is debate regarding the use of contrast in assessing aortic valve calcification. Mühlenbruch et al 23 found that the quantification of aortic valve calcification was not reliable with the use of intravenous contrast because contrast material can simulate calcium. In a small cohort of patients, Willmann et al 24 reported no significant difference between the accuracy of calcium assessment using nonenhanced and contrast-enhanced studies as compared with assessment at the time of surgery.
Gated MDCT has been shown to provide an accurate assessment of valvular calcification compared with the quantity of calcium in the surgical specimens. 25 The accuracy of CT quantification of valvular calcium was investigated in vitro by Boughner et al. 26 A total of 24 human aortic valve cusps were obtained from autopsy specimens and were scanned in multiple projections with a quantitative computed microtomograph. The findings were compared with a densitometry scan and standard control specimens. The study reported an excellent correlation between the 2 quantitative measurements (R2 = 0.94) with a total calcium content ranging from 0 to 15 mg. 26
Recent studies have investigated the use of 64-detector CT scanners to analyze aortic valve anatomy and pathology. Pannu et al 27 retrospectively evaluated 4-dimensional images of the aortic valve in 20 patients to assess valve visibility, number of leaflets, valve motion, and calcification. The parameters used were 0.6-mm detector collimation, 0.75-mm-thick slices, and 0.4-mm intervals with 80 mL of nonionic isosmolar contrast on a 64-detector CT scanner. Images were reconstructed at 10% segments of the R-R interval. This study found excellent valve visualization in all 20 patients during systolic and diastolic phases of the cardiac cycle with 3 valve leaflets present in all pa-tients. 27 Valve motion was also evaluated because of the increased temporal resolution of the 64-detector CT scanner. The findings suggest that MDCT is a potential alternative to echocardiography for the assessment of the valve orifice area; however, radiation dose (approximately 12 mSv) is a limitation of the study.
Congenital aortic valve anomalies
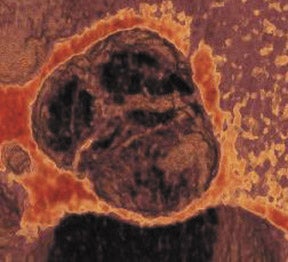
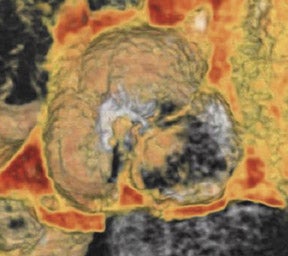
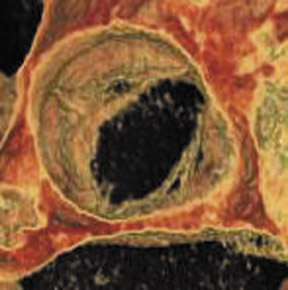
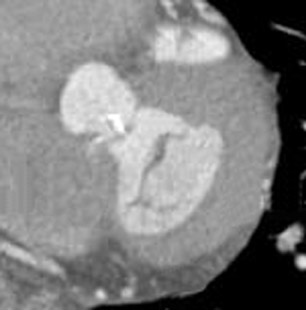
Bicuspid aortic valve is the most common congenital cardiac anomaly and occurs in 1% to 2% of the general population. 28 The patient may be asymptomatic for many years and present later in life with degenerative fibrosis and calcification that results in AS. Patients with bicuspid valves present earlier than patients with degenerative tricuspid aortic valves. The bicuspid valve cusps are usually symmetric in size, often with a ridge across 1 cusp, which represents a false commissure. Figure 3 presents several images of patients with congenital bicuspid aortic valves with a 64-detector CT scanner. Figure 3A is an axial view of the bicuspid aortic valve from a 67-year-old patient with a sinus of Valsalva aneurysm. There is calcification along the valve commissures and annulus. Figure 3B depicts a bicuspid aortic valve with fusion of the right and left coronary cusps. There is a prominent calcified ridge (a false commissure) in the area where the commissure should have formed. Figures 3C and 3D are volume-rendered images of a bicuspid valve in diastole and systole. In the systolic phase (Figure 3D), the valve orifice assumes an ellipsoid configuration with marked narrowing resulting in moderate-to-severe stenosis in this patient. When evaluating a bicuspid aortic valve for potential surgical planning, it is important to assess the degree of calcification and the presence of sinus of Valsalva aneurysms. With significant valve calcifications, root replacement and coronary reimplantation may be required. 29
In addition to congenital bicuspid aortic valves, there may also be unicuspid or quadricuspid valves. These types of anomalies are much less common than bicuspid valves. The literature reports the incidence of a quadricuspid aortic valve (QAV) in the range of 0.003% to 0.043%. 30 In contrast to the stenotic bicuspid aortic valve, the most common physiologic abnormality in a QAV is valvular incompetence. 31 Jacobs et al 32 presented a case report on QAV imaging using a 64-detector CT scanner with correlation of echocardiographic imaging. This report presented excellent visualization and characterization of the valve anomalies using a contrast-enhanced protocol with a slice thickness of 0.75 mm and a reconstruction interval of 0.5 mm. The authors described an incompetent QAV with mildly thickened leaflets and incomplete coaptation. 32 Findings were confirmed by a previous TTE.
Aortic valve regurgitation
Assessment of aortic valve insufficiency is based on secondary findings of incomplete valve coaptation in the diastolic phase, 19 LV dilatation, and aortic dilation. 10 Recent studies evaluating aortic and mitral valve (MV) regurgitation describe the methodology of quantifying the regurgitant volume for single-valve disease based on the difference in stroke volume between the regurgitant ventricle and the normal ventricle. 7,33 This methodology is inaccurate with multivalve disease. 34
Mitral valve morphology
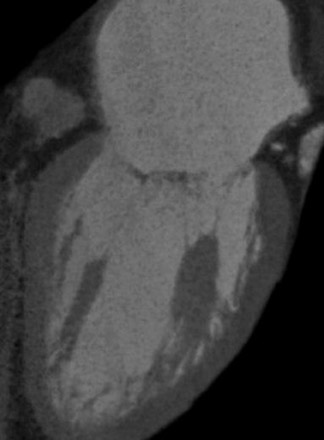
The MV apparatus consists of the mitral annulus, the posterior and anterior cusps, chordae tendineae, and the LV papillary muscles. With improved surgical techniques, the importance of early identification of MV disease is increasing. Few studies have been published investigating the MDCT characteristics of MV disease. A study by Willmann et al 25 evaluated MV morphology using a retrospectively ECG-gated 4-detector CT scanner; however, the technique was somewhat limited, as it provided only 2-dimensional static images of the MV apparatus. A more recent study by Alkadhi et al 35 evaluated the MV apparatus in 37 patients with normal valve anatomy as shown on transesophageal echocardiographic (TEE) studies. The authors retrospectively used data obtained from contrast-enhanced 16-detector CT that was being performed for coronary artery disease. CT images were reconstructed using a slice thickness of 1 mm at an increment of 0.5 mm at 5% increments of the RR interval. The images were independently reviewed by 2 observers and offered excellent visualization of the leaflets, zone of apposition, commissures, annulus, chordae tendineae, and papillary muscles during all phases of the cardiac cycle. Superior visualization was seen in the perpendicular long axis compared with the parallel short-axis images. 35 Figure 4 illustrates the normal MV apparatus obtained from a ECG-gated 64-detector CT scanned with intravenous contrast and reconstructed at 1-mm-thick sections. The anterior and posterior leaflets are visualized in the systolic phase of the cardiac cycle (Figure 4A). In the coronal plane, Figure 4B, the papillary muscles and chordae tendineae are seen with the normal attachments to the MV leaflets.
Mitral valve calcification and stenosis
Mitral valve stenosis is most commonly results from degenerative changes of rheumatic heart disease. Chronic, progressive fibrosis results in leaflet thickening, calcification, and fusion. 36 Eval- uation of MV calcification uses identical methodology as the aortic valve assessments. Similarly, evaluation of MV stenosis is based upon measurements of the maximal orifice in the diastolic phase of the cardiac cycle. Cardiac changes related to chronic MV stenosis include left atrial enlargement with a morphologically normal LV. Secondary findings may include pulmonary vein dilatation, pulmonary hypertension, and right ventricular hypertrophy. Budoff et al 37 investigated the reproducibility of CT mea- surements of mitral annulus calcification and measurements of aortic calcification. The study data was collected using 2 CT scans performed on either an EBCT or 4-detector CT scanner at the same appointment for the evaluation of coronary artery calcification. A total of 100 patients were included in the analysis, 99 of whom had 2 scans successfully performed. The study reported excellent intra-reader and inter-reader variability for the evaluation of mitral annulus calcification. However, the interscan variability was somewhat higher (28% to 33%); this was suggested to be secondary to valve motion. 37
Mitral valve regurgitation
Findings in MV regurgitation (MVR) vary depending upon the chronicity and etiology. 38 Acute MVR may demonstrate only left atrial hypertension and interstitial pulmonary edema with incomplete coaptation of the valve leaflets on CT. 36 With chronic MVR there is enlargement of the left atrium and LV with associated myocardial thickening. 36,39,40 Initial studies on MVR quantification that used CT used EBCT scanners. 41-43 In a study of 43 patients using EBCT, compared with TTE, Lembcke et al 42 reported good agreement in measurements of total LV stroke volume, antegrade stroke volume, mitral regurgitation volume, and regurgitant fraction. In 2004, Lembcke et al 43 again confirmed the accuracy of EBCT in quantifying MVR when compared with LV catheterization in a study of 50 patients.
Historically, MDCT evaluation of MVR has been limited by poor temporal and spatial resolution as compared with EBCT and magnetic resonance imaging (MRI). Alkadhi et al 33 used an ECG-gated 16-detector CT to quantify MVR in a study of 44 patients. A total of 19 patients with MVR and 25 without MVR based on TEE and ventriculography were imaged prospectively using a contrast-enhanced protocol with images reconstructed at 5% increments of the R-R interval and a slice thickness of 1 mm, with an increment of 0.5 mm. Two experienced readers assessed the images blindly and measured the maximal regurgitant orifice area of the MV. Assessment of the MV apparatus was also noted with the evaluation of annulus calcification, leaflet thickening and calcification, valve prolapse, and rupture or thickening of the chordae tendineae and papillary muscles. The results of the study indicated a significant correlation between the regurgitation orifice area measured by CT with findings from TEE and ventriculography (r = 0.807 and 0.922, respectively). 33 Furthermore, there were no false-positive or -negative findings of MVR in this limited study group. There was excellent agreement in the morphologic features of the MV apparatus between the imaging modalities, suggesting that MDCT is an accurate alternative to TEE in the evaluation of MV disease.
Tricuspid and pulmonary valve disease
Since current MDCT contrast protocols are based on the evaluation of coronary artery disease, limited information is available on right-heart valve disease. With the current use of saline chaser techniques, the contrast becomes diluted in the right heart with limited visualization of the tricuspid and pulmonary valves. If known right-sided valve disease is to be evaluated, a mixture of contrast and saline could be used or a slow infusion of contrast can be used following the initial bolus. 7 One of the more common valvular abnormalities of the right heart is tricuspid valve regurgitation (TVR) caused by pulmonary hypertension resulting in right ventricular hypertrophy and dilation. Additional abnormalities of the tricuspid valve that may be evaluated using MDCT include Ebstein's anomaly and changes related to Marfan's syndrome. 7,34,44 With Ebstein's anomaly, there is downward displacement of the valve leaflets that results in TVR and atrialization of a portion of the right ventricle. In Marfan's syndrome, numerous valvular anomalies may be present; involvement of the tricuspid valve results in floppy redundant leaflets with valve incompetence. Diseases of the pulmonic valve are less common than aortic and MV disease. Most etiologies of pulmonary valve disease are congenital in nature including congenital pulmonic stenosis in the setting of tetralogy of Fallot. 45,46
Valvular endocarditis
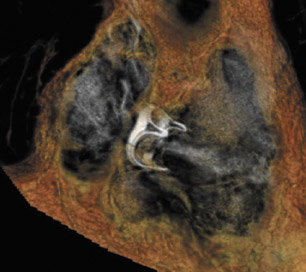
Acute infections of the cardiac valves caused by staphylococci or fungi may rapidly progress, resulting in diffuse valve destruction. Less virulent infections by Streptococcus viridans result in a slower progressive clinical decline. Large vegetations may result in functional stenosis of the valve, whereas valve deformation and destruction may cause valve incompetence. Patients classically present with congestive heart failure, fever, and systemic emboli. 47 Figure 5 presents a 64-detector CT image of vegetation on the noncoronary cusp of the aortic valve. CT findings are consistent with a soft tissue mass involving the valve apparatus with secondary findings of stenosis or regurgitation. Gilkeson et al 19 published an update of MDCT imaging of aortic valve disease with several representative images of patients with valve vegetations secondary to previous valve replacement and systemic lupus erythematosus.
Postsurgical cardiac valves
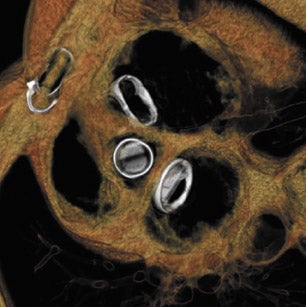
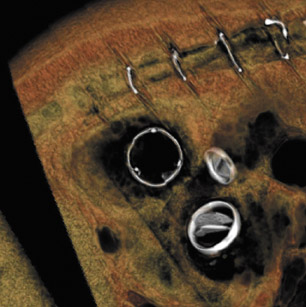
With improved surgical techniques, advanced age is no longer an absolute contraindication to valve replacement surgery. Results of a study of 105 patients by Morgan-Hughes et al 15 indicated excellent long-term postoperative survival and quality of life in patients ranging from 75 to 89 years of age who underwent valve replacement surgery. Increasing numbers of patients with valvular replacements will require imaging assessment to determine postsurgical planning and to assess valve function. Improved imaging characteristics have resulted in excellent postoperative visualization of valve prostheses 19,23 with decreased metallic artifacts. Figure 6 presents several postoperative images obtained on a 64-detector CT scanner. Figure 6A is an 3-mm reconstructed short-axis image of a prosthetic MV showing the open valve leaflets during diastole. Figures 6B and 6C illustrate 2-mm-thick sections of a bioprosthetic tricuspid valve replacement showing the metallic leaflet supports with minimal streak artifact. Figure 6D and 6E are 2 images of a patient with a prosthetic mitral and aortic valve with a bioprosthetic tricuspid valve in the diastolic phase of the cardiac cycle.
Postsurgical complications of valvular repair and replacement can also be evaluated using MDCT. A case report by Ghersin et al 48 described pseudoaneurysm formation following aortic valve replacement. In this patient, images obtained throughout the cardiac cycle allowed dynamic evaluation of the lumen with expansion during systole and complete collapse in diastole. 48 Figure 7 depicts pseudoaneurysm formation following prosthetic aortic valve replacement. CT allows accurate assessment of the 3-dimensional orientation of the collection as well as the dynamic changes during the cardiac cycle. Additional roles of MDCT in postsurgical patients include the evaluation of abscess formation and valve dehiscence, providing both anatomic and dynamic information important to surgical planning.
Conclusion
Technologic advancements over the past 3 decades have resulted in markedly improved imaging of the cardiac valves. Current temporal resolutions of 90 to 180 msec with a spatial resolution of 0.4 to 0.6 mm result in accurate as-sessment of valve morphology and function. Compared with MRI, MDCT has a significantly higher spatial resolution, which provides excellent visualization of the delicate valve anatomy. In addition, fast scan times (approximately 10 seconds) make MDCT a much more readily available modality for imaging the growing population of patients with valvular disease. The primary limitation of current MDCT scanners is the radiation dose (approximately 13 to 21 mSv). 35,49-51 Current contrast-bolus techniques for coronary artery imaging limits visualization of the right-heart structures; however, this can be overcome with a dedicated scan of the right-heart valves or using a mixed or slow contrast infusion. MDCT offers excellent visualization of the postoperative valve prosthesis with minimal artifact using current imaging technique. With excellent image quality and speed of image acquisition, MDCT is a potential alternative to invasive TEE studies and the limited spatial resolution of MRI.