MRI Evaluation of masses in the noncirrhotic liver
Images
Magnetic resonance imaging (MRI) has emerged as an important imaging modality for the assessment of hepatic masses. Faster sequences now allow high-quality liver imaging with high intrinsic soft-tissue contrast. Automated contrast-detection methods combined with faster sequences allow reproducible capture of the arterial phase, which is essential for the detection and characterization of many hepatic lesions. The lack of ionizing radiation permits routine use of gadolinium-enhanced three-dimensional (3D) fat-suppressed multiphasic imaging with high temporal and spatial resolution.1
A comprehensive MR imaging examination in this setting includes T2-weighted and chemical shift T1-weighted imaging, diffusion weighted imaging and gadolinium-enhancement-pattern assessment, characteristic enhancement patterns that can be helpful in the diagnosis of most of these lesions. These patterns can be seen during particular phases of contrast-enhanced imaging and include arterial-phase or delayed-phase enhancement, peripheral washout, ring enhancement, nodule-within-a-nodule enhancement, true central scar, pseudo central scar and pseudo capsule. The combination of findings from different sequences often helps pinpoint the etiology of a liver mass. Familiarity with these enhancement patterns and mass characteristics in various sequences can help in the identification of specific focal lesions of the liver. Sometimes large lesions can be diagnostically challenging as some benign lesions can masquerade as malignant masses. This article focuses on large and geographic hepatic lesions with a primary focus on typical and atypical features of these masses.
MRI is the imaging test of choice for liver-mass characterization, demonstrating similar if not superior performance to CT. The incidence of focal liver lesions parallels growth in imaging utilization. The majority of liver masses arising in noncirrhotic livers are benign. Hemangiomas, focal nodular hyperplasias (FNH), and adenomas (HCA) are the most commonly encountered solid benign lesions.2-4 The most commonly encountered malignant lesions in noncirrhotic livers are metastases.5
Basic MRI protocol for liver masses
At the authors’ institution, the following sequences are used as the standard techniques for MRI of the liver:
- Coronal ultrafast spin-echo sequence (single breath-hold), which serves as a localizer and provides an overview of the anatomy. T2-weighted images help characterize lesions.
- Axial fast spin-echo (T2-weighted) images through the liver. Fat-saturated (frequency selective) images increase the conspicuity of liver lesions.
- Axial 2D dual spoiled gradient-recalled echo sequence (SPGR) (both out-of-phase and in-phase imaging during a single breath-hold). This provides T1 information and helps detect focal or diffuse fatty infiltration (loss of signal on out-of-phase sequence).
- Diffusion-weighted sequences using b-values of 0,500 and 1000 with ADC maps.
- THRIVE SPGR sequences with fat saturation without and with contrast. This sequence is valuable for the detection and characterization of lesions on the basis of their enhancement patterns. Additional delayed imaging is performed with Eovist (Gadotexetate disodium, Bayer HealthCare Pharmaceuticals Inc, Wayne, NJ-07470, Mfd. in Germany), if needed. The unenhanced images can be subtracted from those obtained after contrast administration to better assess enhancement characteristics.
Benign masses
Hemangioma
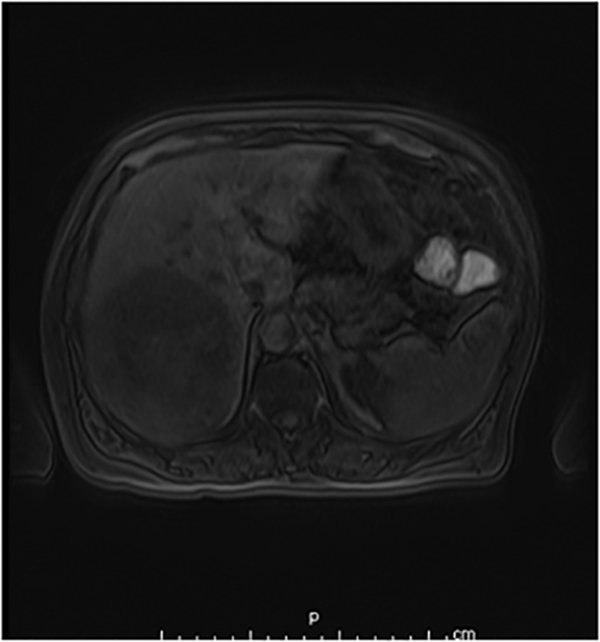
Hemangioma is the most common benign hepatic tumor. The prevalence of hemangioma in the general population ranges from 1%–2%;6 the female-to-male ratio varies from 2:1 to 5:1. Because hepatic hemangiomas are frequent, are most often asymptomatic, and have a very low rate of complications, this lesion does not require surgical resection.
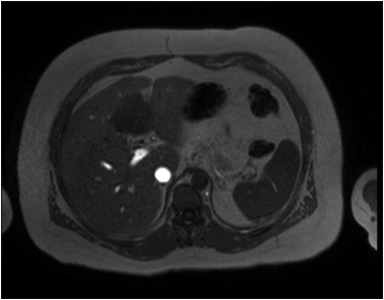
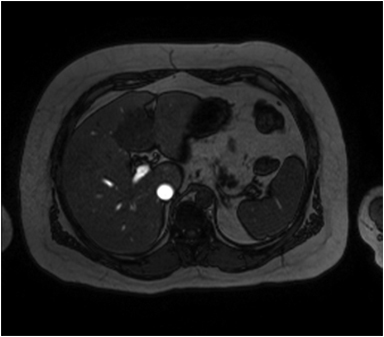
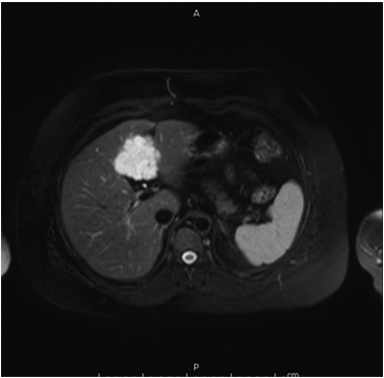
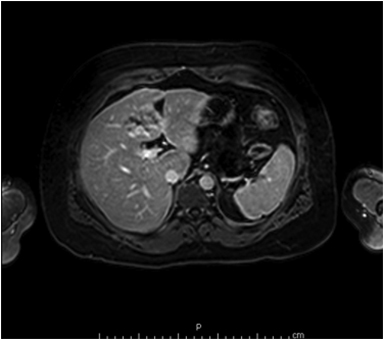
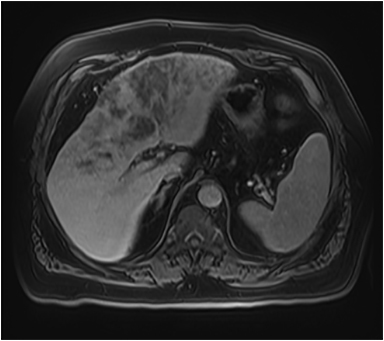
Hemangiomas are composed of endothelial-cell–lined vascular channels with a supporting fibrous stroma. Hemangiomas demonstrate smooth, round, or lobular margins (Figures 1A,1B).7 On T2-weighted images (Figure 1C), hemangiomas are hyperintense, approaching the signal intensity of cerebrospinal fluid.7 Three types of contrast enhancement patterns are present in dynamic examinations: early homogenous enhancement and persistence of enhancement in the late phase (type 1); peripheral nodular enhancement (Figure 1D), centripetal dynamic uniform enhancement (type 2); peripheral nodular enhancement, centripetal dynamic enhancement, and non-enhancing central scar tissue in the late phase (type 3).8 Centripetal enhancement (Figure 1E) is the most common enhancement pattern.7 Immediate homogenous enhancement is seen in some hemangiomas smaller than 1.5 cm, rapid filling-in of these smaller hemangiomas is thought to be related to the smaller vascular spaces and larger interstitium present in these lesions.9 On delayed gadolinium-enhanced images, regions of persistent central hypointensity in comparison with liver may be present in hemangiomas larger than 5.0 cm.7 Heterogeneity of large or giant hemangiomas is related to the presence of hemorrhage, thrombosis, extensive hyalinization, liquefaction, and fibrosis.10 On T2-weighted images, the central cleft-like portion of large hemangiomas is hyperintense in comparison with the remainder of the mass and corresponds to the region of hypointensity on the gadolinium-enhanced images reflecting cystic degeneration or liquefaction.11
Focal nodular hyperplasia
Focal nodular hyperplasia (FNH) of the liver is among the most common hepatic neoplasms. With current advances in radiologic imaging, it has become an even more frequent diagnosis. FNH typically presents as a single lesion in 70% of patients and with two to four lesions in the remaining 30%.12 FNH is more common in premenopausal women, although up to 10% may occur in men.13 These lesions are often detected incidentally during imaging for non-specific abdominal symptoms. Once the diagnosis has been established, active treatment is almost never required.
The pathogenesis of FNH is unclear; however, Wanless et al14 have suggested that FNH develops as hyperplastic nodules caused by blood flow in an anomalous hepatic artery branch. Kondo15 has also proposed that FNH lesions are a result of regional abnormalities in either portal or hepatic arterial blood flow. Certainly FNH lesions are characterized macroscopically by the presence of abnormal, dilated capsular blood vessels.16 They are known to occur simultaneously with other vascular hepatic lesions such as hemangiomas and adenomas17 and their incidence may be increased following blunt abdominal trauma18 and chemotherapy,19both of which are associated with intrahepatic vascular damage. In addition, an Italian case control study found that cigarette smoking was an indicator of elevated risk of FNH.20 Currently, FNH is divided into two types: classic and nonclassic. The nonclassic type contains three subtypes: (a) telangiectatic FNH, (b) FNH with cytologic atypia, and (c) mixed hyperplastic and adenomatous FNH.16
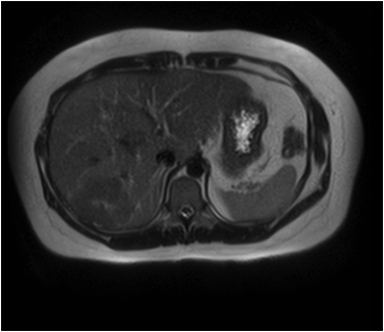
The lesion varies from mildly hypointense to isointense on T1-weighted (Figures 2A, 2B) MRI and from mildly hyperintense to isointense on T2-weighted images. Unlike fibrolamellar HCC, the central scar in FNH is not a true scar, but represents a confluence of blood vessels, bile ducts, and sometimes a focal area of fibrosis. This “central scar” (Figure 2C and 2D) is characteristically hyperintense on T2-weighted images. The mild hyperintensity of the lesion on T2-weighted images may be related to the presence of vascular channels or edema throughout the lesion. FNH is perfused by the hepatic arterial system and shows marked, nearly uniform arterial phase enhancement (Figure 2E). The degree of lesion enhancement lessens on subsequent contrast-enhanced images, with lesion signal intensity approaching that of the surrounding liver parenchyma. The central scar has low signal intensity on early phase contrast-enhanced images, but gradually enhances to become hyperintense relative to the rest of the lesion on delayed phase images (Figure 2F).21
Hepatic adenoma
Although the precise pathogenic mechanism leading to hepatic adenomas is still unknown, the use of estrogen-containing3 or androgen-containing4 steroid medications clearly increases their prevalence, number, and size within the affected population and often within individual patients. Moreover, this causal relationship is related to dose and duration, with the greatest risk encountered in patients taking large doses of estrogen or androgen for prolonged periods of time.4 In women who have never used oral contraceptives, the annual incidence of hepatic adenoma is about 1 per million. This increases to 30 – 40 per million in long-term users of oral contraceptives.22
Small HCA is generally asymptomatic. Right upper abdominal quadrant fullness or discomfort is present in 40% of cases due to mass effect. Typical clinical manifestation is spontaneous rupture or hemorrhage leading to acute abdominal pain with possible progression to hypotension and even death. HCA rarely undergoes malignant transformation to hepatocellular carcinoma (HCC).
Image-guided biopsy or surgical resection with histopathologic and immunohistochemical analysis is necessary for complete characterization of HCAs but MR imaging plays an important role in diagnosis and subtype characterization as well as identification of complications and surveillance.23,24
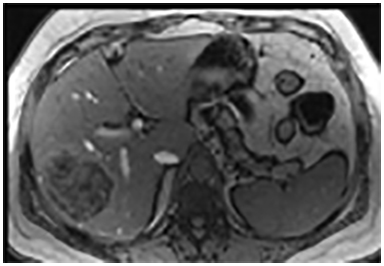
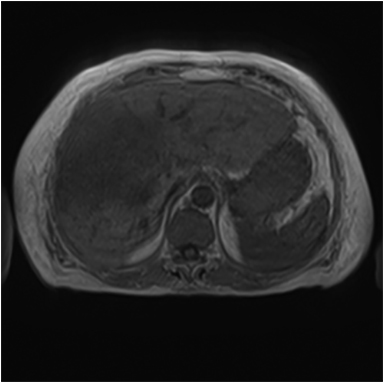
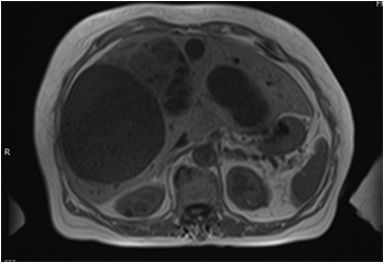
On MRI, adenomas have variable signal intensity but can show hyperintense foci on unenhanced T1-weighted images (Figures 3A, 3B) secondary to hemorrhage or intracellular lipid. The visualization of fat within the lesion on fat-suppressed or opposed-phase T1-weighted images (Figure 3B) helps distinguish an adenoma from FNH. On T2-weighted images, hepatic adenomas can have variable signal intensity, but they are often mildly hyperintense relative to the liver. On dynamic contrast-enhanced images, adenomas show heterogeneous hypervascularity during the arterial phase (Figure 3C). These masses often show no washout of contrast material, becoming isointense to the liver parenchyma on portal venous and subsequent dynamic series, and they may have a delayed-enhancing pseudocapsule.24
Geographic fatty liver
Geographic fatty liver disease is a frequently encountered variant of hepatic steatosis. Different geographic patterns can be attributed to specific causes. For example, fat accumulation sometimes occurs only in the right lobe. One hypothesis to explain this distribution is that blood from the superior mesenteric vein containing lipogenic alimentary factors that are preferentially distributed to the right lobe.25 Geographic patterns may be secondary to an insult to the liver parenchyma. For example, fatty liver deposition can be distributed in territories previously affected by cholangitis.
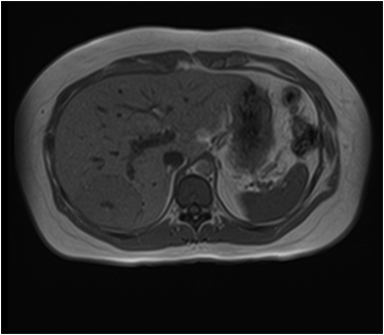
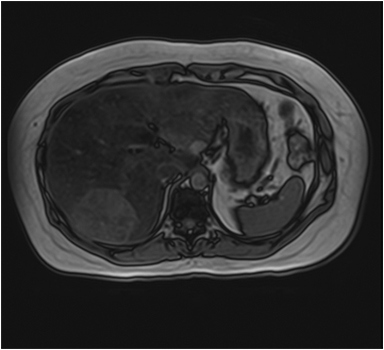
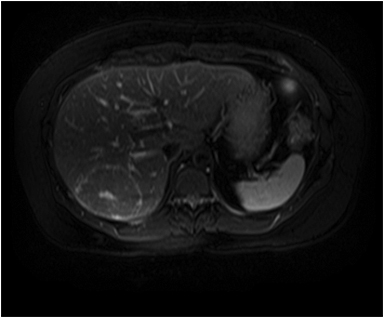
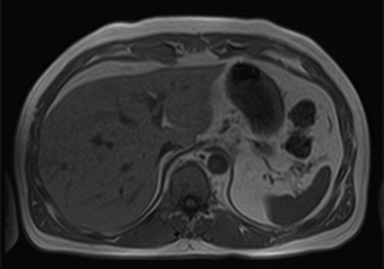
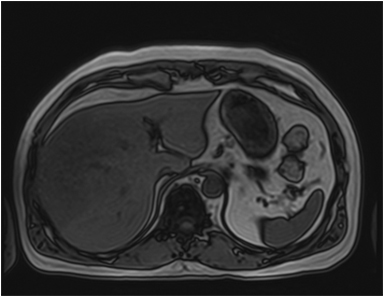
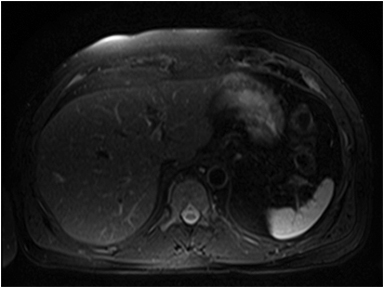
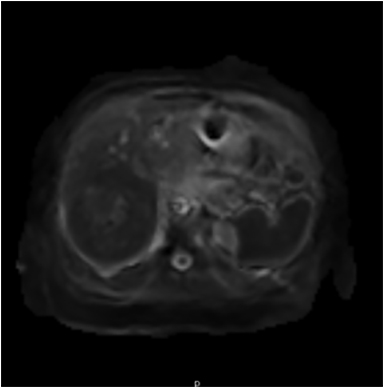
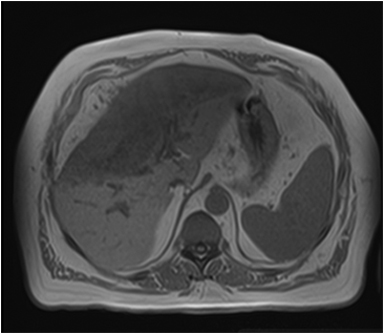
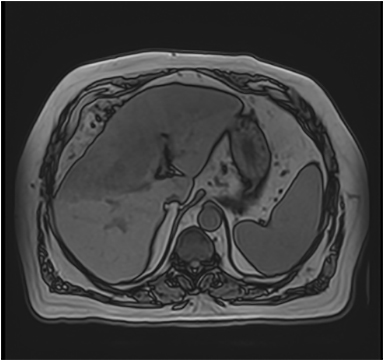
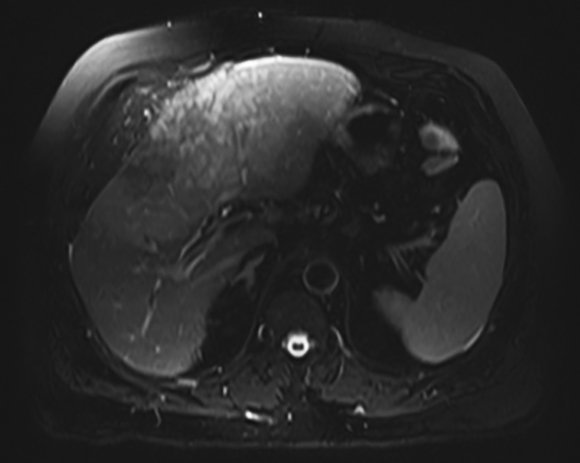
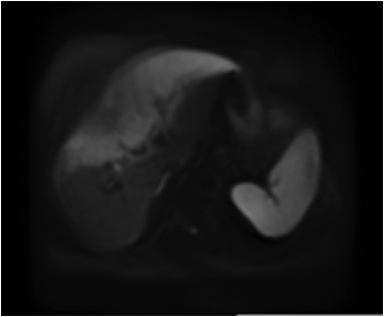
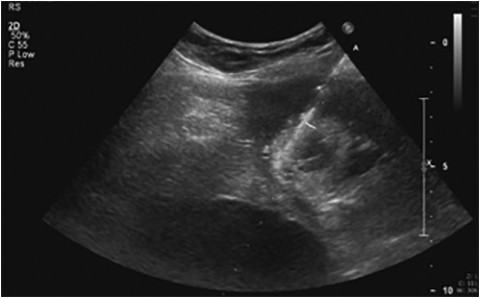
Focal fat deposition is slightly less common and can mimic other hepatic benign or malignant lesions on ultrasound and CT (Figure 4D). MRI is very useful for making the diagnosis of focal hepatic steatosis, which appears isointense or hyperintense to liver on in-phase images (Figure 4A) and loses signal on out of-phase images (Figure 4B). Fat accumulation does not show diffusion restriction on any T2 correlate (Figure 4C), which may also be useful to differentiate steatosis from other liver abnormalities. Moreover, focal fat accumulation tends to show wedge–shaped margins, no mass effect on adjacent blood vessels or the biliary tree, sharp boundaries, and lobar or segmental distribution.26
Mesenchymal hamartoma
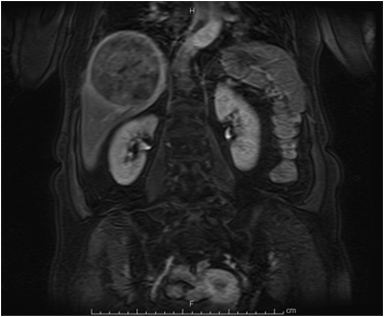
Mesenchymal hamartoma is a rare, benign, developmental tumor of the liver, with occasional risk of malignancy. The pathogenesis of mesenchymal hamartomas is still debated. A handful of series have shown an association with mesenchymal stem villous hyperplasia of the placenta.27 Histologically, it appears as a disordered arrangement of the mesenchyme, bile ducts, and hepatic parenchyma. Cords of normal appearing hepatocytes are separated by zones of loose, poorly cellular mesenchyme. The porous nature of the mesenchyme permits accumulation of fluid.28 The typical presentation is one of asymptomatic, rapid abdominal distention with a palpable mass on physical examination. The rapid expansion of the tumor is believed to be due to degeneration of the mesenchyme and fluid accumulation. Other uncommon associated symptoms are vomiting, fever, constipation, diarrhea and weight loss.29
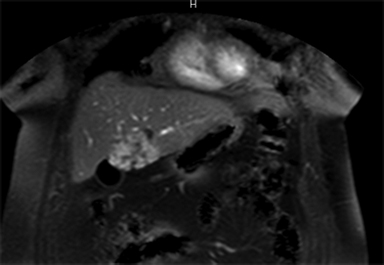
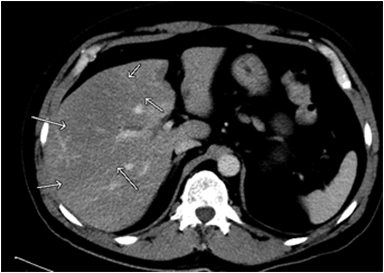
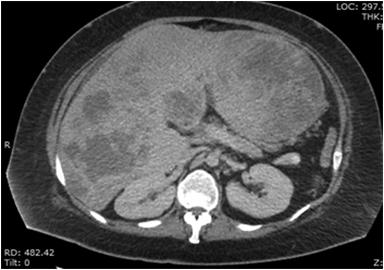
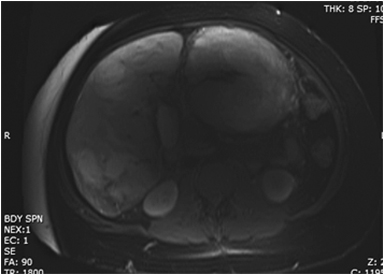
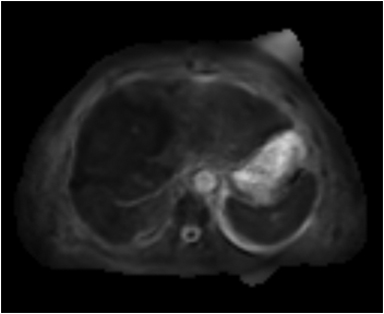
On CT (Figure 5A), mesenchymal hamartomas usually appear as well-defined masses with a central area of homogeneous low attenuation with internal septations. On sonography cystic mesenchymal hamartomas are described as large cysts with internal septae or trabeculae. Less commonly of the lesion manifests as smaller cysts with thickened septations.30 An article by Bin-Bin Ye et al demonstrated that MR images showed enlarged liver with smooth border, multiple foci with slightly low signal intensity on T1-weighted images and slightly high signal intensity on T2-weighted images (Figure 5B). After intravenous administration of a gadolinium-based contrast agent (Figure 5C), the lesions demonstrated annular, heterogenous or no enhancement in the arterial phase, moderate enhancement in the portal phase and hyper enhancement in delayed phase.31
Malignant lesions
Hepatocellular carcinoma
Hepatocellular carcinoma (HCC) is the most common primary hepatic malignancy worldwide.32 Although the prevalence is highest in Africa and Asia, the incidence of HCC in Western countries is increasing.32 HCC usually occurs in patients with cirrhosis due either to infection with hepatitis C/B or to chronic alcohol abuse HCC may also arise de novo, without known insult, in an otherwise normal liver.33
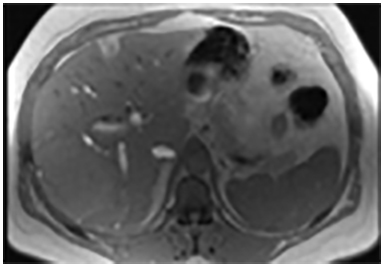
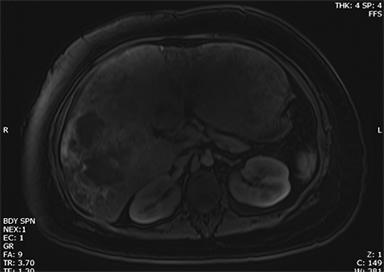
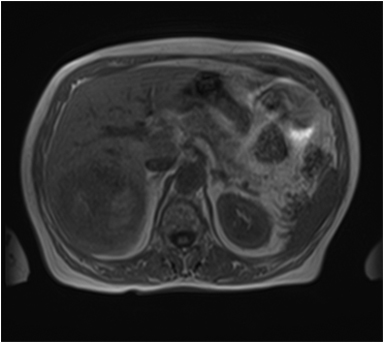
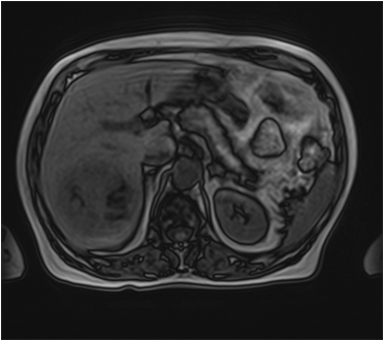
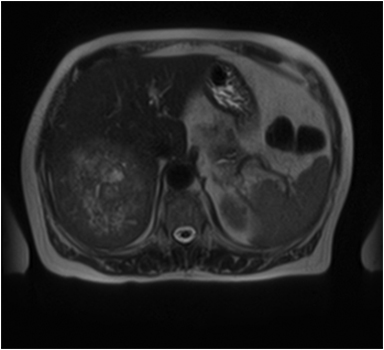
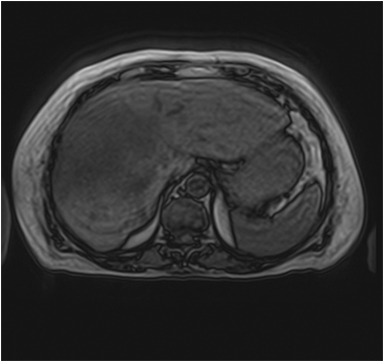
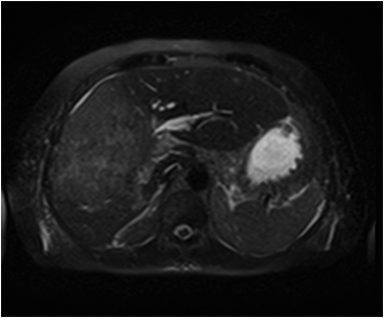
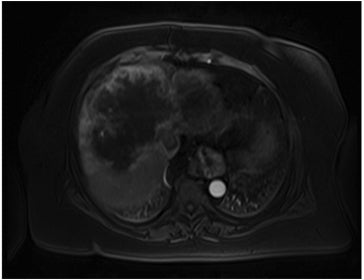
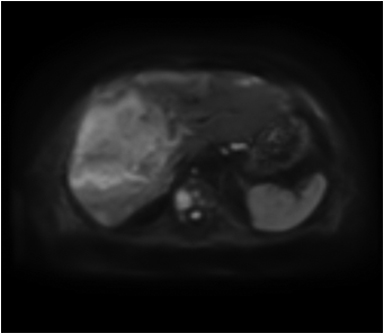
A large HCC may have a number of characteristic features, such as a mosaic pattern, a tumor capsule, extracapsular extension with formation of satellite nodules, vascular invasion, and extrahepatic dissemination, including lymph node and distant metastases.34 On T1- and T2-weighted images, the mosaic pattern appears as areas of variable signal intensities (Figures 6A-6D), whereas on gadolinium-enhanced images (Figures 6E-6G), the lesions enhance in a heterogeneous fashion during the arterial and later phases. These lesions show diffusion restriction (Figure 6F) The tumor capsule is hypointense on both T1- and T2-weighted images in most cases.35
Cholangiocarcinoma
Cholangiocarcinoma is more common in men than women, occurring most frequently between the 6th and 7th decades.4,36 Most patients have no predisposing risk factors, but the presence of the following risk factors may lead to development of the tumor at a younger age:37-38 primary sclerosing cholangitis (5–15% lifetime risk); choledochal cysts (5% will transform and risk increases with age); Caroli disease (7% lifetime risk); hepatolithiasis; chronic intraductal stones; bile duct adenoma; biliary papillomatosis; Clonorchis sinensis infection; and Thorotrast (thorium dioxide) exposure.38-39 The occurrence of cholangiocarcinoma in association with chronic inflammatory conditions suggests that inflammation and glandular regeneration may be the precursors to carcinoma.40
The classification scheme for primary liver cancer proposed by the Liver Cancer Study Group of Japan.41 divides intrahepatic cholangiocarcinomas into three types based on macroscopic appearance: 1) mass-forming, 2) periductal infiltrating, and 3) intraductal.
Imaging plays a role in (a) noninvasive diagnosis and characterization of cholangiocarcinomas, (b) confirmation of diagnosis, (c) pre-therapeutic staging and assessment of respectability and (d) screening of high-risk patients (eg, those with primary sclerosing cholangitis) for early detection. By virtue of its superior contrast resolution, MR imaging with MR cholangiography has been found to be superior to CT for the assessment of intraductal lesions. Relative to the liver parenchyma, intraductal lesions appear hypo- to isointense on T1-weighted images (Figures 7A, 7B). Their T2 signal intensity is variable, but they usually appear slightly hyperintense (Figure 7C). At dynamic imaging with gadolinium-based contrast material, they usually show heterogeneous enhancement (Figure 7D) on early-phase images that gradually peaks on delayed phase images. These lesions usually show diffusion restriction (Figs. 7E, 7F). Concurrently performed high-quality T2-weighted MR cholangiography can further depicting the site of ductal obstruction and associated upstream biliary dilatation.42
Metastases
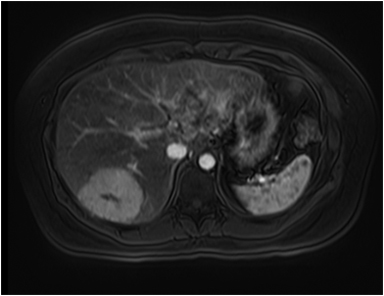
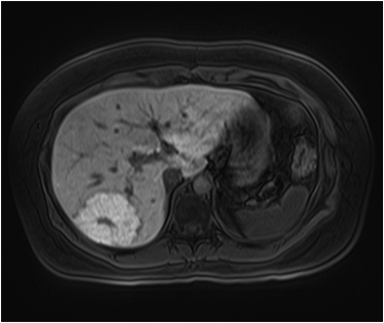
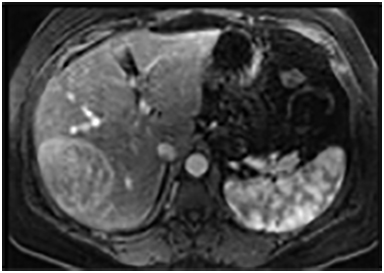
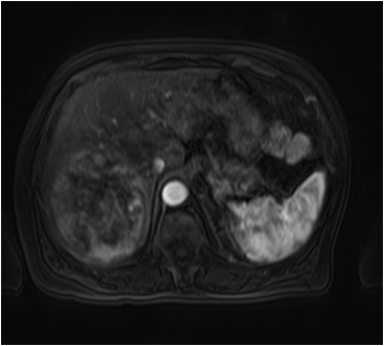
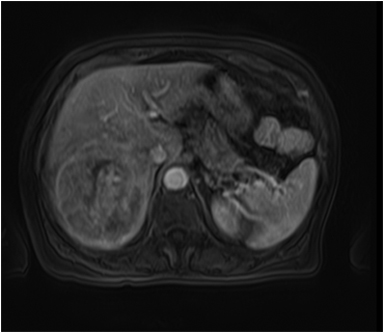
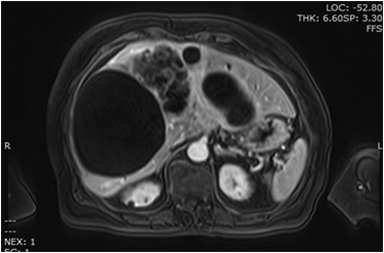
Hepatic metastases have variable appearances (Figures 8A-8C) depending on the primary tumor and are characterized as hypervascular or hypovascular, enhancing more or less than surrounding parenchyma. Hypervascular metastases are seen with neuroendocrine tumors, renal cell carcinoma, thyroid carcinoma, melanoma, and sarcoma. Metastases from other primaries tend to be hypovascular (Figure 8D). Internal hemorrhage may occur with metastases from renal cell carcinoma, melanoma, and lung cancer, often demonstrating T1 hyperintensity. Hepatobiliary imaging with Eovist and DWI (Figure 8E) can be useful for detection of small hepatic metastases, demonstrating improved sensitivity over traditional MRI and CT.43-45
Although the ADC (Figure 8F) values in hepatic metastasis foci are slightly greater than those in hepatocellular carcinoma foci, the ADC values in liver parenchyma with hepatic metastasis are lower than those in hepatocellular carcinoma. Patients with hepatic metastasis have a higher ratio of ADC values of lesion/liver than those with hepatocellular carcinoma.46-48
Biliary cystadenocarcinoma
Benign biliary cystadenomas and cystadenocarcinomas are rare cystic neoplasms which usually arise in the liver or, less frequently, in the extra hepatic bile ducts or the gall bladder.49 Erdogan, et al hypothesized that epithelial cells covering the embryonic gonads in early fetal life might be the common origin for cystadenoma and ovarian stroma.50 Moreover, bilary cystadenocarcinoma has been demonstrated to develop from biliary cystadenoma based on the existence of a transitional zone between normal cells and atypical cells in the cystic wall.51 Devaney et al, divided hepatobiliary cystadenocarcinoma into two types, one is usually accompanied by an ovarian-like stroma, which develops exclusively in women with an indolent course and he other which lacks stroma and occurs in men taking a more aggressive course.52
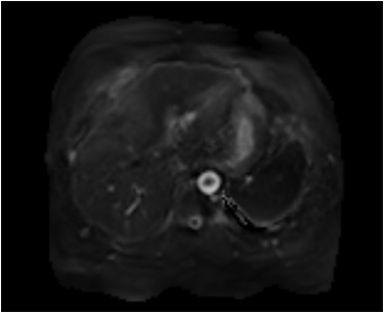
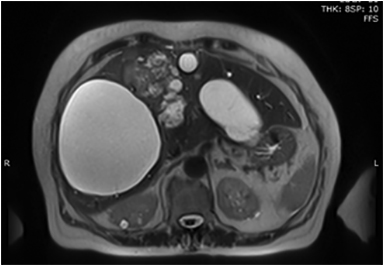
MRI demonstrates T1 hypointense (Figure 9A) and T2 hyperintense (Figure 9B) lesions with septations and T2 intermediate signal intensity areas showing enhancement (Figures 9B, 9C) that represent cyst wall fibrosis and papillary projections suspicious for malignancy. MRI may also provide further information concerning the nature of the fluid in the cyst, blood versus mucin.53 Image guided biopsies will help obtain a tissue diagnosis (Figure 9D).
The differential diagnosis of patients with complex cystic lesions of the liver includes biliary cystadenoma, as well as hydatid cyst, post-traumatic cyst, liver abscess, polycystic disease, hemorrhagic cyst, embryonal sarcoma, primary or metastatic necrotic neoplasm, atypical simple cyst, and biliary intraductal papillary mucinous neoplasm.
Conclusion
Magnetic resonance (MR) imaging findings of large liver masses depend on their histological and cytological features. Large and geographic hepatic lesions though usually challenging and often need histopathological evaluation for definitive diagnosis. Therefore, analysis of lesion signal intensity and enhancement patterns obtained with magnetic resonance imaging is essential for the differential diagnosis of large liver lesions.
REFERENCES
- Mitchell DG. MR imaging of cirrhosis and its complications. Abdom Imaging. 2000;25:455.
- Karhunen PJ. Benign hepatic tumours and tumour like conditions in men. J Clin Pathol. 1986;39:183-188.
- Ishak KG, Rabin L. Benign tumors of the liver. Med Clin North Am. 1975;59:995.
- Craig J, Peters R, Edmondson H. Tumors of the liver and intrahepatic bile ducts. In: Hartman H, Sobin L, eds. Atlas of Tumor Pathology. 2nd series, fascicle 26. Washington, DC: Armed Forces Institute of Pathology, 1989.
- Xie L, Guang Y, Ding H, et al. Diagnostic value of contrast-enhanced ultrasound, computed tomography and magnetic resonance imaging for focal liver lesions: a meta-analysis. Ultrasound Med Biol. 2011;37:854-861.
- Moody AR, Wilson SR. Atypical hepatic hemangioma: a suggestive sonographic morphology. Radiology. 1993;188:413–417.
- Semelka RC, Brown ED, Ascher SM, et al. Hepatic hemangiomas: A multi-institutional study of appearance on T2-weighted and serial gadolinium enhanced gradient-echo MR images. Radiology.1994;192:401-406.
- Baron RL, Campbell WL, Dodd GD. Peribiliary cysts associated with severe liver disease: Imaging- pathologic correlation. AJR Am J Roentgenol. 1994;162:631-636.
- Yamashita Y, Ogata I, Urata J, et al. Cavernous hemangioma of the liver: Pathologic correlation with dynamic CT findings. Radiology. 1997;203:121-125.
- Vilgrain V, Boulos L, Vulluerme MP, et al. Imaging of atypical hemangiomas of the liver with pathologic correlation. RadioGraphics. 2000;20:379-397.
- Choi BI, Han MC, Park JH, et al. Giant cavernous hemangioma of the liver: CT and MR imaging in 10 cases. AJR Am J Roentgenol. 1989;152:1221-1226.
- Benhamou JP, Erlinger S. Maladies du Foie et des Voies Biliares. 3rd ed. Paris: Medicines-Sciences: Flammarion, 1995.
- Herman P, Pugliese V, Machado M, , et al. Hepatic adenoma and focal nodular hyperplasia: Differential diagnosis and treatment. World J Surg. 2000;24:373–376.
- Wanless IR, Maudsley C, Adams R. On the pathogenesis of focal nodular hyperplasia of the liver. Hepatology. 1985;6:1194–1200.
- Kondo F. Benign nodular hepatocellular lesions caused by abnormal hepatic circulation: etiological analysis and introduction of a new concept. J Gastroenterol Hepatol. 2001;16: 1319–1328.
- Nguyen B, Flejou J-F, Terris B, Belghiti J, Degott C. Focal nodular hyperplasia of the liver: a comprehensive pathologic study of 305 lesions and recognition of new histological forms. Am J Surg Pathol. 1999;23:1441–1458.
- Di Carlo I, Urrico GS, Ursino V, et al. Simultaneous occurrence of adenoma, focal nodular hyperplasia and hemangioma of the liver: are they derived from a common origin. J Gastroenterol Hepatol. 2003;18:227–230.
- Savoye-Collet C, Herve S, Koning E, et al. Focal nodular hyperplasia occurring after blunt abdominal trauma. Eur J Gastroenterol Hepatol. 2002;14:329–330.
- Bouyn CI, Leclere J, Raimondo G, et al. Hepatic focal nodular hyperplasia in children previously treated for a solid tumor. Incidence, risk factors and outcome. Cancer. 2003;97:3107–3113.
- Scalori A, Tavani A, Gallus S, et al. Risk factors for focal nodular hyperplasia of the liver: an Italian case-control study. Am J Gastroenterol. 2002; 97:2371.
- Hussain SM, Terkivatan T, Zondervan PE, et al. Focal nodular hyperplasia: findings at state-of-theart MR imaging, US, CT, and pathologic analysis. RadioGraphics. 2004;24:3–17.
- Reddy KR, Schiff E. Approach to a liver lesion. Semin Liver Dis. 1993; 13:423–435.
- Laumonier H, Bioulac-Sage P, Laurent C, et al. Hepatocellular adenomas:magnetic resonance imaging features as a function ofmolecular pathological classification. Hepatology. 2008;48:808–818..
- Katabathina VS, Menias CO, Shanbhogue AKP, et al. Genetics and imaging of hepatocellular adenomas: 2011 update. Radiographics. 2010;31: 1529–1543. 2011.
- Mathieu D, Luciani A, Achab A, et al. [Hepatic Pseudolesions]. Gastroenterol Clin Biol. 2001;25:B158–B166.
- Basaran C, Karcaaltincaba M, Akata D, , et al. Fat-containing lesions of the liver: crosssectional imaging findings with emphasis on MRI. AJR Am J Roentgenol. 2005;184:1103–1110.
- Carta M, Maresi E, Giuffre M, et al. Congenital hepatic mesenchymal hamartoma associated with mesenchymal stem villous hyperplasia of the placenta: case report. J Pediatr Surg. 2005;40:E37–E39.
- Stocker Jt, Ishak KG. Mesenchymal hamartoma of the liver: report of 30 cases and review of the literature. Pediatr Pathol. 1983;1:245–67.
- Gupta R, Parelkar SV, Sanghvi B. Mesenchymal hamartoma of the liver. Indian J Med Paediatr Oncol. 2009;30:141-143. Issue 4
- Stanley P, Hall TR, Woolley M J, et al. Mesenchymal hamartomas of the liver in childhood: sonographic and CT findings. AJR Am J Roentgenol. 1986;147:1035-1039.
- Ye BB, Hu B, Wang LJ, et al. Mesenchymal hamartoma of liver. Magnetic resonance imaging and histopathologic correlation. World J Gastroenterol. 2005;11:5807-5810.
- Huguet C, Stipa F, Gavelli A. Primary hepatocellular cancer: Western experience. In: Blumgart LH, ed. Surgery of the liver and biliary tract. Vol 2. 2nd ed. Edinburgh, Scotland: Churchill Livingstone, 1994; 1365– 1369.
- Winter TC III, Takayasu K, Muramatsu Y, et al. Early advanced hepatocellular carcinoma: evaluation of CT and MR appearance with pathologic correlation. Radiology. 1994; 192: 379–387.
- Hussain SM, Semelka RC, Mitchell DG. MR imaging of hepatocellular carcinoma. Magn Reson Imaging Clin N Am. 2002;10:31–52.
- Choi BI, Takayasu K, Han MC. Small hepatocellular carcinomas and associated nodular lesions of the liver: pathology, pathogenesis, and imaging findings. AJR Am J Roentgenol.1993; 60:1177–1187.
- Buetow P, Midkiff R. Primary malignant neoplasms in the adult. MRI Clin N Am. 1997; 5: 289–318.
- Jarnagin WR. Cholangiocarcinoma of the extrahepatic bile ducts. Semin Surg Oncol. 2000; 19: 156–76.
- Ahrendt SA, Nakeeb A, Pitt HA. Cholangiocarcinoma. Clin Liver Dis. 2001; 5: 191–218.
- Vilgrain V, Van Beers BE, Flejou JF, et al. Intrahepatic cholangiocarcinoma: MRI and pathologiccorrelation in 14 patients. J Comput Assist Tomogr. 1997; 21: 59–65.
- Levy AD. Malignant liver tumors. Clin Liver Dis. 2002; 6:147–164.
- Liver Cancer Study Group of Japan. Classification of primary liver cancer. Tokyo, Japan: Kanehara, 1997; 6–8.
- Zidi SH, Prat F, Le Guen O, et al. Performance characteristics of magnetic resonance cholangiography in the staging of malignanthilar strictures. Gut. 2000;46:103–106.
- Kenis C, Deckers F, De Foer B, et al. Diagnosis of liver metastases: can diffusion-weighted imaging (DWI) be used as a standalone sequence? Eur J Radiol. 2012;81:1061-1023.
- Zech CJ, Herrmann KA, Reiser MF, Schoenberg SO. MR imaging in patients with suspected liver metastases: value of liver-specific contrast agent Gd-EOB-DTPA. Magn Reson Med Sci. 2007;6:43-52.
- Hammerstingl R, Huppertz A, Breuer J, , et al. Diagnostic efficacy of gadoxetic acid (Primovist)- enhanced MRI and spiral CT for a therapeutic strategy: comparison with intraoperative and histopathologic findings in focal lesions. Eur Radiol. 2008;18:457-467.
- Glass NL, Lee L. Isolation of Neurospora crassa. A mating type mutants by repeat induced point (RIP) mutation. Genetics. 1992; 132: 125-133.
- Sun XJ, Quan XY, Liang W, et al. [Quantitative study of diffusion weighted imaging on magnetic resonance imaging in focal hepatic lesions less than 3 cm] Zhonghua Zhong Liu Za Zhi. 2004; 26:165-167.
- Murtz P, Flacke S, Traber F, et al. Abdomen: diffusion-weighted MR imaging with pulsetriggered single-shot sequences. Radiology. 2002;224:258-264.
- Lauffer JM, Baer HU, Maurer CA et al. Biliary cystadenocarcinoma of the liver: The need for complete resection. Eur J. Cancer. 1998;34:1845-1851.
- Erdogan D, Kloek J, Lamers WH, et al. Mucinous cystadenomas in liver: Management and origin. Dig Surg. 2010;27:19–23.
- Woods GL. Biliary cystadenocarcinoma: Case report of hepatic malignancy originating in benign cystadenoma. Cancer. 1981;47:2936–2940.
- Devaney K, Goodman ZD, Ishak KG. Hepatobiliary cystadenoma and cystadenocarcinoma. A light microscopic and immunohistochemical study of 70 patients. Am J Surg Pathol. 1994;18:1078–1091.
- Vogt DP Henderson JM, Chmielewski E. Cystadenoma and cystadenocarcinoma of the liver: A single center experience. J Am Coll Surg. 2005;200;727-733.
Citation
MRI Evaluation of masses in the noncirrhotic liver. Appl Radiol.
December 17, 2014