MR Imaging of adrenal lesions
Images


The role of MRI in the evaluation of adrenal lesions has evolved tremendously over the last twenty years. This is due primarily to the modality’s inherent tissue characterizing ability, but also to a variety of accelerated pulse sequences which confer some advantages over other imaging modalities used for adrenal imaging. MRI’s absence of ionizing radiation is additionally beneficial, particularly in young patients or in those undergoing repeated imaging.
The detection of incidental adrenal lesions has increased with the widespread use of cross-sectional imaging.1,2 Incidental adrenal nodules are present in approximately 5% of all abdominal CT examinations in patients with no known malignancy or endocrine abnormality.3,4 The incidence increases to between 9% and 13% in patients imaged for a known malignancy.3 Up to 27% of oncology patients will have microscopic adrenal metastases and approximately 50% of imaging-detected adrenal lesions in cancer patients will represent metastatic disease.5-8
Accurate characterization of adrenal lesions in patients with a known primary malignancy is extremely relevant in clinical practice.9 For example, an isolated ipsilateral adrenal metastasis in a patient with resectable, primary, non-small cell lung carcinoma is treated as localized disease. In such a patient, resection of an isolated adrenal metastasis has been demonstrated to extend disease-free survival.10
MR Imaging techniques
At our institution all abdominal MR imaging studies are performed with a dedicated torso phased array coil (to optimize the signal to noise ratio), high-field imaging, and a power injector when contrast is required. Breath-holding or respiratory navigation sequences are used to minimize artifacts secondary to respiratory motion.
A breath-hold or respiratory-navigated, heavily T2-weighted sequence is performed in the coronal and axial planes to help provide an anatomic roadmap. A breath-held, dual-echo T1-weighted, two-dimensional (2D) gradient-echo (GRE) sequence is acquired in-phase (IP) and out-of-phase (OOP) to detect intracellular lipid. Both echoes are acquired within the same breath-hold, allowing reliable coregistration of the corresponding IP and OOP images. This sequence is used to differentiate lipid rich adrenal adenomas from non-lipid containing adrenal lesions. A baseline, unenhanced fat-suppressed, T1-weighted sequence is used to differentiate between hemorrhage and fat, to provide a baseline comparison to postcontrast images to allow determination of presence or absence of contrast enhancement.
Chemical shift imaging
Chemical shift imaging (CSI) is the mainstay of MR evaluation of solid adrenal lesions. Chemical shift MRI relies on detecting intracellular lipid in an adenoma for accurate adenoma identification.11 Chemical shift MRI exploits the different resonant frequencies of fat and water protons in a given voxel, rather than usingattenuation differences as with CT for lesion characterization. Fat protons precess at a lower frequency than water protons. When fat and water molecules occupy the same voxel, differences in precessional frequency quench MR signal in that voxel during opposed-phase gradient-echo MR imaging.12-16 This decrease in signal intensity is appreciated when OOP images are compared with the corresponding IP images. Korobkin et al17 demonstrated an inverse linear relationship between the percentage of lipid-rich cells and the relative change in MR signal intensity on chemical shift images. This relationship holds as long as the number of lipid protons in a voxel does not exceed the number of water protons; however, if the lipid protons were to outnumber the water protons, the result would be a smaller drop in signal as it is the cancellation of signals from pairs of lipid and water protons that produces the drop in signal.
The CSI signal loss can be measured quantitatively, as the adrenal-to-spleen chemical-shift ratio, by dividing the lesion-to-spleen signal intensity ratios on the IP images by the OOP images.18 A CSI ratio of less than 0.71 at 1.5T field strength indicates a lipid-rich adenoma.15 The alternative adrenal signal intensity index is calculated as [(IP signal intensity – OOP signal intensity)/(IP signal intensity)] x 100%; using this formula, a measurement of greater than 16.5% at 1.5T is consistent with a lipid-rich adenoma.19 In clinical practice, however, most radiologists evaluate chemical shift change visually or qualitatively using muscle or spleen as the internal reference organ. This has been demonstrated to be as effective as quantitative methods.20,21 The liver should not be used as the internal reference organ, as it can also demonstrate drop-off of OOP signal with fatty infiltration of the liver.20, 22 The sensitivity and specificity of CSI for the differentiation of adrenal incidentalomas are reported at 81% to 100% and 94% to 100%, respectively.14,21,23 It should be remembered that adrenocortical carcinoma, pheochromocytoma, as well as clear cell renal cancer and fat-containing HCC metastases may occasionally demonstrate signal loss on OOP images.11
Dynamic contrast enhancement
Little has been published regarding the utility of gadolinium-enhanced MRI in characterizing adrenal masses. One study evaluating the MRI enhancement features of adrenal masses found that neither absolute enhancement nor gadolinium washout kinetics were useful in differentiating adenomas from non-adenomas.16 Another, more recent study24 concluded that although the diagnostic value of dynamic MRI is lower than chemical shift MRI, contrast enhancement and time-to-peak and wash-in rates derived from SI-time curve of dynamic MRI may be contributory to the results of chemical shift MRI in atypical cases.
Emerging techniques
Diffusion weighting
The data relating to diffusion weighting in the imaging of adrenal tumors has been disappointing thus far in general because of benign adrenal adenomas’ propensity to demonstrate restricted diffusion. Miller et al25 retrospectively evaluated 160 adrenal lesions in 156 patients and found that apparent diffusion coefficient (ADC) values were not useful in accurately distinguishing benign from malignant adrenal lesions. Sandrasegaran et al26 also found that ADC values are not clinically useful in differentiating adrenal lesions.
MR Spectroscopy
MR spectroscopy is a technique that has been investigated for further characterization of adrenal masses. This method takes advantage of altered metabolite composition of the mass. For example, choline is a metabolite involved in construction of the cell wall, and its concentration is increased in malignancies due to cellular proliferation.27 Faria et al28 identifed 60 patients with adrenal tumors larger than 2cm in diameter. They were examined in a 1.5T MR imaging system and point-resolved 1H MR spectroscopy. They found that 1H MR spectroscopy can be used to characterize adrenal masses on the basis of spectral findings for benign adenomas, carcinomas, pheochromocytomas and metastases. Choline-creatine ratios greater than 1.20 yielded 92% sensitivity and 96% specificity. Choline-lipid ratios greater than 0.38 yielded 92% sensitivity and specificity. Both were sufficient for differentiation of adenomas and pheochromocytomas from carcinomas and metastases. In the differentiation of carcinomas and pheochromocytomas from adenomas and metastases, a 4.0 – 4.3 ppm/creatine ratio greater than 1.50 yielded 87% sensitivity and 98% specificity. Simultaneous use of these two analyses for each type of adrenal mass allowed classification of 54 of 60 masses into 4 distinct groups. Limitations of this technique include the fact that lesions smaller than 2cm are generally unsuitable for analysis due to artifacts caused by respiratory movements.
PET/MRI
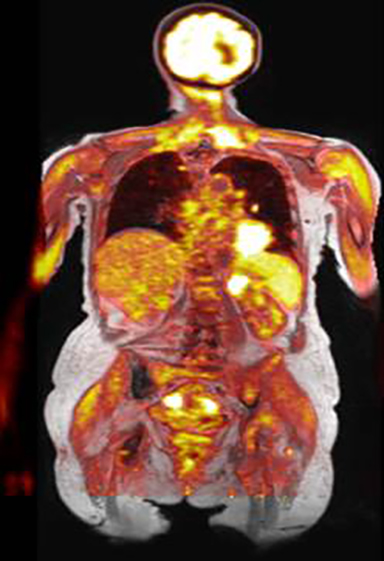
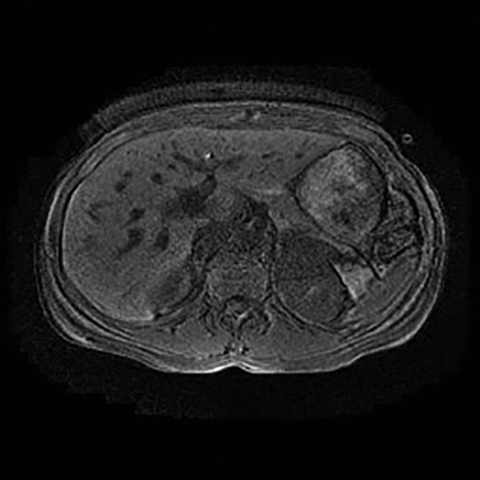
PET/MRI is the newest clinical hybrid imaging modality (Figure 1). The excellent soft-tissue contrast of MRI and its ability to assess adrenal lesions with chemical shift imaging may provide a superior complement to PET in certain clinical circumstances.29 A recent study30 identified a total of 173 patients, with 649 upper-abdominal incidentalomas who underwent 18F-FDG PET/CT and subsequent whole-body or abdominal 18F-FDG PET/MRI for oncological indications. In both cystic and non-cystic masses, fewer findings were rated as indeterminate by 18F-FDG PET/MRI compared with 18F-FDG PET/CT. The organ-specific subgroup analysis of this study showed significantly fewer indeterminate findings in the liver, the kidney and the adrenal glands, pointing to the superior diagnostic performance of 18F-FDG PET/MRI over 18F-FDG PET/CT in these organs. Classification of adrenal incidentalomas is predominantly based on lipid detection techniques.12, 31 Given its high resolution, the three-dimensional VIBE sequence in the Dixon technique is used for MRI-based attenuation correction in integrated PET/MRI scanners.30 These images can be used to increase the diagnostic accuracy in adrenal incidentalomas. In the case of an adrenal mass, the evaluation of these images for the characteristic signal decrease in the opposed-phase images is useful and can increase the diagnostic certainty without requiring any further resources and without additional radiation exposure.
MRI Features of adrenal lesions
Adrenal adenoma
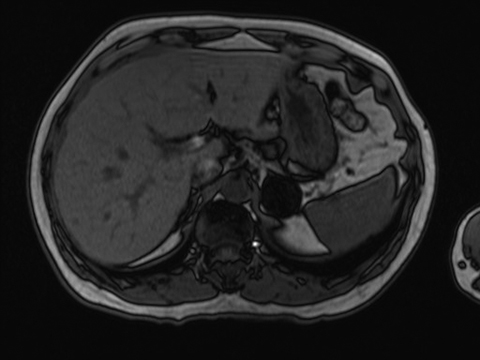
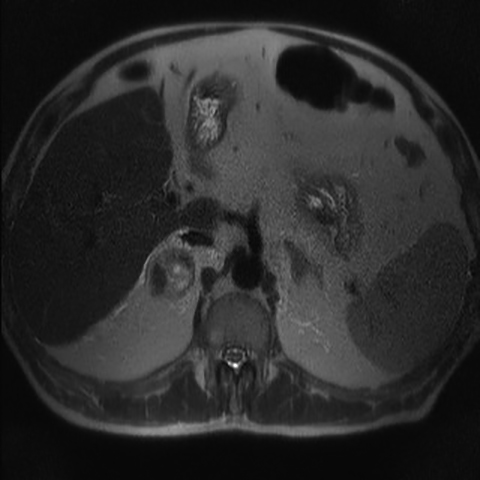
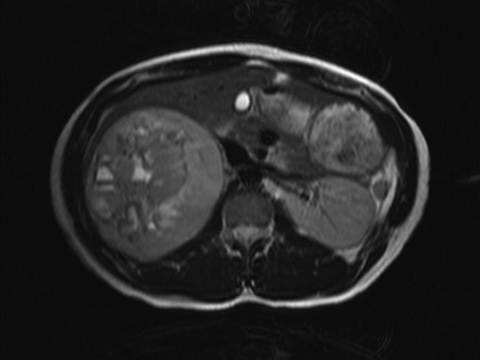
Identifying microscopic lipid within an adrenal mass has remained the cornerstone of characterizing an adrenal lesion as an adenoma (Figure 2).32 Chemical shift imaging is a rapid and reliable technique that relies on demonstrating lipid within the mass to diagnose an adrenal adenoma.14 Although non-contrast CT and CSI are used in clinical practice for differentiating adenoma from malignancy, some investigators have reported that between 62% and 100% of adenomas with attenuation of greater than 10 Hounsfield Units (HU) can be characterized confidently using CSI.21,23 CSI may be preferable to non-contrast CT in characterizing adrenal lesions as adenomas because it demonstrates better sensitivity for intracellular lipid and does not expose the patient to radiation.
Adrenal myelolipoma
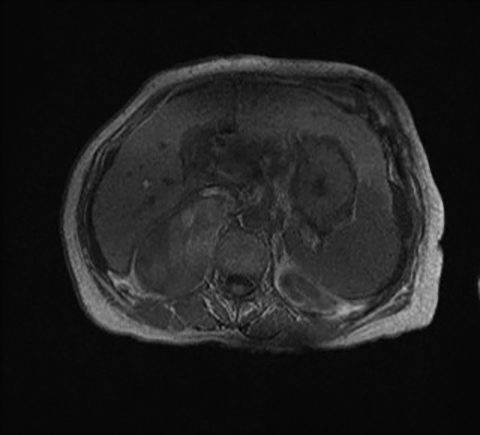
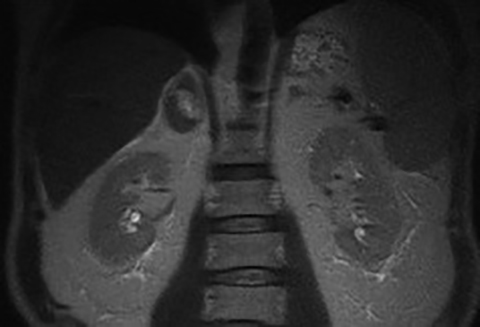
The imaging diagnosis of myelolipomas is based on the presence of macroscopic fat. MRI characteristics include T1-hyperintense signal that suppresses with frequency-selective fat saturation (Figure 3).33 Similar to renal angiomyolipomas, the presence of the India Ink (chemical shift) artifact at the myelolipoma-adrenal interface or within an adrenal mass on OOP images should indicate a myelolipoma.34 Small quantities of macroscopic fat are not completely specific for myelolipoma. In addition to adenomas, a recent retrospective study of 41 adrenocortical carcinomas suggested that 10% contained foci of macroscopic fat.35 In contrast to renal angiomyolipomas, small amounts of macroscopic fat should be considered characteristic, but not diagnostic, of myelolipomas.33 Other imaging features (margins, invasion, heterogeneity etc.) should be considered to exclude a rare, fat-containing malignancy. Otal et al36 reported that a lesion with composition of greater than 50% macroscopic fat can be managed as a myelolipoma.
Adrenal hemorrhage
The causes of unilateral adrenal hemorrhage are blunt abdominal trauma, iatrogenic causes and underlying malignancy. MRI is sensitive in the evaluation of hemorrhage by specific signal characteristics of the blood products. In the acute setting and due to the paramagnetic effect of deoxyhemoglobin, hemorrhage demonstrates isointense or hypointense T1 signal and hypointense T2 signal.27 In the subacute setting, the signal characteristic of the hemorrhage is mostly determined by intracellular or extracellular methemoglobin with hyperintense T1 signal and hypointense or hyperintense T2 signal. Chronic hematoma can develop cystic changes with low marginal signal intensity due to peripheral hemosiderin deposition and formation of a fibrous capsule.37 Contrast-enhanced MRI can be performed to evaluate for any enhancing solid component of the hematoma which would suggest the presence of an underlying lesion that has bled.
Adrenal cysts: simple cysts, pseudocysts, lymphangiomas
Adrenal cysts are rare. The frequency of adrenal cysts seen at autopsy ranges from 0.064% to 0.18%.38,39 They can be broadly subdivided into simple cysts, pseudocysts and lymphangiomas.
Simple cysts
Endothelial cysts/simple cysts are the most common subtype. Simple cysts are hypointense on T1-weighted images and hyperintense on T2-weighted images with no soft tissue component and no internal enhancement.40
Pseudocysts
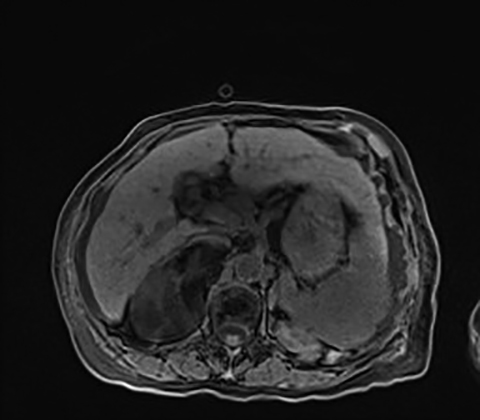
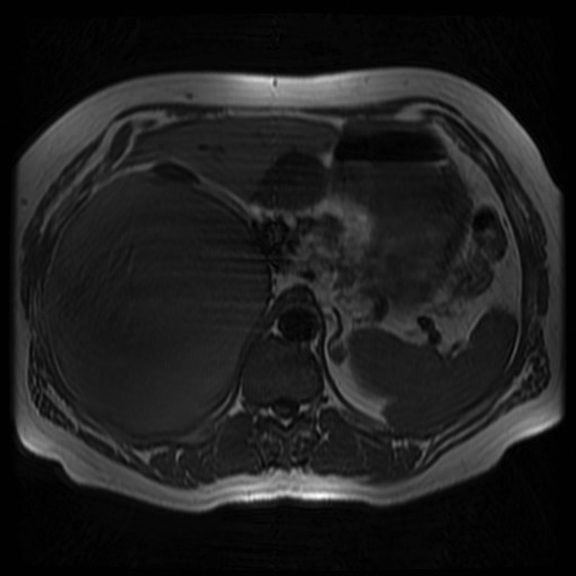
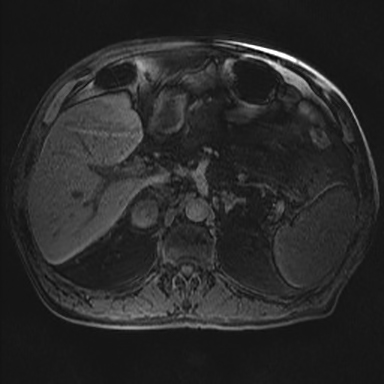
These represent the next most common subtype. Pseudocysts are caused by a prior episode of hemorrhage or infarct; the cyst wall is composed of fibrous tissue. Although low signal, the pseudocyst can be more complex and may present with thicker walls, internal septations and calcifications. MRI is the best method for characterization due to its increased sensitivity for detection of hemorrhagic elements and superior septation characterization (Figure 4).33,41
Lymphangiomas
These are rare and typically symptomatic.42 Adrenal lymphangiomas are usually thin-walled cystic lesions with low signal intensity at T1-weighted imaging and high signal intensity at T2-weighted imaging without substantial internal enhancement.43-45
Pheochromocytoma
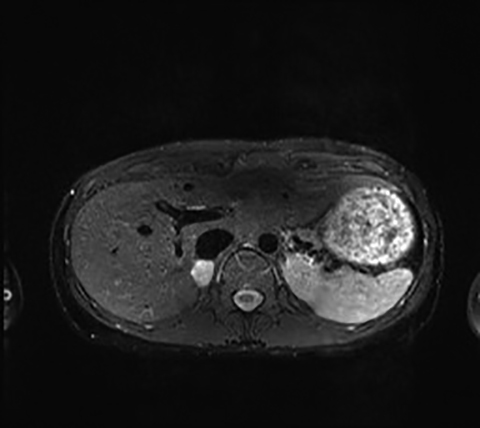
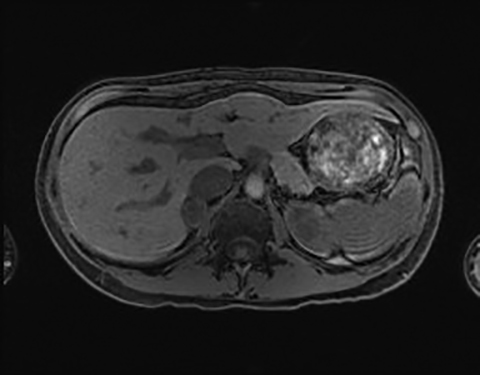
The most common MR imaging appearance of pheochromocytoma is a mass with low signal intensity at T1-weighted imaging and with high signal intensity at T2-weighted imaging.46 The signal pattern is variable and the high T2 signal in particular is not always present.47 However pheochromocytomas do typically enhance avidly on T1-weighted imaging following administration of gadolinium based contrast material.12,47 Usually, pheochromocytomas appear still more hyperintense on fat-suppressed, T2-weighted images due to a signal intensity rescaling effect, which reflects the reduced signal intensity of background fat (Figure 5).46 As mentioned above, a pheochromocytoma cannot be excluded on the basis of a lack of high intensity on T2-weighted MR imaging. Conversely, non-pheochromocytomas, including some metastases may be incorrectly classified as pheochromocytomas due to high T2 lesion signal intensity.46 Punctate signal voids representing tumor vessels in paragangliomas create a salt-and-pepper pattern characteristically seen on T1- and T2-weighted images.
Malignant adrenal lesions: Adrenocortical carcinoma, metastases
Adrenocortical carcinoma
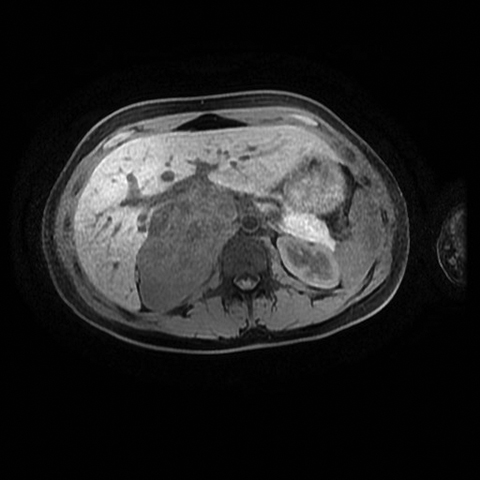
Adrenocortical carcinoma (ACC) is a rare, malignant tumor of the adrenal gland. They are typically large at presentation and may have metastasized at the time of diagnosis.32 ACCs are generally heterogeneous with areas of high signal intensity on T1-weighted and T2-weighted sequences, representing blood products and areas of necrosis within these lesions (Figure 6). Following administration of gadolinium, the viable portion of the tumor will enhance. Because this neoplasm originates from the adrenal cortex, it may contain foci of intracytoplasmic lipid, resulting in loss of signal intensity on OOP images, similar to an adenoma.48 Although in most cases, it is not difficult to differentiate between an adenoma and an ACC, one should exercise caution in attempting to distinguish between a small ACC and an adenoma.
Metastases
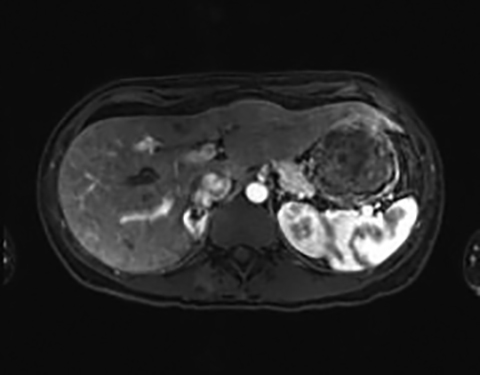
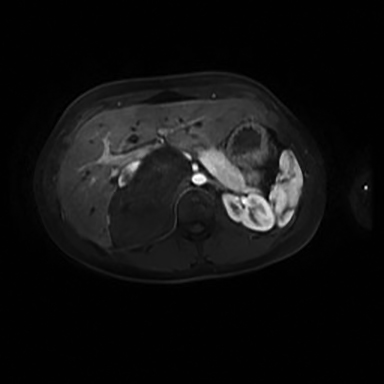
Metastases are the most common malignant lesions involving the adrenal gland.42 Adrenal metastases are found in up to 27% of patients with malignant epithelial tumors at autopsy.8 Metastases are usually bilateral but may also be unilateral. They usually demonstrate low signal intensity on T1-weighted images and relatively high signal intensity on T2 with progressive enhancement following administration of contrast material (Figure 7). The most important imaging feature is lack of signal drop-off on the OOP images, distinguishing this tumor from a lipid-rich adrenal adenoma.
Lymphoma
Primary adrenal lymphoma is rare. Singh et al reported four cases from a series of 241 patients with non-Hodgkins lymphoma (NHL).49 Secondary adrenal involvement is typically seen with NHL.33 The MRI characteristics are nonspecific. Typically, the T1 signal intensity is lower than that of liver and the T2 signal is heterogenously hyperintense. They typically demonstrate only mild to moderate homogeneous (or mildy heterogeneous) enhancement after gadolinium.50
Pediatric lesions: Neuroblastoma, ganglioneuroma, ganglioneuroblastoma
Neuroblastomas
Neuroblastomas comprise the third-most common malignant tumors in children, but are rare in the adult population.33 It usually demonstrates heterogeneous low signal on T1-weighted images, high signal on T2-weighted images and enhancement following administration of intravenous contrast (Figure 8).42 Calcification is present in 80-90% of the lesions, but may be difficult to discern on MR images.
Ganglioneuromas
These are benign neoplasms composed of Schwann cells and ganglion cells that arise from the sympathetic ganglia; 20-30% arise in the adrenal medulla.33 These lesions do not secrete hormones and are usually incidental findings. They demonstrate soft tissue attenuation, variable size and homogenous or mildy heterogeneous enhancement.51 They are typically low on T1-weighted imaging and can have heterogeneous hyperintense T2 signal (Figure 9).52
Ganglioneuroblastomas
Gangioneuroblastomas arise from the neural crest. They tend to be smaller and more well defined than neuroblastoma at diagnosis.53 They typically demonstrate intermediate signal intensity on T1-weighted images and heterogeneously high signal on T2-weighted images, with heterogeneous, moderate enhancement following administration of contrast material.42
Conclusion
MRI is an invaluable imaging tool in the evaluation of adrenal lesions with the lack of ionizing radiation burden a major advantage. The standard imaging sequences frequently allow definitive characterization of many indeterminate adrenal lesions. In addition, emerging imaging modalities, such as PET/MR and MR spectroscopy have the potential to yield further information but require more studies for validation.
References
- Boland GW, Blake MA, Hahn PF, et al.. Incidental adrenal lesions: Principles, techniques, and algorithms for imaging characterization. Radiology. 2008;249(3):756-775.
- Dunnick NR, Korobkin M. Imaging of adrenal incidentalomas: Current status. AJR Am J Roentgenol. 2002;179(3):559-568.
- Bovio S, Cataldi A, Reimondo G, et al. Prevalence of adrenal incidentaloma in a contemporary computerized tomography series. J Endocrinol Invest. 2006;29(4):298-302.
- Song JH, Chaudhry FS, Mayo-Smith WW. The incidental adrenal mass on CT: Prevalence of adrenal disease in 1,049 consecutive adrenal masses in patients with no known malignancy. AJR Am J Roentgenol. 2008;190(5):1163-1168.
- Young WF, Jr. Clinical practice. The incidentally discovered adrenal mass. N Engl J Med. 2007;356(6):601-610.
- Mansmann G, Lau J, Balk E, et al. The clinically inapparent adrenal mass: Update in diagnosis and management. Endocr Rev. 2004;25(2):309-340.
- Mayo-Smith WW, Boland GW, Noto RB, et al. State-of-the-art adrenal imaging. Radiographics. 2001;21(4):995-1012.
- Abrams HL, Spiro R, Goldstein N. Metastases in carcinoma: Analysis of 1000 autopsied cases. Cancer. 1950;3(1):74-85.
- Blake MA, Cronin CG, Boland GW. Adrenal imaging. AJR Am J Roentgenol. 2010;194(6):1450-1460.
- Kocijancic I, Vidmar K, Zwitter M, et al. The significance of adrenal metastases from lung carcinoma. Eur J Surg Oncol. 2003;29(1):87-88.
- McDermott S, O’Connor OJ, Cronin CG, et al. Radiological evaluation of adrenal incidentalomas: Current methods and future prospects. Best Pract Res Clin Endocrinol Metab. 2012;26(1):21-33.
- Mitchell DG, Crovello M, Matteucci T, et al. Benign adrenocortical masses: Diagnosis with chemical shift MR imaging. Radiology. 1992;185(2):345-351.
- Reinig JW, Stutley JE, Leonhardt CM, et al. Differentiation of adrenal masses with MR imaging: Comparison of techniques. Radiology. 1994; 192(1):41-46.
- Outwater EK, Siegelman ES, Radecki PDet al. Distinction between benign and malignant adrenal masses: Value of T1-weighted chemical-shift MR imaging. AJR Am J Roentgenol. 1995;165(3):579-583.
- Outwater EK, Siegelman ES, Huang AB et al. Adrenal masses: Correlation between CT attenuation value and chemical shift ratio at MR imaging with in-phase and opposed-phase sequences. Radiology. 1996;200(3):749-752.
- Korobkin M, Lombardi TJ, Aisen AM, et al. Characterization of adrenal masses with chemical shift and gadolinium-enhanced MR imaging. Radiology. 1995;197(2):411-418..
- Korobkin M, Giordano TJ, Brodeur FJ, et al. Adrenal adenomas: Relationship between histologic lipid and CT and MR findings. Radiology. 1996;200(3):743-747.
- Blake MA, Holalkere NS, Boland GW. Imaging techniques for adrenal lesion characterization. Radiol Clin North Am. 2008;46(1):65-78.
- Mayo-Smith WW, Lee MJ, McNicholas MM, et al. Characterization of adrenal masses (< 5 cm) by use of chemical shift MR imaging: Observer performance versus quantitative measures. AJR Am J Roentgenol. 1995;165(1):91-95.
- McNicholas MM, Lee MJ, Mayo-Smith WW, et al. An imaging algorithm for the differential diagnosis of adrenal adenomas and metastases. AJR Am J Roentgenol. 1995;165(6):1453-1459.
- Israel GM, Korobkin M, Wang C, et al. Comparison of unenhanced CT and chemical shift MRI in evaluating lipid-rich adrenal adenomas. AJR Am J Roentgenol. 2004;183(1):215-219.
- Barzon L, Sonino N, Fallo F, et al. Prevalence and natural history of adrenal incidentalomas. Eur J Endocrinol. 2003;149(4):273-285.
- Haider MA, Ghai S, Jhaveri K, et al. Chemical shift MR imaging of hyperattenuating (>10 HU) adrenal masses: Does it still have a role? Radiology. 2004;231(3):711-716.
- Inan N, Arslan A, Akansel G, et al. Dynamic contrast enhanced MRI in the differential diagnosis of adrenal adenomas and malignant adrenal masses. Eur J Radiol. 2008;65(1):154-162.
- Miller FH, Wang Y, McCarthy RJ, et al.Utility of diffusion-weighted MRI in characterization of adrenal lesions. AJR Am J Roentgenol. 2010;194(2): W179-185.
- Sandrasegaran K, Patel AA, Ramaswamy R, et al. Characterization of adrenal masses with diffusion-weighted imaging. AJR Am J Roentgenol. 2011;197(1):132-138.
- Malayeri AA, Zaheer A, Fishman EK, et al. Adrenal masses: Contemporary imaging characterization. J Comput Assist Tomogr. 2013;37(4):528-542.
- Faria JF, Goldman SM, Szejnfeld J, et al. Adrenal masses: Characterization with in vivo proton MR spectroscopy—initial experience. Radiology. 2007;245(3):788-797.
- Fraum TJ, Fowler KJ, McConathy J, et al. PET/MRI for the body imager: Abdominal and pelvic oncologic applications. Abdom Imaging. 2015 [Epub ahead of print].
- Schaarschmidt BM, Grueneisen J, Heusch P, et al. Does 18F-FDG PET/MRI reduce the number of indeterminate abdominal incidentalomas compared with 18F-FDG PET/CT? Nucl Med Commun. 2015;36(6):588-595.
- Berland LL, Silverman SG, Gore RM, et al. Managing incidental findings on abdominal CT: White paper of the ACR incidental findings committee. J Am Coll Radiol. 2010;7(10):754-773.
- Davarpanah AH, Israel GM. MR imaging of the kidneys and adrenal glands. Radiol Clin North Am. 2014;52(4):779-798.
- Taffel M, Haji-Momenian S, Nikolaidis P, et al. Adrenal imaging: A comprehensive review. Radiol Clin North Am. 2012;50(2):219-243.
- Israel GM, Hindman N, Hecht E, et al. The use of opposed-phase chemical shift MRI in the diagnosis of renal angiomyolipomas. AJR Am J Roentgenol. 2005;184(6):1868-1872.
- Zhang HM, Perrier ND, Grubbs EG, et al. CT features and quantification of the characteristics of adrenocortical carcinomas on unenhanced and contrast-enhanced studies. Clin Radiol. 2012;67(1):38-46.
- Otal P, Escourrou G, Mazerolles C, et al. Imaging features of uncommon adrenal masses with histopathologic correlation. Radiographics. 1999;19(3):569-581.
- Hoeffel C, Legmann P, Luton JP, et al. Spontaneous unilateral adrenal hemorrhage: Computerized tomography and magnetic resonance imaging findings in 8 cases. J Urol. 1995;154(5):1647-1651.
- Tagge DU, Baron PL. Giant adrenal cyst: management and review of the literature. Am Surg. 1997;63(8):744-746.
- Rozenblit A, Morehouse HT, Amis ES, Jr. Cystic adrenal lesions: CT features. Radiology. 1996;201(2):541-548.
- Lee MJ, Mayo-Smith WW, Hahn PF, et al. State-of-the-art MR imaging of the adrenal gland. Radiographics. 1994;14(5):1015-1029; discussion 29-32.
- Guo YK, Yang ZG, Li Y, et al. Uncommon adrenal masses: CT and MRI features with histopathologic correlation. Eur J Radiol. 2007;62(3):359-370.
- Elsayes KM, Mukundan G, Narra VR, et al. Adrenal masses: MR imaging features with pathologic correlation. Radiographics. 2004;24 Suppl 1:S73-86.
- Touiti D, Deligne E, Cherras A, et al. [Cystic lymphangioma in the adrenal gland: a case report]. Ann Urol (Paris). 2003;37(4):170-172.
- Longo JM, Jafri SZ, Bis KB. Adrenal lymphangioma: A case report. Clin Imaging. 2000;24(2):104-106.
- Iderne A, Duchene H, Bruant P. [Cystic lymphangioma of the adrenal gland]. J Chir (Paris). 1995;132(2):87-89.
- Blake MA, Kalra MK, Maher MM, et al. Pheochromocytoma: An imaging chameleon. Radiographics. 2004;24 Suppl 1:S87-99.
- Varghese JC, Hahn PF, Papanicolaou N, et al. MR differentiation of phaeochromocytoma from other adrenal lesions based on qualitative analysis of T2 relaxation times. Clin Radiol. 1997;52(8):603-606.
- Siegelman ES. MR imaging of the adrenal neoplasms. Magn Reson Imaging Clin N Am. 2000;8(4):769-786.
- Singh D, Kumar L, Sharma A, Vet al. Adrenal involvement in non-Hodgkin’s lymphoma: Four cases and review of literature. Leuk Lymphoma. 2004;45(4):789-794.
- Kato H, Itami J, Shiina T, et al. MR imaging of primary adrenal lymphoma. Clin Imaging. 1996;20(2):126-128.
- Radin R, David CL, Goldfarb H, et al. Adrenal and extra-adrenal retroperitoneal ganglioneuroma: imaging findings in 13 adults. Radiology. 1997;202(3):703-707.
- Rha SE, Byun JY, Jung SE, et al. Neurogenic tumors in the abdomen: Tumor types and imaging characteristics. Radiographics. 2003;23(1):29-43.
- Westra SJ, Zaninovic AC, Hall TR, et al. Imaging of the adrenal gland in children. Radiographics. 1994;14(6):1323-1340.
Citation
A K, S M, MA B.MR Imaging of adrenal lesions. Appl Radiol. 2017; (4):18-24.
April 3, 2017