MR contrast agents: Applications in hepatobiliary imaging
Images


Liver imaging has improved with advances in magnetic resonance imaging (MRI) technology. With the advent of newer sequences and higher magnetic fields, which allow for greater temporal and spatial resolution, dynamic contrast-enhanced (CE) imaging of the liver now plays a dominant role in lesion characterization.
There has been much discussion about the use of CE MRI of liver masses.1,2 In this article, we briefly discuss the various MR contrast agents used in liver imaging, including classification, dose and mechanism of action, and side effects. We also discuss recent advancements in imaging features of focal liver lesions.
MR contrast agents have been classified based on their chemical properties, mechanism of action and their biological distribution. They can be divided into gadolinium-based chelated agents (GBCA) and non-GBCA. The non-GBCAs include reticuloendothelial (RE) agents and hepatobiliary (HPB) agents. The GBCAs and HPB agents are paramagnetic, while the RE agents are super-paramagnetic. Based on the biological distribution, GBCAs behave similar to iodinated contrast used in computed tomography (CT), by distributing into the extracellular compartment. The RE agents are accumulated in the reticuloendothelial system (i.e., Kupffer cells in the liver). The HPB agents are accumulated in the hepatocytes and excreted in bile.
Gadolinium-based chelate agents
The first GBCA to be used in clinical practice was Gd-DTPA (MAGNEVIST®, Bayer HealthCare Pharmaceuticals, Wayne, NJ). This was approved by the United States Food and Drug Administration (FDA) for use in humans in 1988.3 Since then, other GBCAs have been developed by pharmaceutical companies. Examples include Gd-DTPA-BMA (OMNISCAN™, GE Healthcare, Chalfont, St. Giles, U.K.), Gd-HP-DO3A (ProHance®, Bracco Diagnostics, Princeton, NJ), Gd-DTPA-BMEA (Optimark™, Covidien Pharmaceuticals, Hazelwood, MO), Gd-EOB-DTAP (Eovist®, Bayer HealthCare Pharmaceuticals) and Gd-BOPTA (MultiHance®, Bracco Diagnostics). The last 2 agents, Multihance and Eovist, are partly excreted in bile (hereafter referred to as HPB-Gd agents).
The GBCAs shorten the T1 relaxation times of the surrounding protons. In liver imaging, fast gradient recalled echo T1-weighted (T1W) sequences (such as dynamic 3D-LAVA, GE Healthcare) provide sufficient spatial and temporal resolution to allow for lesion characterization. This should also include a precontrast phase. Multiphasic contrast evaluation should be performed using a bolus tracking technique.4
The recommended dose for most of these agents depends on the amount of Gd and stands at 0.1 µmol/kg (0.2 mL/kg). Close to 100% of the injected dose is eliminated through the kidneys, with the exception of Eovist and MultiHance. The recommended dose for Eovist is 0.025 µmol/kg (0.1 mL/kg).
The incidence of side effects is low by comparison with the CT contrast agents.5 The rate of adverse events has been low and reported to be <1%.5 The most common side effects include non-specific symptoms such as nausea, vomiting and headache. Serious side effects such as anaphylaxis are rare (0.005% of patients).5
A recent concern is the development of nephrogenic systemic fibrosis (NSF). This condition was first diagnosed in 1997.6 Symptoms are similar to that of systemic sclerosis, but with the exception of facial sparing. Other symptoms include skin thickening, which restricts joint mobility and can lead to contractures and immobility. The visceral organs may also be involved, including the lungs, liver, muscles and myocardium. Mortality has been estimated at around 5%.7,8
As of February 1, 2008, there have been 190 biopsy-proven cases of NSF published in the peer-reviewed literature with the following associations: 157 gadodiamide (ONISCAN), 8 gado-pentetate (MAGNEVIST), 3 gadoversetamide (Optimark), and 18 unspecified GBCA, and 4 confounded cases with >1 GBCA. Five cases of NSF were unassociated with GBCA.9 Recent FDA warnings on the use of gadolinium based contrast agents recommends the avoidance of GBCA in patients suspected or known to have impaired drug elimination, unless the imaging is essential and not available without contrast. In that case, clinicians should administer only once during an imaging session, and monitor for signs and symptoms of NSF if GBCA is administered to patients with acute kidney injury, or chronic or severe kidney disease. An estimate of kidney function should be performed through laboratory testing for patients at risk of having reduced kidney function.10
These reported cases of NSF were related to advanced renal dysfunction and appeared to develop over a period of several days or months. Among patients with end-stage renal disease, the incidence of NSF in those who received Gd-chelate contrast agent ranged from 2.9% to 5%, and was independent of dose.11
It has been suggested that the displacement of Gd3+ from the chelating agent, a process known as transmetallation, is involved in the accumulation of free Gd3+ within the body tissues. This is one of the mechanisms thought to provoke an inflammatory response resulting in NSF.11 The rate of dissociation and thermodynamic stability of the compounds are listed in Table 1. Based on these factors, macrocyclic agents are thought to be less likely related to the release of free Gd3+ in vivo than the linear agents.12 Guidelines for contrast use, dose, and selection of contrast have been developed by the American College of Radiology (ACR) and various radiology departments as shown in Table 2.
Reticuloendothelial agents
The RE agents, also known as super-paramagnetic iron oxide (SPIO), were designed to accumulate in the Kupffer cells. These are usually present in normal liver tissue. In contrast to the Gd-chelate agents, which serve to accelerate the T2*-dephasing of protons, leading to signal loss in areas where they accumulate.13 Tissues that do not contain Kupffer cells, such as metastatic disease, demonstrate signal-loss lesions in the liver on T2*-weighted imaging (T2*W). Alternatively, Kupffer-cell–containing masses will show no significant signal loss on T2*W imaging.
A prototype of the RE agents is ferumoxide (Feridex®, Bayer HealthCare Pharmaceuticals), which contains 0.56 mg of iron per kg of body weight. This is diluted in 100 mL of 5% dextrose and injected slowly over a period of 30 min. Side effects are dose dependent. These include facial flushing, dyspnea, rash and lumbar pain.14 Feridex is no longer available in the United States. A newer agent, Ferucarbotran (Resovist®, Bayer Schering Pharma AG, Leverkusen, Germany) allowed for immediate imaging of the liver, and therefore reduced the overall examination time. The rapid action also meant that dynamic T1 sequences could be performed,15 however, development and production of Resovist ceased in 2009.
Hepatobiliary agents
The main application of the hepatobiliary (HPB) agents is in the imaging of the liver parenchyma and the biliary tree. Like Gd-chelate agents, these also work by shortening the T1-relaxation times (paramagnetic effects). The difference vs. Gd-chelate agents is that after the blood pool phase, they accumulate within the hepatocytes and are later excreted in bile.
One of the earliest HPB agents available was Mangafodipir trisodium. Mangafodipir trisodium is a manganese- based agent that dissociates rapidly in the blood following slow IV infusion (2 to 3 mL/min over a 10 to 20 min period), releasing free Mn2+ ions.16 The free ions are then available for uptake into the cells, particularly in the liver, pancreas, kidneys and adrenal glands. Maximum enhancement of the liver is usually observed after 20 min and lasts for 4 hours.
There are 2 GBCAs that have shown excretion of contrast through the biliary system (HPB-Gd): MultiHance (5%) and Eovist (55%). Eovist is the first HPB-Gd agent approved for liver imaging.17 It behaves as an extracellular agent on early dynamic imaging, but also possesses a hepatocyte-selective profile, and is accumulated in the liver and biliary system on delayed imaging at 20 min. The enhancement on the hepatocyte phase following the administration of Eovist is a function of the organic anion transporting polypeptide (OATP) in functioning liver cells.18 MultiHance is excreted to a lesser degree by the bile ducts and has been used as an HPB-Gd agent as well.19 Due to its smaller percentage of biliary excretion, delayed imaging needs to be performed between 45 min to 3 hours.
The advent of faster, high-resolution, thin-slice MRI has allowed excellent multiplanar reconstruction (MPR) for the evaluation of the biliary system. HPB agents have been used in CE assessment of the biliary tree, including visualization of post cholecystectomy biliary leaks,20 documenting patency of biliary-enteric anastamoses,21 and determining the proximity of lesions to the intrahepatic biliary ducts.
Imaging protocols
With Gd chelates, dynamic imaging is ideally performed using T1W 3-dimensional-gradient recalled echo (GRE) pulse sequences with fat saturation (for example, 3D-LAVA, GE Healthcare).22 This technique allows for a higher signal-to-noise ratio (SNR) and thinner effective slice thickness, compared with 2-dimensional methods without interslice gap or crosstalk. The technique also allows for thin-section coverage of the liver in a single breathhold. Fat saturation is commonly used because it helps improve the dynamic range in liver imaging and accentuates enhancement. This technique alone detects most of the clinically relevant focal liver lesions. Additional liver examination using unenhanced T1W, T2W and DWI sequences are helpful for lesion characterization and detection.
The 3 phases of dynamic post Gd liver imaging include a late arterial phase, portal venous phases and excretory phase. In general, for the first phase, a bolus tracking technique is recommended. The arterial phase should begin with acquisition of data in the center of k space imaging at 8 to 10 sec after contrast has reached the aorta at the level of the celiac axis.2 A 60 sec and 180 sec phase are obtained for the portal venous and excretory phases. At our institution, a 5 min delayed phase of imaging is also routinely added.1
In the setting of the HPB-Gd agents, a hepatocyte-specific delayed phase is obtained. This is performed at 20 min for Eovist23 and at 45 min to 3 hours for MultiHance.19
The manganese-based agent is not used in a dynamic fashion and is predominantly a T1-shortening agent. MR data acquisition should start ≥20 min after the end of contrast administration for the best imaging results. However, the diagnostic window is broad (≤4 hours) so exact timing is not mandatory;1 though this agent is no longer available. The imaging features will mimic HPB-Gd during the hepatocyte phase of enhancement.
Ferumoxide is given as a slow infusion over 30 min, followed by an interval of 30 min for accumulation, and an imaging window of 1 to 4 hours. T2*W GRE, T2W fat-saturated TSE or turbo-STIR sequences are preferred.1
Imaging of liver lesions
Common focal liver lesions are classified as benign vs. malignant. Benign lesions include cysts, hemangiomas, focal nodular hyperplasia (FNH), and adenoma, while common malignant lesions include hepatocellular carcinoma (HCC), as well as hyper- and hypovascular metastases. CE MRI is commonly used as a problem-solving tool for lesions that are indeterminate on other forms of imaging. A summary of the MRI imaging features is provided in Tables 3 and 4.
Hepatic cyst
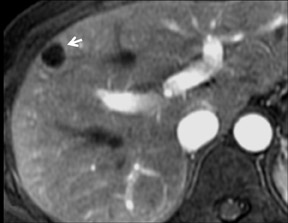
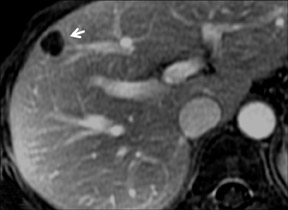
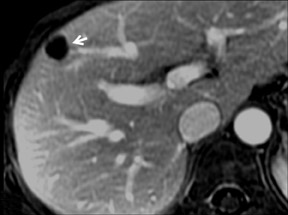
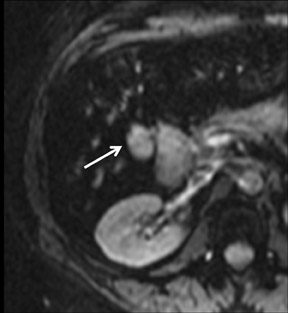
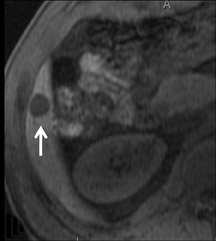
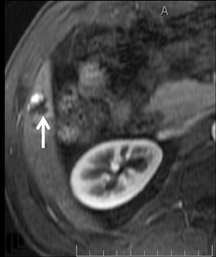
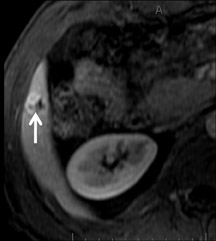
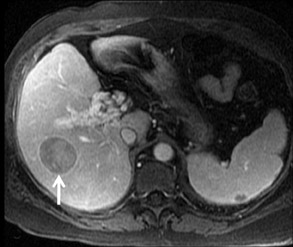
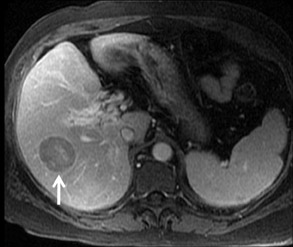
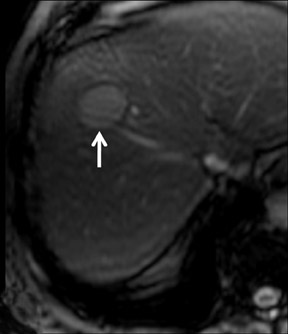
Cysts are fluid-filled cavities, and are typically hypointense on T1W imaging and hyperintense on T2W imaging, and do not enhance (Figure 1). The contrast-to-noise ratio (CNR) increases significantly with contrast administration. Hence, both extracellular and HPB-Gd agents (Figure 2) appear markedly hypointense on dynamic T1W GRE imaging. With HPB agents (Figure 3), the cysts appear as hypointense in all phases. With RE agents, they appear markedly hyperintense on T2*W imaging.
Hemangioma
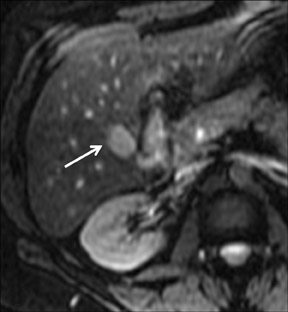
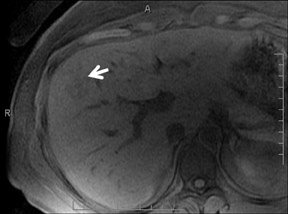
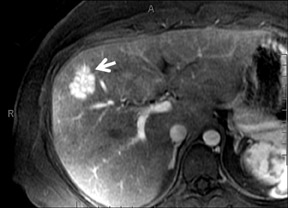
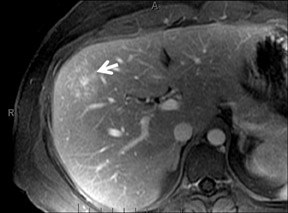
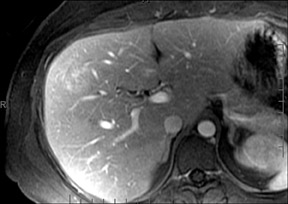
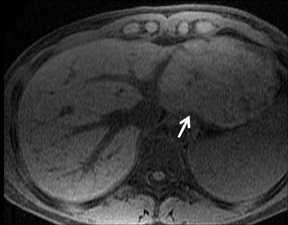
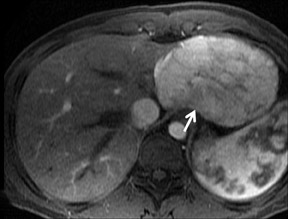
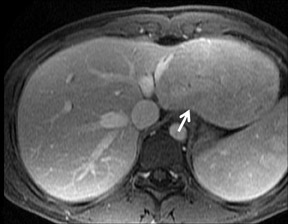
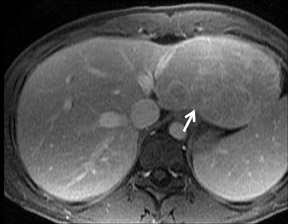
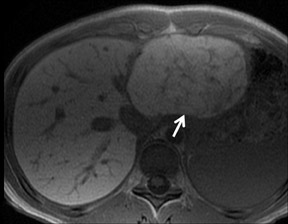
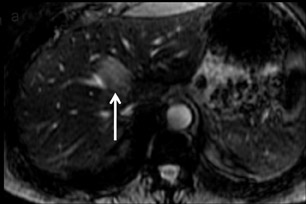
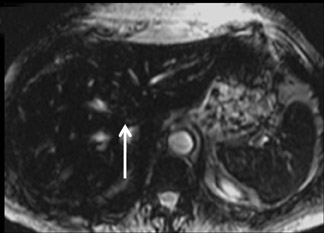
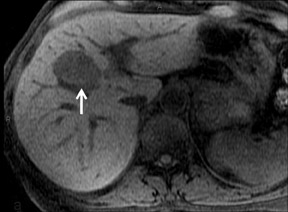
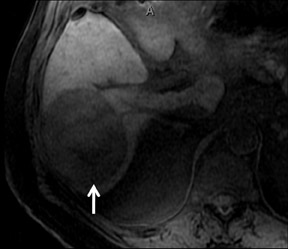
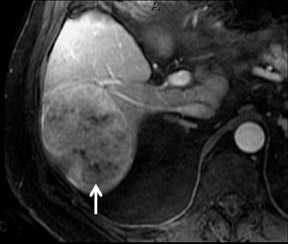
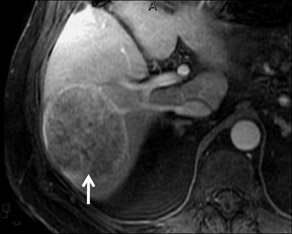
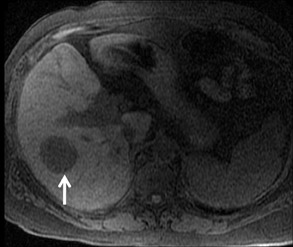
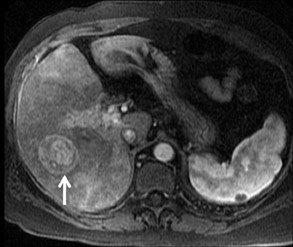
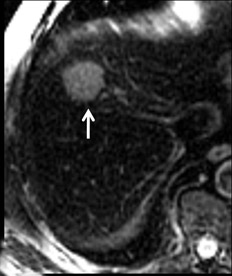
With Gd-chelate agents, hemangiomas demonstrate early peripheral nodular enhancement and delayed centripetal filling-in on T1W imaging (dynamic gradient recalled echo), paralleling that of CT imaging with iodinated contrast (Figure 4). As with other benign lesions, there can be some loss of T2 signal.24 As they do not contain hepatocytes, they remain hypointense in the hepatocyte phase following HPB agent administration.25 After RE agent administration, hemangiomas display the greatest SNR on T2W imaging among the focal liver lesions (excluding cysts).
Focal nodular hyperplasia
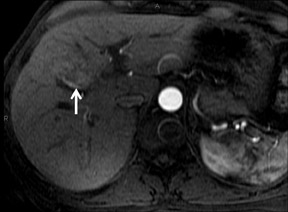
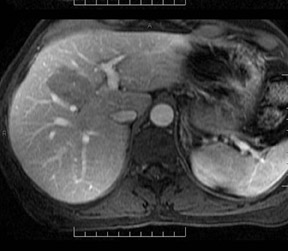
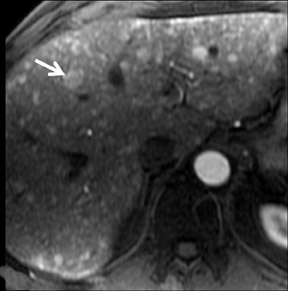
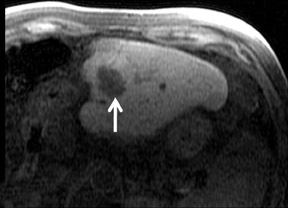
FNH is composed of multiple spherical aggregates of hepatocytes and proliferation of disordered biliary structures that do not communicate with the biliary tree. These lesions typically show early arterial enhancement and become isointense with the rest of the liver on the delayed phase using GBCAs on T1W GRE imaging at 3 to 5 min (Figure 5). A central scar is present in 40% of cases.26 It consists of fibrous tissue, which appears hyperintense on T2W imaging and may show delayed enhancement in some cases. Differential diagnoses include hepatic adenomas and fibrolamellar HCC. Some atypical FNHs present without arterial enhancement but show enhancement in the portal venous and equilibrium phases.27
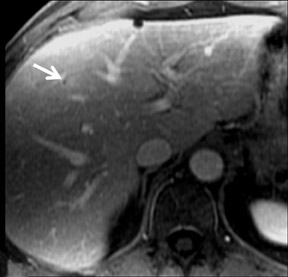
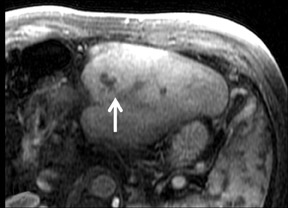
With the HPB agents, FNH typically demonstrates avid enhancements on the arterial phase. The difference from extracellular agents is that they are also taken up by the hepatocytes, and therefore remain hyperintense to the liver on hepatocyte phase imaging (Figure 6). Lesion conspicuity is reported to be higher than with the RE agents on delayed imaging.28 Even though the central scar is supposed to be rich in biliary ducts, these are disorganised and poorly functioning, leading to a persistent lack of enhancement on hepatocyte phase imaging.24 With Eovist, enhancement in the hepatocyte-phase after 10 and 20 min can be observed in 88% and 90% of lesions, respectively.29
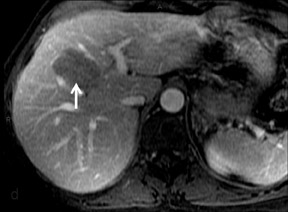
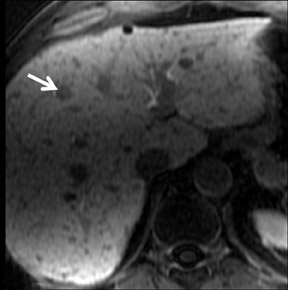
FNH lesions are mildly T2*-hyperintense on the precontrast phase. As they also contain Kupffer cells, there is uptake of the RE agents, resulting in marked signal intensity loss (Figure 7) that may be less than that of surrounding liver (30% in FNH vs. 68% in normal liver).19 This may distinguish them from other lesions such as HCC and adenoma, which show a signal drop of 3.3% and 6.6%, respectively.24
Hepatic adenoma
Adenoma cells are larger than normal hepatocytes and contain large amounts of glycogen and lipid. A heterogeneous appearance of adenoma is most likely due to fat, a hemorrhage, a necrosis or calcification.30 Three types have been described: the steatotic form that contains variable foci of fat, and hence fat signal; peliotic, which shows avid and persistent hypervascularity; and the mixed form, which is a combination of the steatotic and peliotic forms. With GBCAs, the peliotic form shows early and persistent enhancement, while the steatotic form shows minimal enhancement (Figure 8).31
Accurate differentiation of FNH from adenomas is often not possible on the basis of precontrast or dynamic phase images alone. Use of delayed T1W GRE imaging, with partially hepatocyte-selective agents, may differentiate adenomatous tissue from FNH. Both types of lesions may show avid enhancement on conventional CE protocols, but at 1 hour delayed imaging, most adenomas become hypointense while FNHs retain signal hyperintensity.29 Adenomas generally do not take up RE agents, even though there are a variable number of Kupffer cells within the lesions. This makes them appear as hyperintense on both pre- and post contrast T2*W imaging. Even though they consist of hepatocytes, the cells are of decreased function and adenomas do not accumulate HPB agents and appear hypointense.32
Hepatocellular carcinoma
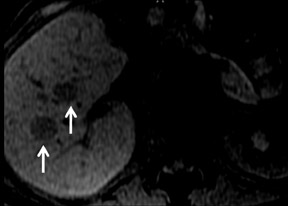
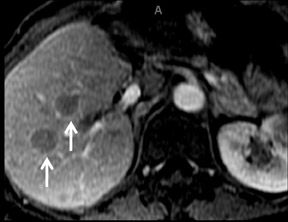
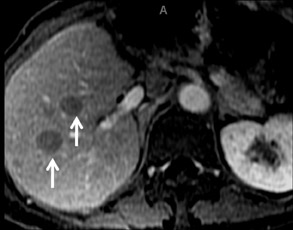
Although rare in Canada and the United States, hepatocellular carcinoma (HCC) ranks as the eighth-most common cancer in the world.33 On multiphase imaging with GBCAs, HCCs typically display arterial enhancement and washout on 5 min delayed imaging. Lesion conspicuity can be improved on delayed imaging at 3 to 5 min (Figures 9 and 10). Other features such as a pseudocapsule, a nodular or mosaic appearance, and fatty metaplasia may also be present.
Most HCCs demonstrate early enhancement during the arterial phase of contrast administration with GBCA. The portal venous phase and delayed phase show washout. The hepatobiliary agents have been utilized to distinguish HCC from other malignancies that are of non-hepatocellular origin.34 HCC will more commonly show low signal on the hepatocyte phase of contrast administration. This is thought to be determined by the expression of OATP.35 However, as their signal is variable, it is not always possible to distinguish between hypervascular metastasis and HCC. A combination of clinical history, laboratory data, and imaging features on T1W and T2W imaging will be key contributors to the correct diagnosis.
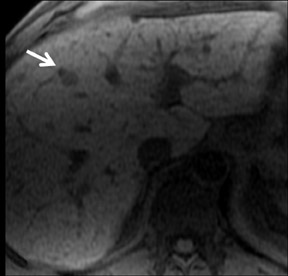
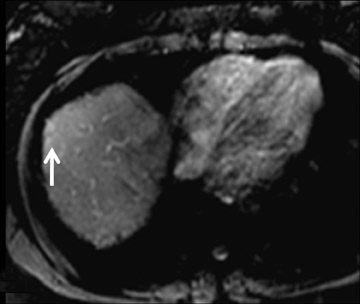
With RE agents, HCCs appear as T2 hyperintense lesions post contrast (Figure 11).36 Since the decrease in T2 signal is dependent on the number of Kupffer cells, RE agents have been reported to distinguish between well-differentiated and poorly differentiated HCC.37 Quantitative analysis of the SPIO intensity index has been shown at significantly higher value in dysplastic nodules and well-differentiated HCC, when compared with moderately differentiated and poorly differentiated HCC.38 Double contrast MRI with SPIO and bolus injection of GBCA improves the diagnosis of HCC.39
Metastases
Common hypervascular metastases include those from renal and thyroid primaries. On multiphase dynamic imaging of the liver following administration of GBCAs, they show avid enhancement on the arterial phase and usually become hypointense to the rest of the liver on the subsequent phases (Figure 12). With the HPB-Gd agents, they show low signal intensity on delayed imaging on T1W imaging, due to a lack of Kupffer cells (Figure 13). And, with the RE agents, they remain hyperintense on T2W imaging, differentiating them from hypervascular lesions of hepatocellular orgin, such as typical FNH and some HCCs (Figure 14).
Hypovascular metastases—such as colon and breast carcinoma—appear as hypointense on T1W imaging throughout all post Gd dynamic phases of the scan, though they often show peripheral rim enhancement. With RE agents, there is no loss of T2* signal in the post contrast scans (Figure 15). With the use of hepatocyte-specific agents, the effects of contrast washout in the lesions and contrast accumulation in normal surrounding liver increases tumor conspicuity, improving lesion detection (Figure 16).40
Recent MR advances
Recent advances in MRI, including the use of parallel imaging and 3-dimensional volume gradient echo sequences, have allowed for the shortening of liver imaging time to <15 sec, without significant loss of in-plane resolution, and a decrease in slice thickness.
Multiphase imaging has been a work-horse of liver imaging both in CT and MRI. As this technique continues to provide faster sequences, future imaging will include double arterial, or improved-resolution imaging, without significant loss of spatial resolution. In this setting, the familiarity of the appearance of common liver lesions, following contrast administration, is required and will become the cornerstone of liver imaging by MRI. Hepatocyte agents have allowed for the addition of a new biological property of these agents to complement the initial faster sequences.
Conclusion
The use of contrast in MRI improves liver lesion detection. This is possible because of recent advances in image acquisition techniques that allow for excellent spatial and temporal resolution. Contrast agents that reflect the issue composition provide further information that can assist in characterizing the lesions. A sound knowledge of the behavior and limitations of each agent enables the radiologist to optimize MRI as a problem-solving tool in the assessment of liver lesions.
REFERENCES
- Ba-Salamah A, Uffmann M, Saini S, et al. Clinical value of MRI liver-specific contrast agents: A tailored examination for a confident non-invasive diagnosis of focal liverlesions. Eur Radiol. 2009;19:342-357.
- Gandhi SN, Brown MA, Wong JG, et al. MR contrast agents for liver imaging: What, when, how. Radiographics. 2006;26:1621-1636.
- Runge VM. Gd-DTPA: An i.v. contrast agent for clinical MRI. Int J Rad Appl Instrum B. 1988;15:37-44.
- Earls JP, Rofsky NM, DeCorato DR, et al. Hepatic arterial-phase dynamic gadolinium-enhanced MR imaging: Optimization with a test examination and a power injector.Radiology. 1997;202:268-273.
- Bleicher AG, Kanal E. Assessment of adverse reaction rates to a newly approved MRI contrast agent: Review of 23,553 administrations of gadobenate dimeglumine. AJR Am J Roentgenol. 2008;191:W307-311.
- Cowper SE. Nephrogenic fibrosing dermopathy: The first 6 years. Curr Opin Rheumatol. 2003;15:785-790.
- Thomsen HS. Questions and answers re NSF and Gadolinium. ISMRM. Available at: http://www.ismrm.org/special/QNA.pdf. Accessed on October 13, 2010.
- Broome DR, Girguis MS, Baron PW, et al. Gadodiamide-associated nephrogenic systemic fibrosis: Why radiologists should be concerned. AJR Am J Roentgenol.2007;188:586-592.
- Broome DR. Nephrogenic systemic fibrosis associated with gadolinium based contrast agents: A summary of the medical literature reporting. Eur J Radiol. 2008;66:230-234.
- United states Food and Drug Administration. FDA Drug Safety Communication: New warnings for using gadolinium-based contrast agents in patients with kidney dysfunction. Available at: http://www.fda.gov/Drugs/DrugSafety/ucm223966.htm. Accessed October 26, 2010.
- Shabana WM, Cohan RH, Ellis JH, et al. Nephrogenic systemic fibrosis: A report of 29 cases. AJR Am J Roentgenol. 2008;190:736-741.
- Rofsky NM, Sherry AD, Lenkinski RE. Nephrogenic systemic fibrosis: A chemical perspective. Radiology. 2008;247:608-612.
- Tanimoto A, Kuribayashi S. Application of superparamagnetic iron oxide to imaging of hepatocellular carcinoma. Eur J Radiol. 2006;58:200-216.
- Weissleder R. Liver MR imaging with iron oxides: Toward consensus and clinical practice. Radiology. 1994;193:593-595.
- Reimer P, Muller M, Marx C, et al. T1 effects of a bolus-injectable superparamagnetic iron oxide, SH U 555 A: Dependence on field strength and plasma concentration—preliminary clinical experience with dynamic T1-weighted MR imaging. Radiology. 1998;209:831–836.
- Bernardino ME, Young SW, Lee JK, et al. Hepatic MR imaging with Mn-DPDP: Safety, image quality, and sensitivity.Radiology. 1992;183:53-58.
- Thompson CA. Contrast agent approved for liver imaging. Am J Health Syst Pharm. 2008;65:1490.
- Filippone A, Blakeborough A, Breuer J, et al. Enhancement of liver parenchyma after injection of hepatocyte-specific MRI contrast media: A comparison of gadoxetic acidand gadobenate dimeglumine. J Magn Reson Imaging. 2010;31:356-364.
- Schneider G, Altmeyer K, Kirchin MA, et al. Evaluation of a novel time-efficient protocol for gadobenate dimeglumine (Gd-BOPTA)-enhanced liver magnetic resonance imaging. Invest Radiol. 2007;42:105-115.
- Hoeffel C, Azizi L, Lewin M, et al. Normal and pathologic features of the postoperative biliary tract at 3D MR cholangiopancreatography and MR imaging. Radiographics.2006;26:1603-1620.
- Hottat N, Winant C, Metens T, et al. MR cholangiography with manganese dipyridoxyl diphosphate in the evaluation of biliary-enteric anastomoses: Preliminary experience.AJR Am J Roentgenol. 2005;184:1556-1562.
- Lee VS, Lavelle MT, Rofsky NM, et al. Hepatic MR imaging with a dynamic contrast-enhanced isotropic volumetric interpolated breath-hold examination: Feasibility, reproducibility, and technical quality.Radiology. 2000;215:365-372.
- Zech CJ, Herrmann KA, Reiser MF, et al. MR imaging in patients with suspected liver metastases: Value of liver-specific contrast agent Gd-EOB-DTPA. Magn Reson Med Sci. 2007;6:43-52.
- Paley MR, Mergo PJ, Torres GM, et al. Characterization of focal hepatic lesions with ferumoxides-enhanced T2-weighted MR imaging. Am J Roentgenol. 2000;175:159-163.
- Kim MJ, Kim JH, Lim JS, et al. Detection and characterization of focal hepatic lesions: Mangafodipir vs. superparamagnetic iron oxide-enhanced magnetic resonance imaging. J Magn Reson Imaging. 2004;20:612-621.
- Ba-Ssalamah A, Schima W, Schmook MT, et al. Atypical focal nodular hyperplasia of the liver: Imaging features of nonspecific and liver-specific MR contrast agents. AJR Am J Roentgenol. 2002;179:1447-1456.
- Asbach P, Klessen C, Koch M, et al. Magnetic resonance imaging findings of atypical focal nodular hyperplasia of the liver.Clin Imaging. 2007;31:244-252.
- Grazioli L, Morana G, Kirchin MA, et al. Accurate differentiation of focal nodular hyperplasia from hepatic adenoma at gadobenate dimeglumine-enhanced MR imaging:Prospective study. Radiology. 2005;236:166-177.
- Zech CJ, Grazioli L, Breuer J, et al. Diagnostic performance and description of morphological features of focal nodular hyperplasia in Gd-EOB-DTPA-enhanced liver magnetic resonance imaging: Results of a multicenter trial. Invest Radiol. 2008;43:504-511.
- Grazioli L, Federle MP, Brancatelli G, et al. Hepatic adenomas: Imaging and pathologic findings. Radiographics. 2001;21:877-892.
- Lewin M, Handra-Luca A, Arrivé L, et al. Liver adenomatosis: Classification of MRI features and comparison with pathologic findings. Radiology. 2006;241:433-440.
- Ringe KI, Husarik DB, Sirlin CB, Merkle EM. Gadoxetate disodium-enhanced MRI of the liver: Part 1, protocol optimization and lesion appearance in the non-cirrhotic liver.AJR Am J Roentgenol. 2010; 195:13-28.
- Yu MC, Yuan JM, Govindarajan S, et al. Epidemiology of hepatocellular carcinoma. Can J Gastroenterol. 2000;14:703-709.
- Cruite I, Schroeder M, Merkle EM, Sirlin CB. Gadoxetate disodium-enhanced MRI of the liver: Part 2, protocol optimization and lesion appearance in the cirrhotic liver.AJR Am J Roentgenol. 2010; 195:29-41.
- Narita M, Hatano E, Arizono S, et al. Expression of OATP1B3 determines uptake of Gd-EOB-DTPA in hepatocellular carcinoma. J Gastroenterol. 2009;44:793-798.
- Yukisawa S, Okugawa H, Masuya Y, et al. Multidetector helical CT plus superparamagnetic iron oxide-enhanced MR imaging for focal hepatic lesions in cirrhotic liver: Acomparison with multi-phase CT during hepatic arteriography. Eur J Radiol. 2007;61:279-289.
- Lim JH, Choi D, Cho SK, et al. Conspicuity of hepatocellular nodular lesions in cirrhotic livers at ferumoxides-enhanced MR imaging: Importance of Kupffer cell number.Radiology. 2001;220:669-676.
- Inoue T, Kudo M, Watai R, et al. Differential diagnosis of nodular lesions in cirrhotic liver by post-vascular phase contrast-enhanced US with Evovist: Comparison with super-paramagnetic iron oxide magnetic resonance images. J Gastroenterol. 2005;40:1139-1147.
- Ward J, Robinson PJ, Guthrie JA, et al. Liver metastases in candidates for hepatic resection: Comparison of helical CT and gadolinium- and SPIO-enhanced MR imaging.Radiology. 2005;237:170-180.
- Huppertz A, Balzer T, Blakeborough A, et al. Improved detection of focal liver lesions at MR imaging: Multicenter comparison of gadoxetic acid-enhanced MR images withintraoperative findings. Radiology. 2004;230:266-275.
- Ersoy H, Rybicki FJ. Biochemical safety profiles of gadolinium-based extracellular contrast agents and nephrogenic systemic fibrosis. J Magn Reson Imaging. 2007;26:1190-1197.