Diffusion MRI: Overview and clinical applications in neuroradiology
Images
Dr. Maas is an Associate Radiologist with the X-Ray Medical Group in La Mesa, CA. At the time this article was completed, he was a Clinical Fellow in Magnetic Resonance Imaging at the University of California, San Diego, CA. Dr. Mukherjee is an Assistant Professor in Residence, Department of Radiology, University of California, San Francisco, CA.
Clinical diffusion neuroimaging, introduced in the early 1990s, was quickly adopted in the evaluation of suspected acute ischemic brain injury. Many other clinical applications have also been described in the diagnosis of intracranial infections, masses, trauma, and edema. Numerous pitfalls in the interpretation of diffusion images have also become apparent, necessitating a better understanding of the physical basis of diffusion MR imaging.
Technical aspects of diffusion imaging
Physics of diffusion imaging
Diffusion describes the constant random motion that all molecules undergo because of their intrinsic thermal energy. Clinical diffusion imaging studies the molecular motion of water, probing its mobility on the cellular scale. The diffusion coefficient, measured in mm 2 /sec, relates the average motion, in a mean-squared sense, to the observation time, with higher values of this coefficient indicating more mobile water molecules. The apparent diffusion coefficient (ADC) characterizes water mobility observed in the clinical setting, reflecting the limitation that, in vivo, pure diffusion cannot be easily separated from other sources of water mobility, such as active transport, changes in membrane permeability, and pressure gradients.
A typical diffusion-weighted pulse sequence is constructed by the addition of a pair of diffusion-sensitizing gradients, also known as motion-probing gradients, applied along the same directional axis before and after the 180° refocusing pulse of a spin-echo sequence. 1 Diffusion thus results in loss of signal due to incomplete rephasing of spins that change position between and during the applications of the 2 diffusion-sensitizing gradients. This contrast effect can be described by the following exponential model:
S i = S 0 exp (-b ×ADC i )
In the equation, S i is the diffusion-weighted signal observed at a given voxel with the diffusion-sensitizing gradients applied along direction i , and S 0 is the signal at the same voxel without the addition of the diffusion-sensitizing gradients. Within the exponential term, the b factor is a measure of diffusion weighting that summarizes the shape, strength, duration, and temporal spacing of the diffusion-sensitizing gradients, with typical b values on the order of 1000 sec/mm 2 in clinical applications. ADC i is the apparent diffusion coefficient of water along the direction of the diffusion-sensitizing gradients. Thus, higher water mobility, with higher ADC values, results in lower observed signal S i in the diffusion-weighted sequence. Conversely, decreased water mobility, with reduced ADC values, results in higher observed signal.
Isotropy, anisotropy, and rotational invariance
In isotropic diffusion, molecular mobility is equal in all directions. Pure water at body temperature demonstrates isotropic diffusion, with an ADC of approximately 3.0 ×10 -3 mm 2 /sec. In anisotropic diffusion, molecular mobility is not equal in all directions. In white matter, for example, tightly packed axons hinder water movement perpendicular to the axonal tracts, resulting in relatively greater observed molecular mobility parallel to the tracts, rather than orthogonal to them, 2 a property that can be observed in developing white matter even before myelination. 3
In the isotropic case, the choice of direction for the diffusion-sensitizing gradient is not important, as the ADC is identical for all directions. This is not true, however, in the anisotropic case. For example, if only a single diffusion direction were probed, interpretation and reproducibility of resultant diffusion-weighted images would be complicated by variable signal observed in white-matter tracts, depending on their orientation as well as the orientation of the patient's head. While this property can be exploited in techniques such as diffusion tensor imaging, 4 discussed later, it can be a nuisance in routine clinical diffusion-weighted imaging (DWI). To avoid this issue, measures with the property of rotational invariance are typically computed from the original diffusion-weighted data, as these measures mathematically eliminate any directional dependence in the image set.
Computation of commonly employed rotationally invariant measures, such as the geometric mean and trace, discussed in detail below, requires at least 4 separate image acquisitions: 1 without diffusion-sensitizing gradients (or equivalently, with b = 0 sec/mm 2 ), labeled S 0 , and 3 probing motion along 3 mutually orthogonal directions, labeled S 1 , S 2 , and S 3 , respectively.
Technical considerations in diffusion imaging
Since even minimal bulk patient motion during acquisition of diffusion-weighted images can obscure the effects of the much smaller microscopic water motion due to diffusion, fast imaging sequences are necessary for successful clinical DWI. Most commonly, diffusion imaging is performed using single-shot spin-echo echoplanar imaging (EPI) techniques. 5 Because images can be acquired in a fraction of a second, artifact from patient motion is greatly reduced, and motion between acquisitions with the different required diffusion-sensitizing gradients is also decreased. Limitations of EPI include the limited spatial resolution due to smaller imaging matrices as well as to the blurring effect of T2*-decay occurring during image readout, and sensitivity to artifacts due to magnetic field inhomogeneity, chemical shift effects, ghosting, and local susceptibility effects. The last of these is particularly important, as it results in marked distortion and signal drop-out near air cavities, particularly at the skull base and the posterior fossa, limiting sensitivity of DWI with EPI in these areas.
Other pulse sequences have also been applied to diffusion imaging, including variations of fast spin-echo imaging, 6,7 multishot EPI, 8 spiral imaging, 9 and line-scan methods. 10 Multishot methods typically have reduced sensitivity to susceptibility artifacts, which can improve imaging of the skull base and posterior fossa, and typically allow for use of lower performance gradients when compared with single-shot EPI-based methods. They are, however, intrinsically more sensitive to artifacts from bulk patient motion during image acquisition, an effect that can be reduced in part by the use of navigator echo methods. 11
Newer diffusion imaging applications at higher field strength and with parallel imaging techniques will be discussed later.
DWI, ADC, and T2 shine-through
As described above, the typical clinical diffusion imaging study acquires 4 images at each level: ( a ) 1 image without diffusion weighting (S 0 ), also known as the b = 0 sec/mm 2 or "b zero" image, which, for the echo times and repetition times used in typical diffusion applications, has image contrast similar to that of a conventional T2-weighted spin-echo image; and ( b ) 3 images with diffusion weighting along mutually orthogonal directions (S 1 , S 2 , and S 3 ). For the reasons described earlier, the diffusion-weighted images submitted to the radiologist for interpretation are not typically the set of component images S 1 , S 2 , and S 3 , but rather the rotationally invariant geometric mean computed from these 3 images, also known as the iso-tropic diffusion-weighted image.
To understand the contrast mechanisms contributing to the geometric mean diffusion-weighted image, expand the terms of the geometric mean:
S
DWI
= (S
1
× S
2
× S
3
)
1/3
= S
0
exp (-b × (ADC
1
+ ADC
2
+ ADC
3
)/3)
= S
0
exp (-b × ADC)
where ADC 1 , ADC 2 , and ADC 3 are the apparent diffusion coefficients along the directions of the 3 diffusion-sensitizing gradients, and, in the final expression:
ADC = (ADC 1 + ADC 2 + ADC 3 )/3
This last variable, ADC, is the average of the ADC values along 3 orthogonal directions and is also rotationally invariant. It is known as the mean diffusivity, "trace," D av , or, simply, the ADC. Henceforth in this discussion, as is typical in the clinical setting, when the acronym ADC is used, it will refer to this averaged value.
An important observation is made by examining the last line of the expansion for the geometric mean: There are 2 major sources of contrast in the diffusion-weighted image, the T2-weighted term S 0 and the exponential term related to diffusion. Thus, hyperintensity on DWI may be related to T2 prolongation (large S 0 term), reduced diffusion (large exponential term from small ADC value), or both. When high signal intensity is observed on DWI due to a dominant T2-related term in the setting of normal or even elevated ADC, it is known as T2 shine-through.
Simply examining the b = 0 sec/mm 2 image or corresponding conventional T2-weighted image is not a reliable method for differentiating between truly reduced diffusion and T2 shine-through, since both prolonged T2 and reduced diffusion may coexist. Instead, it is necessary to mathematically eliminate T2-weighting from the diffusion-weighted image. Two approaches are commonly employed: Generation of attenuation coefficient (AC) maps and ADC maps. In practice, either the AC map or the ADC map can be used to determine whether hyperintensity on DWI represents true reduction of diffusion or T2 shine-through.
An AC map can be computed by dividing the diffusion-weighted geometric mean image by the T2-weighted b = 0 sec/mm 2 image, S 0 . This yields:
S
AC
= S
DWI
/S
0
= exp (-b × ADC).
Note from the last expression that only the diffusion-related exponential term remains, eliminating the T2- weighting effects. Like DWI, areas of reduced diffusion appear bright on AC maps, and areas of elevated diffusion appear dark. This AC map is also known as the exponential diffusion image, the exponential image, or the attenuation factor map.
Alternatively, an image map of ADC values can be obtained by further manipulating the AC map to solve for ADC at each voxel:
ADC = -ln (S AC )/b
where ln( ) refers to the natural logarithm function. The image contrast on ADC maps is opposite to that of DWI or AC maps, in that lesions with reduced diffusion appear dark and those with elevated diffusion appear bright.
Diffusion imaging of the normal human brain
In the normal adult brain, the ADC of gray and white matter are very similar, such that DWI has very little intrinsic contrast. Any contrast observed is primarily due to underlying differences in T2, ie, the contrast of the S 0 component of the image.
Measured mean diffusivities in adult brain in vivo are 0.67 to 0.83 ×10 -3 mm 2 /sec for gray matter and 0.64 to 0.71 ×10 -3 mm 2 /sec for white matter. 12 This differs from newborns and children, in whom ADC is initially very high at term, approximately twice normal adult levels, with slightly higher values observed in white matter. Normal ADC values drop steeply over the first 2 years of life, and then decrease more gradually to adult values over several years. 13 Conversely, in normal older patients, mild increases in average brain ADC values may be seen with advancing age. 14
Clinical applications of diffusion imaging
Cerebral ischemia
Evaluation of ischemic brain injury is the most established clinical application of diffusion imaging. First studied in animal models of stroke in the early 1990s, 15,16 diffusion imaging was subsequently validated in human patients. 17,18 The known evolution of diffusion changes in large-vessel territorial infarcts aids in dating these insults, 19,20 which impacts treatment and outcomes for stroke patients. 21 Diffusion imaging also aids in the identification of areas of acute ischemic injury against the backdrop of diffuse nonspecific T2-weighted signal abnormalities that are often seen in elderly patients, 22 or when infarcts of different ages coexist.
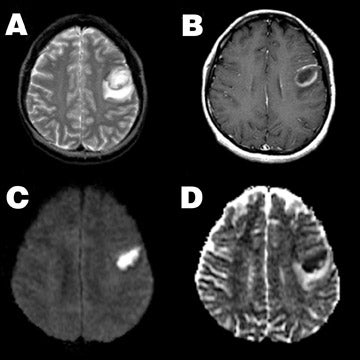
Acute ischemic stroke is characterized by very high signal on DWI and marked reduction in ADC values (Figure 1). In stroke patients, reduced diffusion can be observed within minutes to <1 hour after witnessed ictus, before any findings are apparent on conventional MRI. The marked increase in DWI signal in areas of acute ischemia, relative to unaffected brain, is typically so striking that this finding has been referred to as the "lightbulb sign" of acute stroke.
While many factors likely play a role, the development of cytotoxic edema is considered the major pathophysiologic event leading to reduced diffusivity in acute stroke. When perfusion falls below a critical threshold of approximately 10 to 20 mL/100 g/min, cellular energy metabolism is disrupted, ionic membrane pumps fail, and osmotic cellular swelling occurs. Because water diffusivity of the intracellular space is normally lower than that of the extracellular space, this shift of water results in a reduced average diffusivity in each imaging voxel. 15,16,23
As the ischemic cascade continues, ADC continues to decrease for 8 to 32 hours to ≤50% of normal values, and remains markedly reduced for 3 to 5 days. T2-weighted signal begins to increase approximately 2 to 4 hours after ictus, further increasing DWI signal, and is thought to mark the onset of irreversible injury. Subsequently, as extracellular water increases and cells begin to lyse, ADC begins to rise back toward normal values.
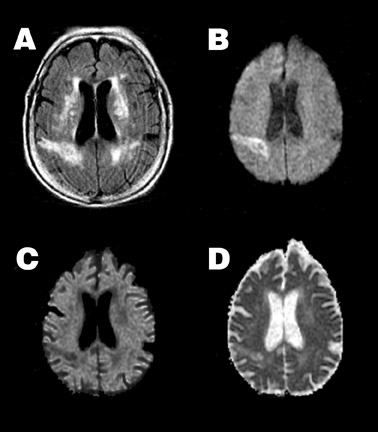
Typically, approximately 7 days post-ictus, ADC passes back through the normal range, resulting in "pseudonormalization" or "fogging" of the infarct on ADC maps. Although not visible on ADC maps at this time, the infarct typically remains somewhat hyperintense on DWI because of T2 shine-through effects (Figure 2). With further cell lysis and necrosis, ADC rises above normal levels. If the increase in signal on DWI from the prolonged T2 is balanced by the decrease in signal from the high ADC, the lesion will appear isointense on DWI, a phenomenon known as "T2 washout." 24
Finally, with tissue cavitation and gliosis in the chronic stage, ADC remains elevated. The DWI signal of chronic infarcts may range from hypointense to mildly hyperintense, depending on the relative balance of signal contribution from elevated ADC and prolonged T2. Variations in time course
Various adjacent brain areas affected by a large-vessel territorial infarct may progress through the pattern of reduced, pseudonormal, and then elevated ADC at different temporal rates. 25 Pseudonormalization of ADC may occur earlier following thrombolytic therapy, as early as 1 to 2 days post-ictus, 26 or later in elderly patients. 27 The magnitude and time course of ADC changes in territorial infarcts may also differ between gray matter and white matter. 28,29 Other types of ischemia, such as small-vessel lacunar infarction or watershed infarction, may also have different time evolution of ADC from that of large-vessel territorial infarction. For example, ADC in deep watershed infarcts may remain reduced for a month or longer. 30
As compared with arterial infarcts, diffusion changes observed in venous ischemia may be quite variable, as imaging findings consistent with cytotoxic edema, vasogenic edema, mixed cytotoxic/ vasogenic edema, and no changes at all have been reported. 31-33
Reversibility
While many animal studies have found reversibility of diffusion abnormalities in experimental ischemia depending on duration of ischemia or degree of initial ADC restriction observed, 16,34,35 tissue with typical reduction of ADC in human stroke patients nearly always undergoes infarction in humans. For example, only 5 reversible DWI-positive lesions were seen in >7000 cases at Massachusetts General Hospital, 36 and only 1 of these 5 was due to hyperacute arterial ischemia. The remaining 4 cases were caused by venous sinus thrombosis
(3) and hemiplegic migraine (1). Thus, at present, abnormally reduced diffusion in the setting of suspected acute ischemia predicts progression to infarction with high confidence, particularly for large-vessel territorial insults.
The ischemic penumbra
The majority of large-vessel territorial infarcts increase in volume on serial DWI studies, reaching a maximum volume at 48 to 72 16,20,37,38 This observation has given rise to the concept of the ischemic penumbra, wherein a core area of ischemia represented by the initially abnormal area of diffusion is surrounded by a region of tissue that is hypoperfused but has not yet fallen below the critical perfusion threshold. 39 The penumbra, identified as the area around the core lesion demonstrating prolonged transit times or decreased peak signal dropout on dynamic susceptibility contrast perfusion MR imaging, is often considered as oligemic tissue at risk of infarction. Its presence on imaging has been used as a criterion for institution of thrombolytic therapy, in an attempt to limit infarction to the core zone by restoring perfusion to the penumbra.
Clinical mimics of ischemic stroke
Reported sensitivities and specificities for diffusion imaging in hyperacute and acute infarction are 88% to 100% and 86% to 100%, respectively. 40-42 While occasional small lacunar lesions of the brainstem or of the deep gray nuclei may be missed by diffusion imaging, the absence of reduced diffusion in the patient with acute stroke-like symptoms suggests nonischemic etiologies 43 (such as seizure, migraine, peripheral vertigo, among other disorders) and mitigates against the need for anticoagulation treatment.
Sensitivity of DWI for venous ischemia may be lower than for acute arterial ischemia, as venous ischemia often does not produce cytotoxic edema. One study of diffusion and perfusion MR in venous thrombosis showed reduced cerebral blood flow and elevated mean transit time with normal ADC in affected tissue, corresponding to an ischemic penumbra without an ischemic core. 32
There are also many clinical mimics of stroke that may appear hyperintense on DWI; the most commonly encountered of these entities are discussed further below. These can be divided conceptually into 2 groups: Those with bright DWI signal due to T2 shine-through, usually related to vasogenic edema, and those with bright DWI signal due to truly reduced ADC. Those caused by T2 shine-through can generally be identified by examination of the ADC or AC maps. Those caused by reduced diffusion can often be separated on the basis of conventional imaging findings, but not always (including seizures, familial hemiplegic migraine, Creutzfeldt-Jakob disease with unilateral cortical involvement, etc.).
Vasogenic edema
Elevated T2-weighted signal from acute ischemia and from vasogenic edema cannot always be reliably distinguished on conventional imaging. For example, vasogenic edema from hyperperfusion syndrome following carotid endarterectomy may resemble a middle cerebral artery stroke, both clinically and on conventional imaging. 44 Diffusion properties can aid in differentiating these two entities, since vasogenic edema, characterized by an increase in more mobile extracellular water, results in elevated ADC, 45,46 while the cytotoxic edema of acute stroke, as discussed above, exhibits reduced ADC. It is important to note that vasogenic edema can sometimes appear slightly hyperintense on DWI, despite the elevation of ADC, due to T2 shine-through effects, again illustrating the increased specificity of ADC maps for true reduced diffusion.
The imaging distinction between vasogenic and cytotoxic edema can be very useful in disorders where both co-exist, as distinguishing vasogenic edema from cytotoxic edema in these disorders may be important for determining patient prognosis following appropriate therapy. Examples include venous thrombosis and reversible posterior leukoencephalopathy, also known as posterior reversible encephalopathy syndrome, and venous thrombosis. Venous thrombosis often produces a mixture of vasogenic and cytotoxic edema, 31 with the presence of cytotoxic edema associated with a worse prognosis. Posterior reversible encephalopathy syndrome, triggered by factors such as acute hypertension, eclampsia, and cyclosporine and other immunosuppressant drugs, may clinically mimic posterior circulation infarction. Posterior reversible encephalopathy syndrome is characterized by vasogenic edema, predominantly in the posterior circulation territory, but occasionally may also be complicated by acute ischemia with resultant cytotoxic edema. 24,47,48 As with venous thrombosis, the presence of cytotoxic edema is associated with a worse neurologic outcome.
Head trauma
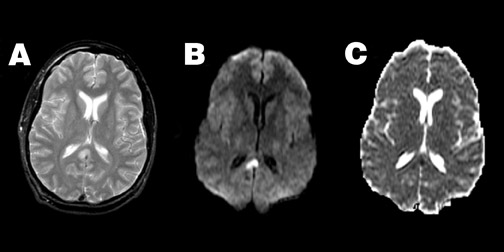
Diffusion imaging can also aid in the evaluation of closed head injury with suspected axonal shearing, with higher sensitivity to diffuse axonal injury (DAI) lesions than either fast spin-echo T2-weighted imaging or gradient echo T2*-weighted imaging when patients are imaged within 48 hours of injury. 49 Typically, acute DAI lesions show reduced ADC (Figure 3). However, DAI lesions can also exhibit increased ADC, or no change at all, 49-51 and the posttraumatic reduction of ADC may be reversible in some instances. 52
Perinatal hypoxic-ischemic brain injury
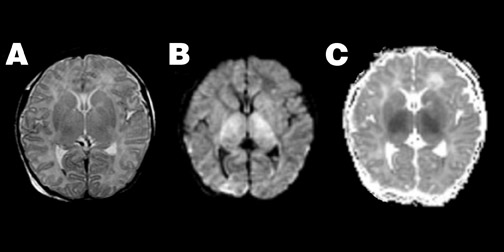
Diffusion imaging complements conventional imaging in the evaluation of perinatal brain injury, as diffusion abnormalities better illustrate the extent of perinatal brain injury when compared with conventional MRI, particularly when performed between the second and fourth days of life. 53-55 Because of the high water content of the neonatal brain, these changes may be more evident on ADC maps than on DWI (Figure 4).
Infections
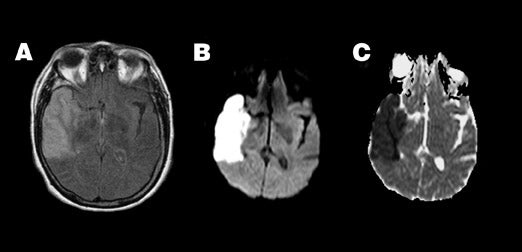
Pyogenic abscess-- Increased viscosity in a pyogenic abscess or empyema due to inflammatory debris, cellularity, and protein content results in homogeneous restriction of ADC and hyperintensity on DWI 56,57 (Figure 5). This property aids in the differentiation of an intracranial abscess and a centrally necrotic neoplasm, both of which can appear as similar ring-enhancing lesions on conventional imaging. While not 100% specific, an abscess will typically show high central signal on DWI with correspondingly reduced ADC when compared with 46,56-58 Thus, diffusion findings can guide stereotactic neurosurgical planning, ie, central aspiration and drainage for suspected abscess versus biopsy of enhancing wall for suspected tumor.
Additionally, diffusion characteristics may aid in the differential diagnosis of extra-axial collections complicating bacterial meningitis, as sterile subdural effusions and subdural empyema may have a similar appearance on conventional imaging. On DWI, a subdural empyema will typically show hyperintense signal with reduced ADC, similar to pyogenic parenchymal abscesses. Conversely, sterile effusions have elevated ADC similar to cerebrospinal fluid (CSF) and are thus typically hypointense on DWI.
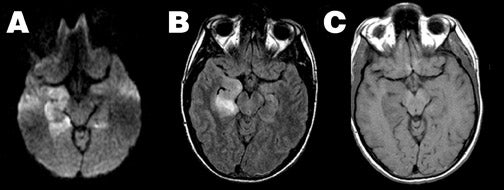
Herpes encephalitis-- Herpes encephalitis is characterized by cytotoxic edema, frequently involving the temporal lobes, resulting in marked hyperintensity on DWI and restricted ADC (Figure 6). As herpes encephalitis may occasionally mimic infiltrative tumors of the temporal lobe on conventional imaging, diffusion imaging can help differentiate herpes from tumor, as the ADC of such tumors is typically elevated, 46,58 contrasting with the reduced ADC of herpes encephalitis.
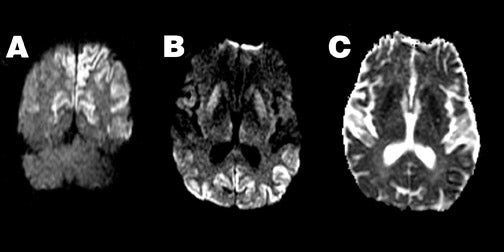
Creutzfeldt-Jakob disease-- Patients with Creutzfeldt-Jakob disease (CJD) can demonstrate hyperintense DWI in the basal ganglia and cortex, even before abnormalities are detected on conventional imaging 59,60 (Figure 7), with more extensive abnormalities seen in patients with the longest duration of symptoms. The reasons for the reduced ADC seen in these patients remain unknown. When the typical clinical features of periodic sharp-wave EEG activity and myoclonic jerks are absent, CJD may be difficult to distinguish clinically from other dementing illnesses. 61 In this setting, diffusion characteristics may support a diagnosis of CJD, even when conventional imaging is unrevealing.
Intracranial masses
Intra-axial- Glial tumors generally exhibit elevated ADC when compared with normal brain, with areas of central necrosis having even higher ADC values than the surrounding tumor. 46,58 The appearance on DWI is variable depending on the associated T2 contribution. Thus, diffusion imaging is typically not helpful in the differentiation of nonenhancing tumor from edema. There also appears to be no correlation between diffusion characteristics and tumor grade. 58 However, in addition to the preoperative differential diagnosis of abscess and necrotic tumor, diffusion imaging does aid in the evaluation of new neurological deficits appearing immediately following surgical resection of glial tumors. In this setting, diffusion properties may help discriminate postoperative edema (elevated ADC) from acute perioperative ischemic changes (reduced ADC), both of which typically exhibit prolonged T2 on conventional imaging.
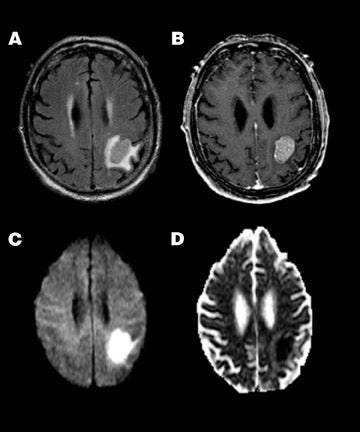
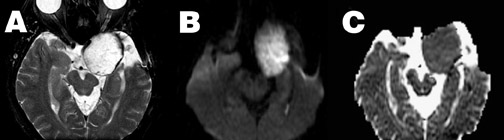
In contrast to glial tumors, highly cellular solid tumors, such as lymphoma or metastatic small-cell carcinoma, typically demonstrate restricted ADC and hyperintensity on DWI (Figure 8). In these tumors, ADC is inversely correlated with both tumor cellularity and nuclear-to-cytoplasmic ratio. Thus, diffusion properties may help narrow the differential diagnosis of intra-axial masses. 62,63
Extra-axial-- Diffusion-weighted imaging can also be helpful in discriminating arachnoid cysts and epidermoid tumors. Both are extra-axial masses with signal characteristics similar to CSF on conventional imaging, including fluid-attenuated inversion recovery imaging. However, they have very different diffusion characteristics. The arachnoid cyst, being fluid-filled, shows the expected characteristics of free water-ie, low signal on DWI and elevated ADC, and thus appears similar to free CSF on DWI. The epidermoid mass, on the other hand, is a solid cellular tumor with ADC similar to gray matter, ie, relatively reduced compared with CSF (Figure 9). Thus, because of both relatively reduced ADC and long T2, the epidermoid tumor appears hyperintense on DWI. This property is also helpful in the identification of residual tumor following resection, as CSF within the cavity and residual epidermoid tumor will still demonstrate differing signal intensity on DWI.
Demyelinating lesions
On diffusion imaging, acute demyelinating plaques of multiple sclerosis and acute disseminated encephalomyelitis typically show findings of vasogenic edema, with high ADC values. 64 However, atypical acute lesions with reduced diffusion may also be observed, perhaps related to inflammatory cellular infiltration. In chronic lesions, ADC typically remains increased, but less so than in acute lesions.
Hemorrhage
Hemorrhage complicates interpretation of diffusion imaging because of associated susceptibility effects. When T2 is significantly lowered (as in hematomas containing deoxyhemoglobin, intracellular methemoglobin, or hemosiderin), diffusion weighting cannot be successfully achieved and DWI becomes unreliable. Measured ADC values in blood products with high T2-weighted signal characteristic of extracellular methemoglobin are elevated, although reliability is uncertain. Despite these elevated ADC values, DWI typically remains hyperintense in this setting, presumably due to T2 shine-through.
Future directions
Parallel imaging
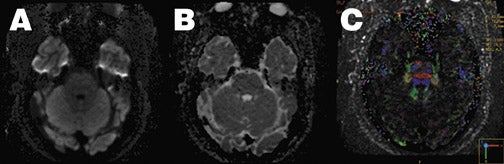
As discussed earlier, a major limitation of echoplanar DWI is its sensitivity to field inhomogeneities and local susceptibility effects, an effect that is magnified at 3T MRI. As this is related to the long read-out window required in conventional EPI, diffusion imaging has benefited from the introduction of new parallel imaging techniques such as sensitivity encoding (SENSE). 65,66 By using specialized radiofrequency coil arrays, individual component coil images and coil sensitivity estimates can be used to eliminate phase-encoding steps, resulting in a shorter readout window and decreased EPI artifacts, while still avoiding the additional artifacts associated with multishot techniques (Figure 10). Additional advantages of the shorter readout duration are decreased blurring from T2*-decay effects, leading to higher spatial resolution, and the option to decrease TE while maintaining similar b values, which decreases the T2-weighted component of diffusion images.
Diffusion tensor imaging
Another exciting new development in diffusion imaging is diffusion tensor imaging (DTI), which can exploit the anisotropic water motion seen in many tissues to infer the direction of tissue orientation and quantify the diffusion anisotropy of tissues, allowing additional tissue-specific contrast mechanisms to be studied. By adding as few as 3 additional noncollinear diffusion-sensitizing gradient acquisitions, the entire diffusion tensor matrix can be estimated and mathematically manipulated to yield measures of local anisotropy and direction of maximal molecular diffusivity. The latter can be analyzed to create maps of fiber tracks within the brain. When combined with parallel imaging, even fiber tracts at the skull base can be identified (Figure 10).
Conclusion
Diffusion imaging has rapidly evolved to become an indispensable sequence in many MRI examinations of the brain. Because of its high sensitivity in the detection of acute stroke and the opportunity for earlier detection of ischemia compared with conventional imaging, it is at the core of the acute brain ischemia workup at many institutions. Awareness of the many stroke mimics, including those resulting in "falsepositive" DWI due to T2 shine-through effects, is necessary to guide the most appropriate patient management. Use of diffusion imaging as a problem-solving tool in nonstroke settings has also evolved. With new technologies, such as parallel imaging and diffusion tensor imaging, leading to even more potential applications, the future of diffusion imaging is bright and its potential unrestricted.
Related Articles
Citation
Diffusion MRI: Overview and clinical applications in neuroradiology. Appl Radiol.
November 3, 2005