Cardiac and neurological PET-CT applications
Images
Dr. Costouros is a Clinical Fellow and Dr Hawkins is a Professor, Division of Nuclear Medicine, Department of Radiology and Biomedical Imaging, University of California, San Francisco, CA.
The combination of positron emission tomography (PET) and computed tomography (CT) provides an extremely valuable tool for interpreting molecular and physiologic information in the context of its corresponding anatomy. While the majority of PET-CT scanners are geared toward oncologic applications, the utilization of combined PET-CT scanners for neurological and cardiovascular imaging is still evolving. Given that the majority of PET imaging units now sold are incorporated into combined PET-CT scanners,1 the question arises as to when CT information could add useful additional clinical information, particularly considering the risks of additional CT radiation. Herein, we will review the current state of common PET applications in neurological and cardiovascular imaging with discussion of potential benefits of incorporating diagnostic CT in the imaging evaluation.
Cardiovascular imaging
Several PET radiopharmaceuticals are available for nuclear cardiac imaging (Table 1) in the evaluation of coronary artery disease and myocardial viability. Some of these agents are still under investigation, while others require an onsite or nearby cyclotron for production- limiting their availability to most PET facilities. Our discussion will focus on rubidium-82 (Rb-82) and 18F fluorodeoxyglucose (FDG) as they are the most commonly used agents for cardiac PET imaging and they have widespread commercial availability.
Myocardial perfusion imaging
Myocardial perfusion imaging (MPI) is primarily performed on widely available single photon emission computed tomography (SPECT) systems. The increasing prevalence of PET scanners will soon challenge this bias based on increasing access to PET imaging. Moreover, PET addresses potential pitfalls in image interpretation from attenuation artifacts inherent in SPECT myocardial perfusion imaging such as from breast attenuation in women as well as in large patients, given the increasing trend of obesity in the United States.
PET-CT offers the ability to use CT for attenuation correction of PET images. This method requires less time than performing attenuation correction using a transmission source used in stand alone PET scanners. However, the appropriate implementation of CT for attenuation correction of PET images requires close attention to the fusion and raw images to ensure appropriate registration and to avoid potential artifacts leading to false diagnoses.2 Furthermore, the ability to perform CT in conjunction with PET allows one to acquire CT images for coronary calcium scoring (risk stratification) and CT angiography (anatomic evaluation). The combined acquisition of both PET MPI and coronary CT angiography provides a complete view of both physiology (PET) and anatomy (CT), and may be appropriate for select individuals. However, this population has yet to be defined and the risks of additional radiation exposure from coronary CT angiography should be considered before performing a concurrent cardiac PET and CT angiogram.
Rb-82 is produced from a U.S. Food and Drug Administration approved strontium-82 generator, making PET MPI available to facilities without access to an onsite or nearby cyclotron. Like thallium, Rb-82 is a potassium analogue that is extracted proportional to myocardial blood flow in living cells, and thus has a better extraction fraction at higher coronary flow rates when compared with traditional technetium (99mTc) labeled SPECT agents (e.g. sestamibi, CardioLite, Lantheus Medical Imaging, North Billerica, MA; and, tetrofosmin, Myoview, GE Healthcare, Chalfont St. Giles, UK). Given these favorable extraction characteristics, Rb-82 is theoretically less likely to result in false-negative studies for ischemia at high relative coronary flow rates.
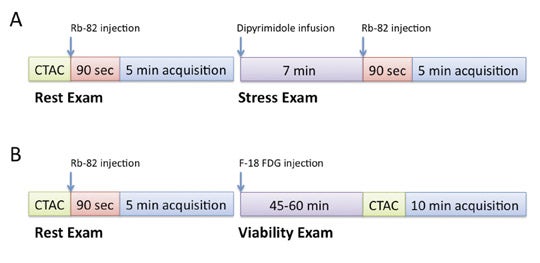
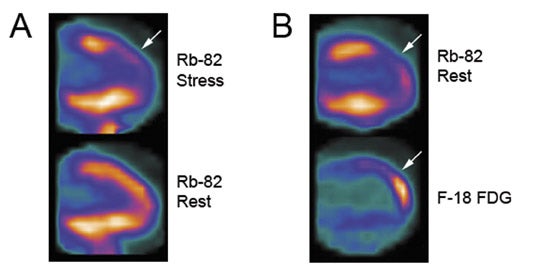
Additional advantages of using PET vs. SPECT include better attenuation correction, counting efficiency and higher spatial resolution, thus resulting in overall improved perfusion imaging quality and less equivocal exam interpretations. This is particularly pertinent for patients who are more likely to have false-positive exams with SPECT from breast attenuation or attenuation from an overall large body habitus, as well as with improved accuracy for the identification of patients with multivessel disease.3 Given the short half-life of 75 seconds for Rb-82, MPI is performed under pharmacologic stress such as with dipyridamole or adenosine. Furthermore, technical orchestration and acquisition times need to accommodate this rapid decay rate, as most counts will be acquired in the first 4 to 5 minutes following injection. A sample PET-CT protocol and Rb-82 MPI exam are shown in Figures 1 and 2.
Rb-82 PET MPI has demonstrated excellent results in prognosis and risk stratification as well as diagnosing severe coronary artery stenosis. Yoshinaga et al. showed increased cumulative rates of death and myocardial infarction in pro-portion to summed stress score (SSS) severity in 367 patients undergoing dipyridamole Rb-82 PET MPI.4 Lertsburapa et al. showed that summed stress score severity and degree of left ventricular dysfunction with Rb-82 PET MPI were significantly additive in predicting annual mortality rates.5 In diagnosing severe coronary artery stenosis (≥70% stenosis), PET-CT with Rb-82 was shown to have a sensitivity and specificity of 93% and 83%, respectively, with a normalcy rate of 100%,6 with diagnostic characteristics similar to traditional PET.7,8 Furthermore, comparison databases for PET-CT are being developed and validated to assist in interpretation.9 Thus, Rb-82 PET-CT MPI has excellent diagnostic characteristics to exclude patients with severe coronary artery stenosis.
Myocardial viability
Coronary blood flow, myocardial oxygen consumption and contractile function are tightly coupled. Acute coronary occlusion results in contractile dysfunction as a cardioprotective response. In the setting of chronic coronary artery disease, there is an adaptive downregulation of contractile function with reduced resting perfusion, as a significant proportion of oxygen utilization by myocytes is related to contractile performance. This state of poor contractile function and poor perfusion in the setting of living myocytes has been termed hibernating myocardium, and is difficult to distinguish from myocardial infarct on MPI as they have the same appearance of poor perfusion at both rest and stress imaging. Assessment of myocardial viability with FDG exploits the utilization of glucose by myocardium in a chronic hypoxic state. Under normal well-perfused conditions, the myocardium preferentially uses fatty acids as an energy substrate. In the setting of hibernating myocardium, FDG is taken up by viable myocardium helping distinguish it from myocardial infarction, hence possibly being amenable to revascularization.
Performing PET viability imaging with FDG requires inducing a relative hyperinsulinemic state within the patient to promote maximal glucose utilization and thus FDG uptake within the myocardium. Multiple methods have been advocated to achieve this physiologic state and are detailed in the American Society of Nuclear Cardiology and the Society of Nuclear Medicine guidelines for PET imaging.10 In our experience, a protocol utilizing oral glucose loading with adjustment of plasma glucose to less than 140 mg/dL with intravenous regular insulin has proven to be logistically more feasible than more technically challenging protocols such as the hyperinsulinemic-euglycemic clamp method. Resting Rb-82 images are acquired prior to FDG adminstration as a comparison map of perfusion abnormalities. FDG imaging can also be combined with an Rb-82 rest and stress imaging protocol as clinically appropriate. A sample PET-CT protocol and Rb-82/FDG viability exam are shown in Figures 1 and 2.
PET viability assessment with FDG has shown benefit in patient management for predicting an increase in left ventricular function, improving symptoms of angina and heart failure, and risk stratification including survival following revascularization.11-17 The additive value of concurrent coronary CTA in conjunction with FDG PET viability imaging needs further investigation. Additional information gained from coronary CTA includes identifying patients with extensive disease who are less amenable to percutaneous interventions as well as assisting in preoperative coronary artery bypass graft planning by defining anatomy and extent of coronary artery disease.
Neurological imaging
PET has been used for neurological imaging for many decades. It has grown in clinical importance, beyond its use in research, particularly due to Centers for Medicare & Medicaid Services (CMS) decision memorandum for reimbursement of select patients with suspected dementia in 2004.18 While many promising radiopharmaceuticals are being developed for application to neurological imaging, FDG constitutes the primary agent currently used in clinical neurological imaging. Unlike the myocardium, the grey matter of the brain preferentially uses glucose as a metabolic substrate resulting in high levels of baseline brain activity when using FDG. Thus, both increased and decreased metabolism is used to evaluate intracranial abnormalities. Our discussion will focus on the use of FDG in evaluating suspected dementia, brain tumors and epilepsy. However, many novel agents are under investigation and are likely to enter clinical practice. Also, with the future realization of clinical PET and magnetic resonance imaging (MRI) in a hybrid scanner, concurrent PET and MRI acquisition will likely become the imaging combination of choice for the evaluation of central nervous system pathology with PET.
Dementia
The prevalence of mild cognitive impairment (MCI) has been shown to range between 3% and 19% in adults older than 65 years of age.19 Clinically classifying a patient with MCI and suspected dementia can sometimes be difficult given the clinical overlap of many dementias. In this subset of patients, correctly identifying the underlying cause of dementia has therapeutic implications. FDG PET has demonstrated the ability to detect and differentiate between different types of dementias prior to significant cognitive decline, particularly in distinguishing Alzheimer's disease (AD) and frontotemporal dementia (FTD).20 Recently, a multicenter study demonstrated 92% to 95% accuracy in classifying AD, FTD, and dementia with Lewy bodies (DLB) from normal patients using a standardized automated analysis of FDG PET,21 and many commercial packages are now available comparing a patient’s FDG PET with a reference population database allowing additional quantitative assessments of regional changes of metabolism.
In 2004, CMS approved the use of FDG PET for the evaluation of select patients with suspected dementia given the proven efficacy of cholinesterase inhibitors (tacrine, donepezil, rivastigmine, galantamine) to delay progression of AD.22,23 However, specific patient criteria are required for payment, and are outlined in the CMS memorandum.18 Briefly, patients must have:
- Documented cognitive decline for at least 6 months,
- Recently established diagnosis of dementia,
- Meet criteria for both AD and FTD,
- Have been evaluated for alternate causes of dementia, and
- Have an unclear diagnosis.
Thus, FDG PET is used following an extensive inconclusive clinical evaluation. Additionally, given the increasing utilization of PET-CT for oncologic applications, incidental identification of patterns of dementia may help referring clinicians in the appropriate clinical context, particularly if the patient already exhibits MCI.
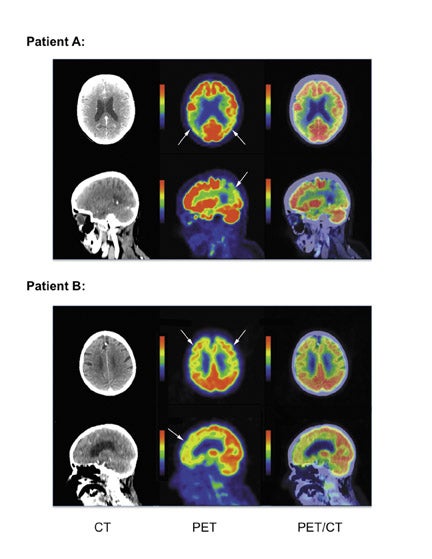
Patients with AD demonstrate a pattern of hypometabolism most prominent in the parietotemporal cortex and posterior cingulate cortex, and the pattern is more often symmetric though it can be asymmetric. As AD becomes more clinically severe, regional hypo-metabolism can extend anteriorly to involve the frontal lobes and occasionally into the occipital lobes. In contrast, FTD patients demonstrate a pattern of hypometabolism most prominent in the frontotemporal cortex, although it can less often involve the parietotemporal cortex and posterior cingulate cortex. Occasionally, a patient presenting for FDG PET will not fit into the AD or FTD pattern, thus awareness of other common dementia patterns may help identify alternate etiologies of MCI. Dementia with Lewy bodies often presents with regional areas of hypometabolism most prominent in the parieto-occipital cortex, however these patients are often clinically distinguishable by clinical presentation, including visual hallucinations and Parkinsonian motor features. Multi-infarct dementia classically demonstrates peripheral wedge-shaped hypo-metabolic regions as would be expected in the setting of chronic embolic disease. Given the potential overlap of hypometabolic regions in different dementias, quantitative analysis using a population database may help in discriminating qualitatively equivocal metabolic patterns. Examples of suspected (non-pathologically proven) cases of AD and FTD are shown in Figure 3. These examples were found incidentally on PET-CT for oncology indications. The development of PET amyloid specific imaging agents are currently under development for the evaluation of dementia, though their clinical use and application need further investigation.24,25
Brain tumors
While MRI is the current gold standard for evaluating CNS neoplasms, FDG PET has been shown to be useful in evaluating the posttreatment brain for recurrence in the setting of an equivocal contrast-enhanced MRI. As previously discussed, given the normal physiologic uptake of FDG in the brain, lesions which are isometabolic to adjacent brain parenchyma may confound image interpretation. However, the demonstration of decreased or increased metabolism relative to adjacent brain parenchyma can yield clinically relevant information. FDG is actively transported across the blood-brain barrier into the brain, with uptake usually higher in higher grade tumors. Furthermore, increased FDG uptake correlates with transformation of a low-grade tumor into a high-grade tumor.26 While this information can be clinically useful, the use of FDG PET has not supplanted the use of contrast-enhanced MRI and biopsy for tumor grading.
FDG PET can be used to troubleshoot equivocal MRI findings, particularly in the setting of nonspecific enhancement after stereotactic radiosurgery. Both radiation necrosis and recurrent tumor can have a similar appearance on contrast-enhanced MRI. FDG PET has been shown to have good sensitivity, from 81% to 86%, for the detection of recurrent tumor in this setting. However, specificity has been shown to vary from 40% to 94%, likely due to the baseline high physiologic uptake of FDG in brain parenchyma combined with differences in technique.27,28 In equivocal cases, the additional information provided by FDG PET may guide follow-up or identify regions to target for biopsy in the setting of high suspicion for tumor recurrence.29,30 The use of PET-CT for anatomic correlation of regions of hypermetabolism has not been evaluated, and areas of contrast enhancement on CT correlated with PET may improve specificity. However, fusion of PET images with MRI may achieve the same goals without acquiring additional imaging and thus could alleviate the risks associated with intravenous contrast for contrast-enhanced CT. Multiple investigational PET agents show promise for imaging brain tumors, including F-18 fluorothymidine as well as various amino acid PET tracers. These agents are likely to enter clinical practice, particularly in the instance of evaluating early response to treatment prior to changes seen with conventional anatomic imaging.31-34
Epilepsy
Patients refractory to medical treatment for seizures are often considered for surgical resection of the epileptogenic focus. Surgical candidates undergo a multitude of tests including electroencephalography (EEG), MRI, and sometimes SPECT or PET. SPECT or PET imaging can add value in settings such as,
- Discordant MRI and EEG,
- Normal MRI where precise anatomic localization of an epileptogenic focus is difficult, and
- When multiple anatomic lesions are seen on MRI and the identification of an offending epileptogenic focus could help limit the extent of surgery.
During a seizure, there is a coupled increase in regional cerebral blood flow (CBF) and glucose metabolism.35-38 Thus, in the ictal state both SPECT imaging measuring CBF and FDG PET imaging measuring glucose metabolism are similarly useful, demonstrating increased activity relative to adjacent brain parenchyma. However, due to the shorter half-life of FDG compared with 99mTc-labeled SPECT agents, SPECT is considered logistically easier to perform for ictal imaging. Also, with FDG, activation of secondary and tertiary seizure foci may result in decreased FDG accumulation, whereas SPECT regional CBF agents create a “snapshot” of blood flow focused only on the primary epileptogenic focus.
In the interictal state, both regional CBF and glucose metabolism are decreased through a mechanism that is not fully understood, resulting in a relative decrease in activity relative to adjacent brain parenchyma. Futhermore, regional CBF and glucose metabolism are uncoupled with a greater reduction in glucose metabolism compared with CBF during interictal imaging, making FDG PET more favorable for interictal imaging.39-41 Furthermore, the intrinsic better spatial resolution of PET allows improved anatomic localization and detail when compared with SPECT.
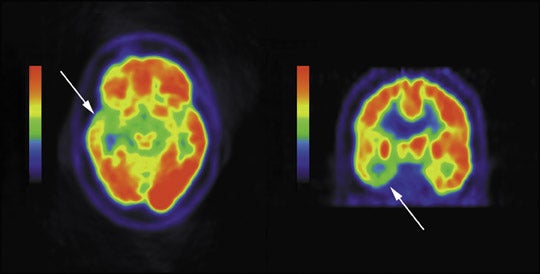
In comparison with MRI, FDG PET has been shown to be more sensitive in identifying seizures originating in the temporal lobes, adding laterality and localization in approximately 60% to 90% of patients with temporal lobe epilepsy.42-44 However, in patients with mesial temporal sclerosis demonstrated on MRI, FDG PET has reduced sensitivity with normal PET exams in 10% of these patients.45,46 Patients with extratemporal lobe epilepsy more often have normal brain MRI’s and thus often have SPECT or PET imaging to help localize the inciting epileptogenic focus-up to 73% sensitivity has been documented.47 However, FDG PET is also limited, with low sensitivities as low as 44% in one study in MRI negative patients.48 Despite potential low sensitivities, when an abnormality is present on PET, this may add valuable additional information in patient management. An example of reduced metabolism in the setting of temporal lobe epilepsy is shown in Figure 4.
The addition of CT to brain FDG PET for the evaluation of epileptogenic foci is unlikely to provide additional information anatomically, as most patients already have had a brain MRI. The attenuation correction CT obtained during a brain PET-CT may improve automated anatomic coregistration of the PET to MRI, using the CT portion of the PET-CT exam as the reference series for image fusion. However, as with brain tumor imaging, the implementation of simultaneous PET-MR imaging will likely become the modality of choice for fusion brain imaging of epilepsy.
Conclusion
PET-CT has many useful applications in cardiovascular and neurological imaging. However, the benefit of concurrent diagnostic CT imaging is unclear in most instances and needs further investigation. CT for attenuation correction of PET images is still an important part of PET imaging when performed utilizing a dedicated PET-CT scanner. Attention should be paid to potential artifacts introduced with CT attenuation correction. When incorporating a diagnostic quality CT, the risks of additional radiation exposure should be weighed with the benefits of this additional anatomic information given the indication of the PET examination.
REFERENCES
- Townsend DW. Dual-Modality imaging: Combining anatomy and function. J Nucl Med. 2008;49(6):938-955.
- Lautamäki R, Brown TL, Merrill J, Bengel FM. CT-based attenuation correction in (82)Rb-myocardial perfusion PET-CT: Incidence of misalignment and effect on regional tracer distribution. Eur J Nucl Med Mol Imaging. 2008;35(2):305-310.
- Bateman TM, Heller GV, McGhie, et al. Diagnostic accuracy of rest/stress ECG-gated Rb-82 myocardial perfusion PET: Comparison with ECG-gated Tc-99m sestamibi SPECT.J Nucl Cardiol. 2006;13(1):24-33.
- Yoshinaga K, Chow BJ, Williams K, et al. What is the prognostic value of myocardial perfusion imaging using rubidium-82 positron emission tomography? J Am Coll Cardiol. 2006;48(5):1029-1039.
- Lertsburapa K, Ahlberg AW, Bateman TM, et al. Independent and incremental prognostic value of left ventricular ejection fraction determined by stress gated rubidium 82 PET imaging in patients with known or suspected coronary artery disease. J Nucl Cardiol. 2008;15(6):745-753.
- Sampson UK, Dorbala S, Limaye A, et al. Diagnostic accuracy of rubidium-82 myocardial perfusion imaging with hybrid positron emission tomography/computed tomography in thedetection of coronary artery disease. J Am Coll Cardiol. 2007;49(10): 1052-1058.
- Groves AM, Speechly-Dick ME, Dickson JC, et al. Cardiac 82Rubidium PET-CT: Initial European experience. Eur J Nucl Med Mol Imaging. 2007:34(12): 1965-1972.
- Esteves FP, Sanyal R, Nye JA, et al. Adenosine stress rubidium-82 PET/computed tomography in patients with known and suspected coronary artery disease. Nucl Med Commun. 2008;29(8):674-678.
- Santana CA, Folks RD, Garcia EV, et al. Quantitative (82)Rb PET-CT: Development and validation of myocardial perfusion database. J Nucl Med. 2007; 48(7):1122-1128.
- Bacharach SL, Bax JJ, Case, J, et al. PET myocardial glucose metabolism and perfusion imaging: Part 1-Guidelines for data acquisition and patient preparation. J Nucl Cardiol. 2003;10(5):543-556.
- vom Dahl J, Altehoefer C, Sheehaet FH, et al. Recovery of regional left ventricular dysfunction after coronary revascularization. Impact of myocardial viability assessed by nuclearimaging and vessel patency at follow-up angiography. J Am Coll Cardiol. 1996;28(4):948-958.
- Di Carli MF, Asgarzadie F, Schelbert HR, et al. Quantitative relation between myocardial viability and improvement in heart failure symptoms after revascularization in patients withischemic cardiomyopathy. Circulation. 1995;92(12):3436-3444.
- Di Carli MF, Maddahi J, Rokhsar S, et al. Long-term survival of patients with coronary artery disease and left ventricular dysfunction: Implications for the role of myocardial viabilityassessment in management decisions. J Thorac Cardiovasc Surg. 1998; 116(6):997-1004.
- Rohatgi R, Epstein S, Henriquez J, et al. Utility of positron emission tomography in predicting cardiac events and survival in patients with coronary artery disease and severe left ventricular dysfunction. Am J Cardiol. 2001;87(9):1096-1099, A6.
- Beanlands RS, Hendry PJ, Masters RG, et al. Delay in revascularization is associated with increased mortality rate in patients with severe left ventricular dysfunction and viable myocardium on fluorine 18-fluorodeoxyglucose positron emission tomography imaging. Circulation. 1998;98(19 Suppl): II51-II56.
- Di Carli MF. Predicting improved function after myocardial revascularization. Curr Opin Cardiol. 1998;13(6):415-424.
- Allman KC, Shaw LJ, Hachamovitch R, Udelson JE. Myocardial viability testing and impact of revascularization on prognosis in patients with coronary artery disease and left ventricular dysfunction: A meta-analysis. J Am Coll Cardiol. 2002;39(7):1151-1158.
- CMS Manual System Department of Health & Human Services, Pub. 100-04 Medicare Claims Processing Centers for Medicare & Medicaid Services. CMS Transmittal R310CP,Billing Requirements for Positron Emission Tomography (PET) Scans for Dementia and Neurodegenerative Diseases, October 2004. Available at http://www.cms.hhs.gov/transmittals/2004trans. Accessed May 13, 2009.
- Gauthier S, Reisberg B, Zaudig M, et al. Mild cognitive impairment. Lancet. 2006;367(9518):1262-1270.
- Foster NL, Heidebrink JL, Clark CM, et al. FDG-PET improves accuracy in distinguishing frontotemporal dementia and Alzheimer’s disease. Brain. 2007;130(Pt 10):2616-2635.
- Mosconi L, Tsui WH, Herholz K, et al. Multicenter standardized 18F-FDG PET diagnosis of mild cognitive impairment, Alzheimer’s disease, and other dementias. J Nucl Med. 2008;49(3):390-398.
- Trinh NH, Hoblyn J, Mohanty S, Yaffe K. Efficacy of cholinesterase inhibitors in the treatment of neuropsychiatric symptoms and functional impairment in Alzheimer disease: A meta-analysis. JAMA. 2003; 289(2):210-216.
- Raina P, Santaguida P, Ismaila A, et al. Effectiveness of cholinesterase inhibitors and memantine for treating dementia: Evidence review for a clinical practice guideline. Ann Intern Med. 2008;148(5):379-397.
- Butters MA, Klunk WE, Mathis CA, et al. Imaging Alzheimer pathology in late-life depression with PET and Pittsburgh Compound-B. Alzheimer Dis Assoc Disord. 2008;22(3):261-268.
- Herholz K, Carter SF, Jones M. Positron emission tomography imaging in dementia. Br J Radiol. 2007; 80(Spec No 2):S160-167.
- De Witte O, Levivier M, Violon P, et al. Prognostic value of positron emission tomography with [18F]fluoro-2-deoxy-D-glucose in the low-grade glioma. Neurosurgery. 1996;39(3):470-476; discussion 476-477.
- Langleben DD, Segall GM. PET in differentiation of recurrent brain tumor from radiation injury. J Nucl Med. 2000;41(11):1861-1867.
- Henze M, Mohammed A, Schlemmer HP, et al. PET and SPECT for detection of tumor progression in irradiated low-grade astrocytoma: A receiver-operating-characteristic analysis. J Nucl Med. 2004; 45(4):579-586.
- Messing-Jünger AM, Floeth FW, Pauleit D, et al. Multimodal target point assessment for stereotactic biopsy in children with diffuse bithalamic astrocytomas. Childs Nerv Syst. 2002;18(8):445-449.
- Wong TZ, van der Westhuizen GJ, Coleman RE. Positron emission tomography imaging of brain tumors. Neuroimaging Clin N Am. 2002;12(4):615-626.
- Hatakeyama T, Kawai N, Nishiyama Y, et al. (11)C-methionine (MET) and (18)F-fluorothymidine (FLT) PET in patients with newly diagnosed glioma. Eur J Nucl Med Mol Imaging. 2008;35(11):2009-2017.
- Ullrich R, Backes H, Li H, et al. Glioma proliferation as assessed by 3’-fluoro-3’-deoxy-L-thymidine positron emission tomography in patients with newly diagnosed high-grade glioma.Clin Cancer Res. 2008;14(7):2049-2055.
- Schiepers C, Chen W, Dahlbom M, et al. 18F-fluorothymidine kinetics of malignant brain tumors. Eur J Nucl Med Mol Imaging. 2007;34(7):1003-1011.
- Saga T, Kawashima H, Araki N, et al. Evaluation of primary brain tumors with FLT-PET: Usefulness and limitations. Clin Nucl Med. 2006;31(12):774-780.
- Hougaard K, Oikawa T, Sveinsdottir E, et al. Regional cerebral blood flow in focal cortical epilepsy.Arch Neurol. 1976;33(8)527-535.
- Engel J, Kuhl DE, Phelps ME, et al. Local cerebral metabolism during partial seizures. Neurology. 1983; 33(4):400-413.
- Kuhl DE, Engel J, Phelps ME, Selin C. Epileptic patterns of local cerebral metabolism and perfusion in humans determined by emission computed tomography of 18FDG and 13NH3.Ann Neurol. 1980;8(4): 348-360.
- Ingvar M. Cerebral blood flow and metabolic rate during seizures. Relationship to epileptic brain damage. Ann N Y Acad Sci. 1986;462:194-206.
- Bruehl C, Hagemann G, Witte OW. Uncoupling of blood flow and metabolism in focal epilepsy. Epilepsia. 1998;39(12):1235-1242.
- Gaillard WD, Fazilat S, White S, et al. Interictal metabolism and blood flow are uncoupled in temporal lobe cortex of patients with complex partial epilepsy.Neurology. 1995;45(10):1841-1847.
- Lee SK, Lee SY, Kim KK, et al. Surgical outcome and prognostic factors of cryptogenic neocortical epilepsy.Ann Neurol. 2005;58(4):525-532.
- Drzezga A, Arnold S, Minoshima S, et al. 18F-FDG PET studies in patients with extratemporal and temporal epilepsy: Evaluation of an observer-independent analysis. J Nucl Med. 1999;40(5):737-746.
- Breier JI, Mullani NA, Thomas AB, et al. Effects of duration of epilepsy on the uncoupling of metabolism and blood flow in complex partial seizures. Neurology. 1997;48(4):1047-1053.
- Casse R, Rowe CC, Newton M, et al. Positron emission tomography and epilepsy.Mol Imaging Biol. 2002;4(5):338-351.
- O’Brien TJ, Newton MR, Cook MJ, et al. Hippocampal atrophy is not a major determinant of regional hypometabolism in temporal lobe epilepsy.Epilepsia. 1997;38(1):74-80.
- Foldvary N, Lee N, Hanson MW, et al. Correlation of hippocampal neuronal density and FDG-PET in mesial temporal lobe epilepsy. Epilepsia. 1999;40(1): 26-29.
- Kim YK, Lee DS, Lee SK, et al. (18)F-FDG PET in localization of frontal lobe epilepsy: Comparison of visual and SPM analysis. J Nucl Med. 2002;43(9): 1167-1174.
- Lee DS, Lee JS, Kang KW, et al. Disparity of perfusion and glucose metabolism of epileptogenic zones in temporal lobe epilepsy demonstrated by SPM/SPAM analysis on 15O water PET, [18F]FDG-PET, and [99mTc]-HMPAO SPECT. Epilepsia. 2001;42(12):1515-1522.