Body MR imaging: Sequences we use and why
Images
Dr. Kierans, Dr. Leonardou and Dr. Shaikh are Clinical Research Scholars, and Dr. Semelka is a Professor of Radiology, Department of Radiology, University of North Carolina Hospitals at Chapel Hill, Chapel Hill, NC.
Typically there are at least 8 different sets of images in a body magnetic resonance imaging (MRI) study, which can bewilder the radiologist who may be comfortable with looking at only 1 set of images required by computed tomography (CT). The standard MR sequences obtained are: noncontrast T1-weighted (T1W) in-phase, out-of-phase and fat-suppressed images, and T2-weighted (T2W) fat- and non-fat-suppressed images. Other standard sequences include contrast-enhanced T1W sequences imaged during the hepatic arterial dominant phase, early hepatic venous phase and the interstitial phase (Figure 1). This review describes the core data interpretation from these different imaging sets to raise the comfort level for image interpretation of abdominal MRI studies.
T1W sequences
There are a few variants on T1W images, which add to the complexity and need for expertise in image interpretation. The standard, fat-suppressed T1W images are also referred to as in-phase. Out-of-phase or opposed-phase T1W images (fat-suppressed) can be recognized by the dark outline around organs, most easily appreciated around the kidney. Fat-suppressed T1W images, as the name implies, are recognized by the dark fat. The information in these data sets is analogous to noncontrast CT including the darkness of focal lesions, fibrous tissue and simple fluid. What distinguishes all of these data sets from noncontrast CT is that there is a much greater intrinsic soft-tissue resolution. This is exemplified in the detection of malignant liver lesions, which are commonly seen on non-contrast T1W MR images, but poorly seen on noncontrast CT images.1 Additionally, hemorrhagic and proteinaceous fluid is often bright on T1W images and dark on CT (the exception being acute blood).
In-phase sequences
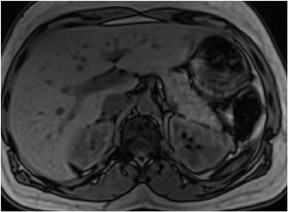
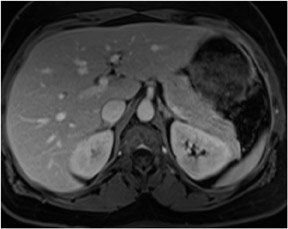
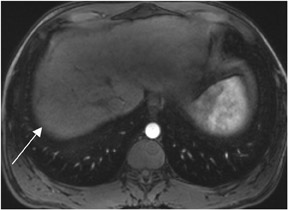
In-phase images are general workhorse sequences used for an overall anatomic survey. The primary information that in-phase images provide includes: information on abnormally increased fluid content or fibrous tissue content that appears low in signal intensity on T1W images, and information on the presence of subacute blood or concentrated protein, which are both high in signal intensity2(Figure 2). The presence of fat is also demonstrated as high-signal-intensity tissue.
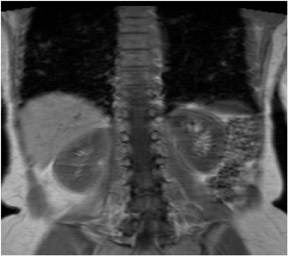
Coronal in-phase sequences are typically obtained for an overview of the entire abdomen. These sequences allow structures oriented in the coronal plane to be imaged along their longitudinal axes, providing an additional perspective and increasing the confidence of diagnosis.3 Coronal images are useful for viewing the aorta, para-aortic lymph nodes and mesenteric vessels, which will all be displayed because they are laid out along their long axis. The coronal view also can be used to inspect the inferior and superior surfaces of the liver and the lung bases for the presence of metastases and other disease processes (Figure 3).
Out-of-phase sequences
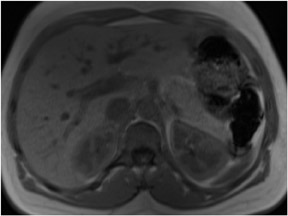
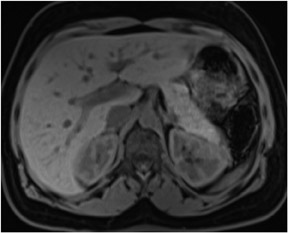
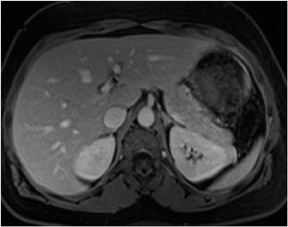
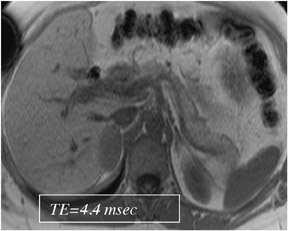
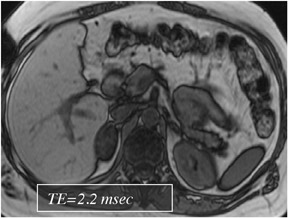
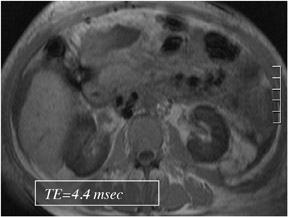
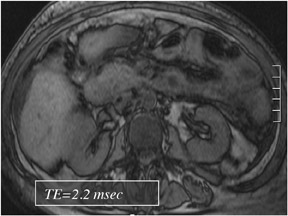
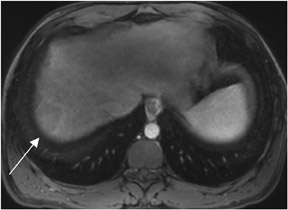
Out-of-phase sequences are useful for the characterization of diseased tissue when mixtures of fat and water protons are present within the same voxel. The cancellation of fat and water signals in the same image voxel causes a loss of signal intensity on out-of-phase images.4 The most common indications for out-of-phase imaging are the detection of abnormal fat accumulation within the liver and the detection of lipid within adrenal masses, a feature used to diagnose adrenal adenomas5,6 (Figure 4). Because of the differing echo times (TEs) of in-phase and out-of-phase sequences, their combined acquisition also provides information on magnetic susceptibility, and therefore pathologic conditions such as hemochromatosis or hemosiderosis can be identified and characterized with a high level of confidence. In cases of iron storage disease, the hepatic parenchymal signal intensity decreases on the image with the longer echo time due to the continued decay of transverse magnetization7 (Figure 5).
Fat-suppressed sequences
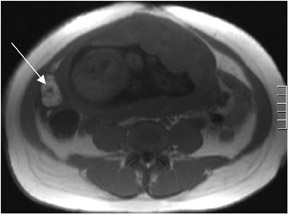
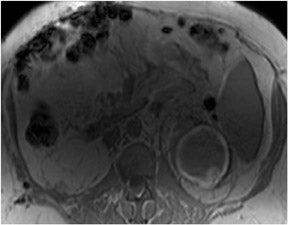
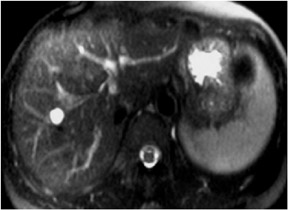
Fat-suppression sequences are used for the recognition of lesions composed predominantly of fat, such as angiomyolipomas and ovarian dermoid cysts, which as the name implies, are of low signal intensity on fat-suppressed images8 (Figure 6). Fat-saturation sequences are also useful in the evaluation of the normal and diseased pancreas with the normal pancreas appearing brighter than the other abdominal organs on fat-suppressed images. The relatively specific morphologic and signal-intensity features on fat-saturation images allow for the detection of pancreatic disease processes such aschronic pancreatitis and ductal adenocarcinoma.9,10 Fat-saturation sequences also allow the best demonstration of renal corticomedullary differentiation, which is diminished in a variety of pathological processes such as renal transplant rejection and chronic renal insufficiency.11
T2W sequences
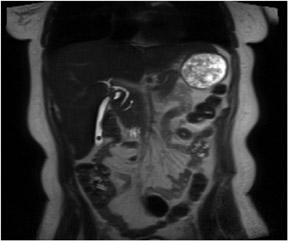
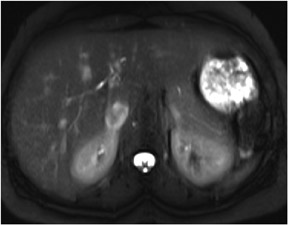
T2W sequences are used in conjunction with T1W sequences for the detection and characterization of a variety of disease processes. These sequences may be recognized by the high–signal-intensity fluid in the spinal canal. The predominant information provided by T2W sequences is the presence of increased fluid in diseased tissue that results in high signal intensity. Therefore, fluid containing lesions such as cysts, hemangiomas and biliary hamartomas are recognized on T2W images by their high signal (Figure 7). However, cysts containing hemorrhage or high protein levels, common with renal cysts, will often appear dark on T2W images.12 Moderately low signal intensity on T2W images indicates low fluid content and can be used in the identification of structures such as uterine leiomyomas.13 The presenceof chronic fibrotic tissue is also identified on T2W images by its moderately low signal intensity. T2Wsequences also provide information on magnetic susceptibility and are used in conjunction with out-of-phase sequences for the detection of iron, which appears extremely dark (marked low signal intensity).
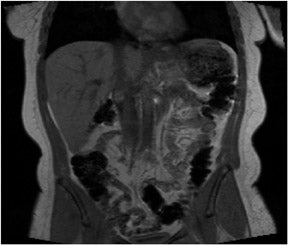
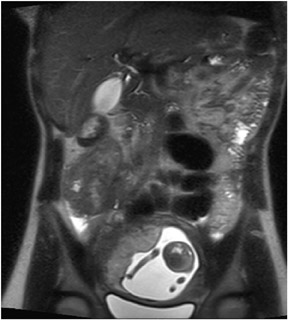
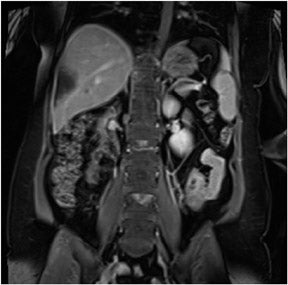
A coronal T2W sequence is routinely obtained for an overall survey of the abdomen. It is useful for evaluating the bowel and biliary system (Figure 8), and similar to T1W images, can be used to evaluate the superior and inferior surfaces of the liver and the lung bases.
Contrast-enhanced T1W sequences
Gadolinium-enhanced MR imaging is crucial in the detection and characterization of abdominal and pelvic pathology and the depiction of vascular structures. Both sensitivity and specificity are improved for the detection of most disease processes with the use of gadoliniumchelates.14 The authors routinely obtain four passes following gadolinium administration to observe tissue perfusion (hepatic arterial dominant phase), blood pool, venous withdrawal (early hepatic venous phase) and interstitial space size (interstitial phase).
Hepatic arterial dominant phase
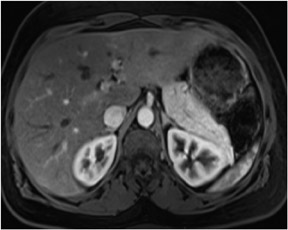
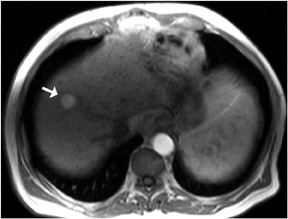
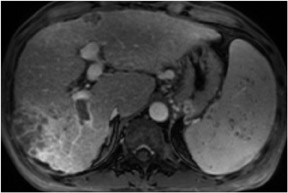
Generally, the most important set of images acquired by MRI are the images obtained immediately after contrast administration, the hepaticarterial dominant phase. Our method of acquiring these images is discussed below. These images are recognized by the presence of contrast inhepatic arteries and portal veins and absence of contrast in hepatic veins. This phase shows the initial presence of intense brightness in the renal cortex. The spleen is also bright (often heterogeneous with a wavy gradient of bright and dark lines). The pancreas exhibits the shortest durationof increased enhancement in the early phase following contrast administration, maximally enhanced and brighter than the liver on the HADP. For this reason we use enhancement of the pancreas as a surrogate evaluation for the determination of adequacy of early enhanced images. When the pancreas is brighter than the liver, then hypervascular liver lesions should also be enhanced well, if they are present. The aorta is bright through the entire volume of slices acquired including the lowest tomographic sections, which is an important observation to distinguish enhancement, from time-of-flight effects which tend to saturate (i.e. become dark) on lower transverse sections. HADP images are directly comparable to CT images, and if the data set is acquired with fat suppression they appear quite similar to CT. These images are especially useful forthe detection of hypervascular lesions such as hypervascular HCC (Figure 9) and hypervascular metastases.15 HADP phase images are also used to detect hepatic perfusional abnormalities, including those related to portal vein thrombosis.16 HADP images show the distinctive enhancement features of focal lesions is most abdominal organs, and are especially useful for focal liver and pancreatic lesions. It is important to emphasize that these images also reveal the blood supply of the organs themselves.
Early hepatic venous phase
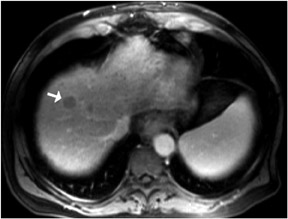
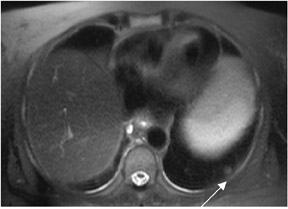
Delayed postgadolinium images allow one to appreciate the temporal handling of contrast agents by focal lesions, and the temporal handling by the organs themselves. Early hepatic venous phase images are obtained at 45 to 90 seconds postcontrast administration and can be recognized by the presence of contrast in hepatic and portal veins. This phase also shows maximal enhancement of the hepatic parenchyma. Early hepatic venous phase images are especially useful for the detection of hypo- and isovascular lesions, such as hypo/isovascular HCC (Figure 10) and hypovascular metastases.17 This phase is also important in lesion characterization, specifically hypervascular lesions such as focal nodular hyperplasia (FNH) which shows fading, and HCC which shows washout on early hepatic venous phase images.18,19 These images are also useful in detecting perfusion abnormalities including thrombosis of hepatic and portal veins20 (Figure 11). Simple perfusion abnormalities such as uncomplicated portal venous thrombosis, inflammatory reactions to adjacent infection (e.g. acute cholecystitis and hepatic abscesses) and acute-on-chronic hepatitis generally show fading to isointensity following the transient intense enhancement on HADP images.
Interstitial phase
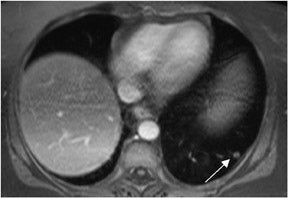
Interstitial phase images are obtained from 90 seconds to 5 minutes post gadolinium administration and are used in identifying diseaseprocesses that demonstrate characteristic enhancement patterns on delayed imaging. One of the best recognized patterns is enlargement and coalescence of nodules in hepatic hemangiomas. Other disease entities show progressive enhancement (typical for fibrosis) and include cholangiocarcinoma, which typically shows delayed enhancement.21 Peritoneal disease similarly enhances slowly after contrast enhancement, andtherefore, IP images are useful in the detection of primary peritoneal carcinoma and peritoneal metastases.22 Pulmonary nodules often show progressive retention of contrast, increasing their conspicuity on IP images, with fat-suppressed 3-dimensional gradient echo being the preferred technique23 (Figure 12).
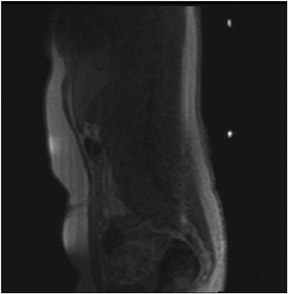
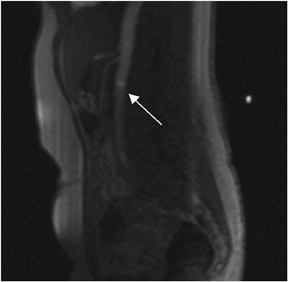
A coronal interstitial phase sequence is a useful addition to acquire after 3 sets of transverse sequences. These provide a general overview of the entire abdomen and musculoskeletal system (especially the lumbar spine, pelvis and femoral heads). For example, these images are useful for detecting bony metastases in the longitudinal plane of the thoracolumbar spine and pelvis24 (Figure 13). They provide valuable additional information on the patency of the portal vein and superior mesenteric vein which is critical in the evaluation of cirrhotic livers and pancreatic cancer, as examples. Contrast-enhanced coronal MRI is also useful for demonstrating bowel abnormalities, and may be used todefine either a vascular supply (e.g. within a polyp, to distinguish from colon contents) or abnormal enhancement within a thickened and inflamed region of bowel, as seen in inflammatory bowel disease.25 Similar to T1W and T2W coronal sequences, IP coronal sequences can also be used to evaluate the superior and inferior surfaces of the liver, and the lung bases.
Timing postcontrast T1W images
We have employed two methods to time injection of contrast administration. The only phase in which exact timing is critical is the HADP, with no exacting requirements for EHV or the IP phases. The first method is generally termed empiric timing. Using this approach, following initiation of contrast administration a delay of 18 seconds is used before initiating a 20 second standard phase-encoded sequence. With this approach, correct timing is achieved in at least 85% of patients. More recently we have begun to use an approach termed automated bolus liver enhancement (ABLE), developed by Dr. Diego Martin and colleagues at Emory University (personal communication, Diego Martin, MD, Emory University, Atlanta, GA). ABLE is a dynamic contrast enhancement technique in which the contrast is monitored by the technologist as it travels through the vascular system. After the contrast is seen in the descending aorta, the patient is instructed to suspend breathing for 10 seconds and the liver is imaged thereafter (Figure 14).
Conclusion
MRI, using a variety of short duration sequences in multiple planes and pre- and postgadolinium administration allows increased sensitivity and specificity in disease detection. The combined information provided by noncontrast T1W and T2W images, and early and late postgadoliniumT1W images, allows accurate assessment of a full range of abdominal and pelvic pathology. As MRI continues to evolve, emphasis should always be placed on employing sequences that exhibit the best combination of: speed of acquisition, consistent image quality and consistent display of disease process. A balance must always be reached between number of sequences performed, comprehensive evaluation and total study directions.
REFERENCES
- Semelka RC, Worawattanakul S, Kelekis NL, et al. Liver lesion detection, characterization, and effect on patient management: Comparison of single phase spiral CT and current MR techniques. JMRI. 1997;7:1040-1047.
- Semelka RC, Martin DR, Cem Balci N. Magnetic resonance imaging of the liver: How I do it. Journal of Gastroenterology and Hepatology. 2006;21:632-637.
- Webb WR, Jensen BG, Gamsu G, et al. Coronal magnetic resonance imaging of the chest: Normal and abnormal. Radiology. 1984;153:729-735
- Outwater EK, Blasbalg R, Siegelman ES, Vala M. Detection of lipid in abdominal tissues with opposed-phase gradient-echo images at 1.5 T:Techniques and diagnostic importance.Radiographics. 1998;18:1465-1480.
- Kreft BP, Tanimoto A, Baba Y, et al. Diagnosis of fatty liver with MR imaging. J Magn Reson Imaging. 1992;2:463–471.
- Lockhart ME, Smith JK, Kenney PJ. Imaging of adrenal masses. Eur J Radiol. 2002;41:95-112.
- Merkle EM, Nelson RC. Dual gradient-echo in-phase and opposed-phase hepatic MR imaging: A useful tool for evaluating more than fatty infiltration or fatty sparing. Radiographics. 2006;26:1409-1418.
- Delfaut EM, Beltran J, Johnson G, et al. Fat suppression in MR imaging: Techniques and pitfalls. Radiographics. 1999;19:373-382.
- Gallix BP, Bret PM, Atri M, et al. Comparison of qualitative and quantitative measurements on unenhanced T1-weighted fat saturation MR images in predicting pancreatic pathology. J Magn Reson Imaging. 2005;21:683-689
- Pamuklar E, Semelka RC. MR imaging of the pancreas. Magn Reson Imaging Clin N Am. 2005;13:313-330.
- Kettritz U, Semeka RC, Brown ED, et al. MR findings in diffuse renal parenchymal disease. J Magn Reson Imaging. 1996;6:136-144.
- Mortele KJ, Ros PR. Cystic focal liver lesions in the adult: Differential CT and MR imaging features. Radiographics. 2001;21:895-910.
- Murase E, Siegelman ES, Outwater EK, et al. Uterine leiomyomas: Histopathologic features, MR Imaging findings, differential diagnosis, and treatment. Radiographics. 1999;19:1179-1197.
- Quillin SP, Atilla S, Brown JJ, et al. Characterization of focal hepatic masses by dynamic contrast-enhanced MR imaging: Findings in 311 lesions.J Magn Reson Imaging. 1997;15:275-285.
- Soyer P, Gueye C, Somveille E, et al. MR diagnosis of hepatic metastases from neuroendocrine tumors versus hemangiomas: Relative merits of dynamic gadolinium chelate-enhanced gradient echo and unenhanced spin-echo images. AJR Am J Roentgenol. 1995;165:1407-1413.
- Schlund JF, Semelka RC, Kettritz U, et al. Transient increased segmental hepatic enhancement distal to portal vein obstruction on dynamic gadolinium-enhanced gradient echo MRimages. J Magn Reson Imaging. 1995;5:375-377.
- Hayashida M, Ito K, Fujita T, et al. Small hepatocellular carcinoma in cirrhosis: Differences in contrast enhancement effects between helical CT and MR imaging during multiphasedynamic imaging. J Magn Reson Imaging. 2008;26:65-71.
- Reimer P, Rummeny EJ, Daldrup, et al. Enhancement characteristics of liver metastases, hepatocellular carcinomas, and hemangiomas with Gd-EOB-DTPA: Preliminary results with dynamic MR imaging. Eur Radiol. 1997;7:275-280.
- Grazioli L, Morana G, Federle MP, et al. Focal nodular hyperplasia: Morphologic and functional information from MR imaging with gadobenate dimeglumine.Radiology. 2001;221:731-739.
- Brancatelli G, Vilgrain V, Federle MP, et al. Budd-Chiari Syndrome: Spectrum of imaging findings. AJR Am J Roentgenol. 2007;188:168-176.
- Worawattanakul S, Semelka RC, Noone TC, et al. Cholangiocarcinoma: Spectrum of appearances on MR images using current techniques.J Magn Reson Imaging. 1998;16:993-1003.
- Low RN. Gadolinium-enhanced MR imaging of liver capsule and peritoneum. Magn Reson Imaging Clin N Am. 2001;9:803-819.
- Donmez FY, Yekeler E, Saeidi V, et al. Dynamic contrast enhancement patterns of solitary pulmonary nodules on 3D gradient-recalled echo MRI. AJR Am J Roentgenol. 2007;189:1380-1386.
- Bradley WG. Use of contrast in MR imaging of the lumbar spine. Magn Reson Imaging Clinic N Am. 1999;7:439-457.
- Lomas DJ. Techniques for magnetic resonance imaging of the bowel. Top Magn Reson Imaging. 2002;13:379-387.
Related Articles
Citation
. Body MR imaging: Sequences we use and why. Appl Radiol.
May 19, 2009