Navigating contrast-enhanced digital mammography
By Lewis TC, Patel BK, Pizzitola VJ


Contrast-enhanced digital mammography (CEDM) takes sequential images at high and low energies that are used to construct a digitally subtracted image, highlighting areas of contrast medium enhancement. The low-energy image is of the same diagnostic quality as standard 2-dimensional mammography.1 However, the digitally subtracted image is unlike those that mammographers are accustomed to interpreting and its use initially may be overwhelming.
With this paper, the authors aim to increase understanding of normal anatomic and non-anatomic structures encountered on subtracted images and increase awareness of commonly encountered artifacts. In addition, the authors outline a standardized reporting system to help further streamline interpretation and reporting of CEDM images.
What is CEDM?
CEDM is a quick, well-tolerated, relatively low-cost breast imaging technique that combines standard full-field digital mammography (FFDM) with an intravenous, low-osmolar, iodinated contrast medium. After administration of contrast material in the antecubital vein, 2 sequential images are acquired at high and low energies. The low-energy image (26-32 kVp) yields soft tissue and calcification detail similar to standard FFDM;2 the high-energy image (45-49 kVp) is specifically selected to be greater than the K-edge of iodine (33.2 keV).3 These 2 images are then digitally subtracted from each other to produce a single contrast medium-enhanced image that highlights areas of neovascularity, similar to magnetic resonance imaging (MRI).
Numerous studies have demonstrated increased sensitivity and specificity of CEDM compared with either FFDM or FFDM combined with ultrasonography.4 In addition, CEDM rivals the sensitivity of more costly and time-consuming examinations, such as MRI and molecular breast imaging.5-9
Dromain et al,4 Jochelson et al,5 Fallenberg et al,3 and Luczynska et al10 compared the sensitivity and specificity of CEDM with FFDM. In all 4 cohorts, CEDM showed greater sensitivity (93%-100%) and specificity (41%-85%) in the detection of breast cancer than FFDM (sensitivity, 78%-91%; specificity, 15%-58%). In 2011, Dromain et al4 compared CEDM with FFDM and ultrasonography. They found that CEDM had a sensitivity of 93% vs a sensitivity of 90% for FFDM with ultrasonography, as well as improved specificity (63% for CEDM vs 47% for FFDM with ultrasonography). In a comparison of CEDM with MRI, 2 studies have shown that CEDM is similar to MRI. Jochelson et al5 found that CEDM and MRI have equal sensitivity (96%), and Fallenberg et al6 found CEDM to have 100% sensitivity compared with 97% sensitivity for MRI.
CEDM Appearance of anatomic, non-anatomic structures
Two fellowship-trained breast imagers (B.K.P. and V.J.P.) performed a retrospective review of 110 CEDM cases conducted at our institution to evaluate the appearance of various anatomic and non-anatomic structures and artifacts in each subtracted image.
Anatomic structures
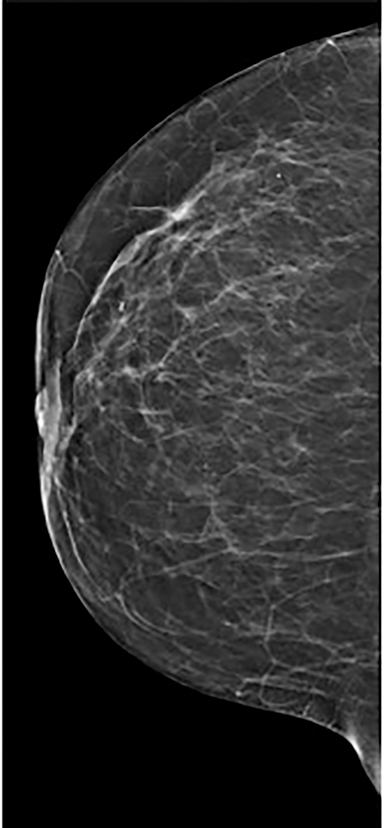
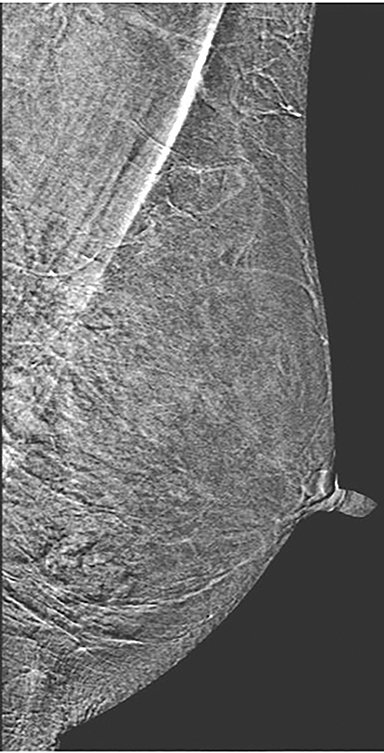
Skin—The appearance of the skin on a CEDM-subtracted image can be variable (Figure 1). Predominately, the skin is nonenhancing or shows a thin line of enhancement. Rarely, it shows artifactual thickening not seen on the standard 2-dimensional image. This artifact is thought to be related to current detector limitations in regard to high-energy X-ray doses. Given the variable appearance of the skin on subtraction images, any findings should be correlated with the low-energy image. Patient presentation of skin enhancement and thickening on the subtraction images can differ and should be evaluated on the standard low-energy mammography image.
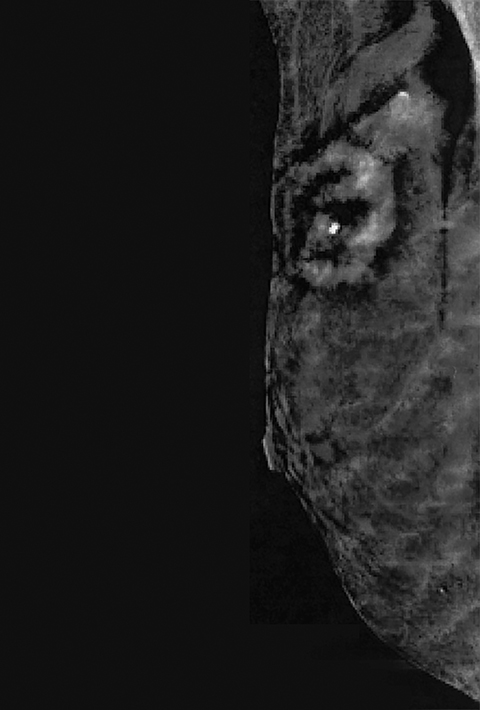
Nipple—Peripheral superficial enhancement of the nipple is commonly seen on MRI, attributable to the rich blood supply of the nipple areolar complex.11, 12 Conversely, the subtraction image on CEDM can yield various appearances of the nipple. The most common is that of no enhancement. Occasionally, a thin dark line is seen at the base of the nonenhancing nipple, which may give the illusion of a thin rim of peripheral enhancement. A less common appearance is minimal enhancement at the base of the nipple. In patients with flat nipples, a prominent thin rim of enhancement may be seen contiguous with the adjacent skin. The differences in nipple enhancement between MRI and CEDM are likely secondary to a combination of the differing contrast agents used and the compression applied with CEDM.
As with typical FFDM, every effort should be made to place the nipple in profile. When the nipple is not in profile (Figure 2A) the nipple may be mistaken for an enhancing mass within the anterior breast. By comparison, an image showing the nipple in profile allows for better detection of subareolar masses and helps prevent the nipple from being mistaken for a mass (Figure 2B). When limitations prevent the nipple from being placed into profile, a BB marker should be used to denote its location.
Pectoralis muscle—The majority of pectoralis muscles do not show enhancement on subtracted images. However, a small percentage (11%) of subtracted images demonstrate pectoral outlining, which mimics faint enhancement (Figure 3). Pectoral outlining is an artifact attributed to patient motion and does not indicate inflammation or pathologic change within the muscle itself. Therefore, misregistration artifact, similar to that seen in MRI with patient motion, may be present when pectoral outlining is seen.
Vessels—Vessels enhance more prominently and wash out on the first view than on subsequent views, similar to results of MRI (Figure 4). Also similar to MRI, when breast cancer is present, neoangiogenesis results in an increased number of enhancing vessels supplying the affected breast.13
Lymph nodes—Although lymph nodes are most commonly found in the axilla, intramammary lymph nodes can be seen in up to 47% of breasts.14 These findings are typically seen in the upper outer quadrants. Normal axillary and intramammary lymph nodes have characteristically benign appearances, including circumscribed margins; oval, round, or reniform shape; a fatty hilum; and proximity to a vessel.
Lymph nodes show various degrees of enhancement on CEDM images whereby the enhancement is not necessarily indicative of pathologic characteristics. Similar to MRI, normal lymph nodes may enhance avidly, whereas abnormal lymph nodes may not enhance at all.15 Evaluation of lymph node size and morphologic characteristics, as well as assessment of stability over time, is essential. Abnormal lymph nodes may show a more rounded appearance because the typical nonenhancing hilum becomes replaced by tumor. The enhancement pattern usually becomes more heterogeneous with increased lymph node size and may be secondary to metastatic implants or areas of necrosis.
Enhancing skin lesions—Skin lesions with increased vascularity, especially cherry angiomas, can demonstrate contrast enhancement on CEDM images and mimic cancers. However, in our experience, typical moles and seborrheic keratoses do not enhance. An example of the importance of placing mole markers on potentially enhancing skin lesions is shown in Figure 5.
Non-anatomic structures
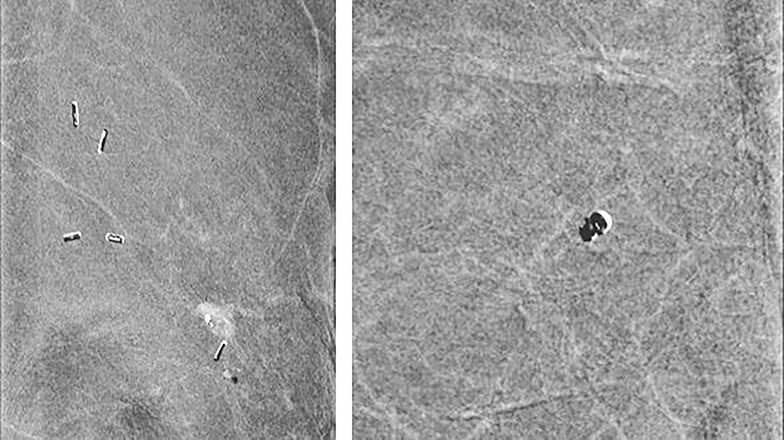
Clips—Placing clips after breast biopsy is common. Highly attenuated objects, such as clips and calcifications, can show a variable appearance. This variation depends on a demetal function that is intrinsic to CEDM software (Hologic, Inc). When the demetal function is off, clips and calcifications appear dark; in the enabled position, these structures appear bright. Currently, because artifacts can be caused by the demetal function, the default within the Hologic system is the off position. Future Hologic software upgrades are expected to fix these artifacts and allow the demetal function to remain on, giving clips and calcifications the bright appearance of which most mammographers are accustomed. A third type, that of alternating bright and dark appearance, gives a zebra artifact and is secondary to motion-causing misregistration (Figure 6). Misregistration is commonly seen.
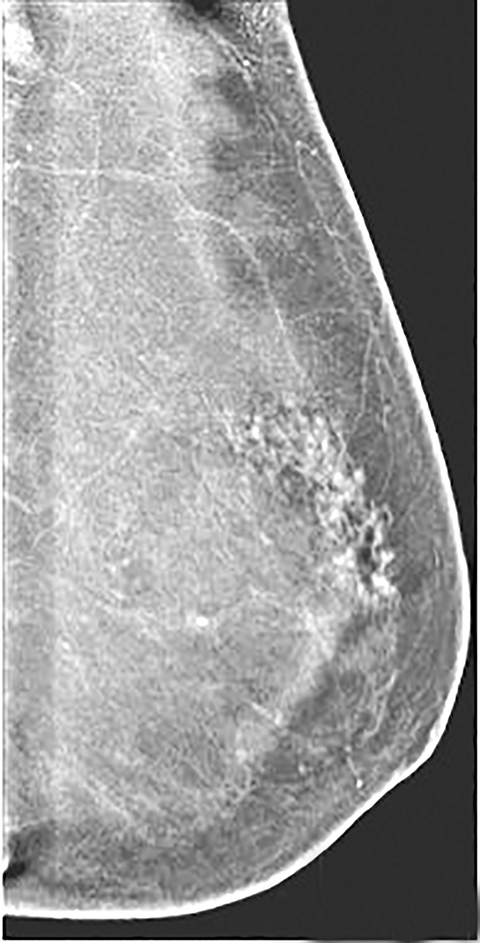
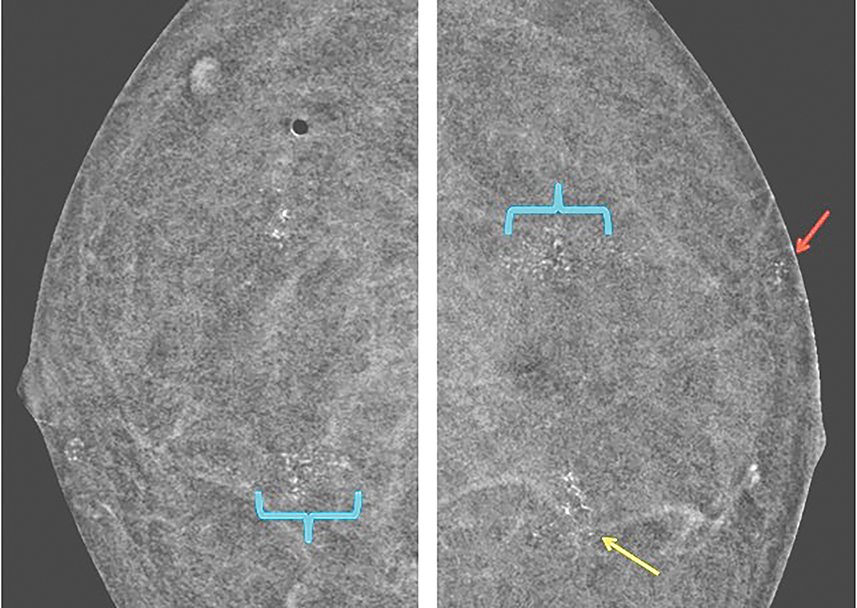
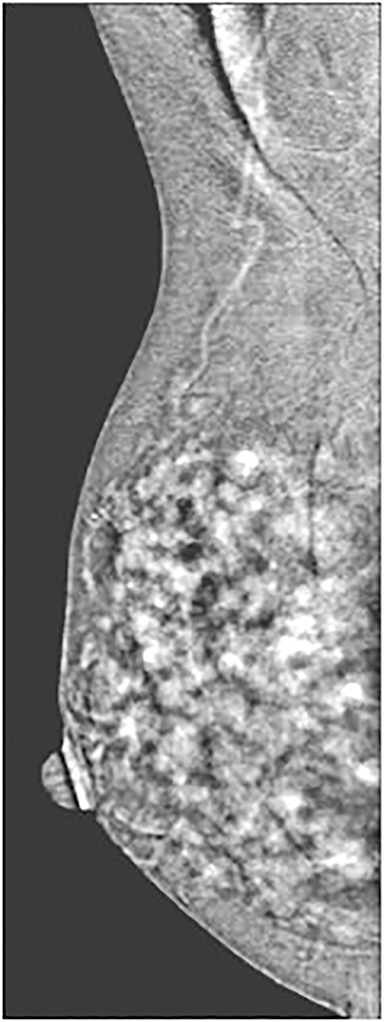
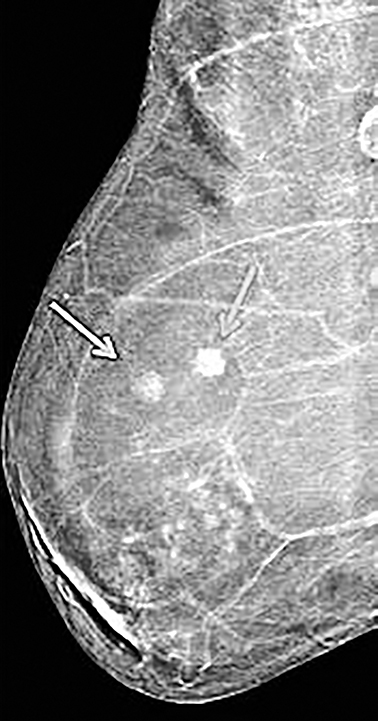
Calcifications—Because the demetal function is defaulted to the off position, most calcifications are dark on subtracted images. However, microcalcifications (<0.5 mm) seen on the low-energy image appear to be occult, without a dark (Figure 7) or bright appearance. In some instances where the demetaling function was inadvertently turned on between views, calcifications appeared dark on one view but bright on the other view. Larger calcifications may not appear uniformly dark when misregistration is present (Figure 6, right panel). For these reasons, it is important to use the low-energy images to evaluate breasts for microcalcifications.
Artifacts
Misregistration—Given that the high-energy and low-energy images are acquired one immediately after another, the potential for motion exists and can cause misregistration artifact. Misregistration between the two images results in adjacent dark and bright areas, causing so-called zebra artifact. This artifact has been seen related to clips, vessels, and calcifications (Figure 6).
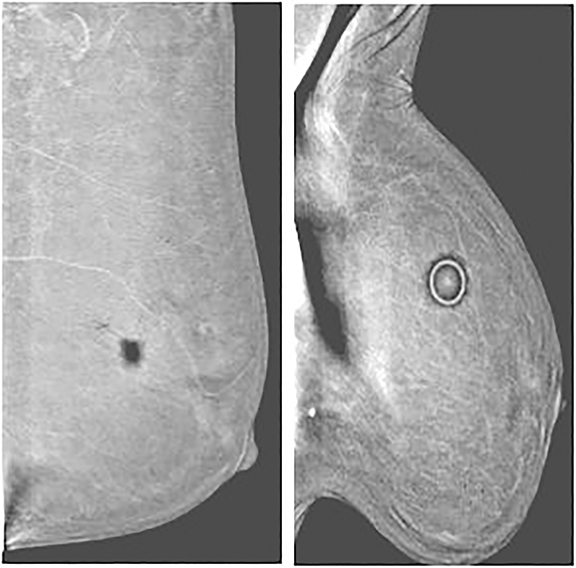
Air gap and other high-attenuation artifacts—In our experience with CEDM, the most common artifact results from an air gap. Partial contact between the skin and the detector or compression paddle creates a dark artifact that takes the configuration of an area of incomplete contact. Imperfect contact may result from improper compression, skin dimpling, or skin folds (Figure 8). Similar to clips and calcifications, a dark halo appearance can be seen around other high-attenuation items, such as mole markers, scar markers, BB markers, pacemakers, and chest ports secondary to an image-processing artifact.
Contrast contamination—Contrast material external to the patient, such as on the skin, the paddle, or the detector, can cause superimposed bright artifacts. In a CEDM examination, caution is critical to prevent contamination. Figure 9 shows a case that was initially presumed to have multiple, bilateral areas of abnormal enhancement. On further review of the images, the areas of supposed enhancement showed a mirror image configuration suggestive of contrast contamination of the paddle or detector, or both.
CEDM Evaluation and reporting
No reporting method for high-energy subtracted CEDM images has been established. Our institution has adopted a standardized reporting system through the Breast Imaging–Reporting and Data System (BI-RADS) lexicon, similar to those already published for mammography, ultrasonography and MRI.16
The low-energy image is interpreted as a standard mammography scan. Breast density ie, almost entirely fat, scattered areas of fibroglandular densities, heterogeneously dense or extremely dense)16 is included in the report, in addition to pertinent imaging findings.
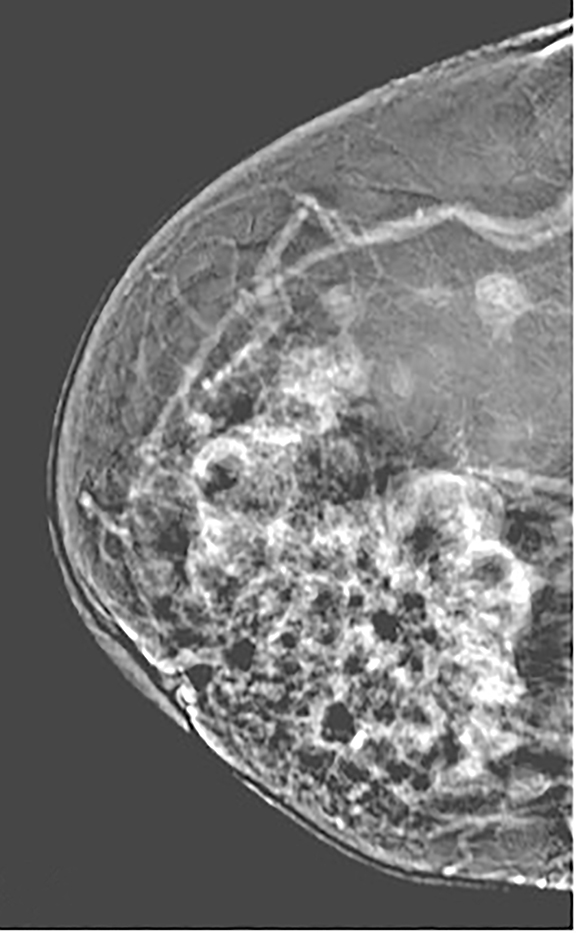
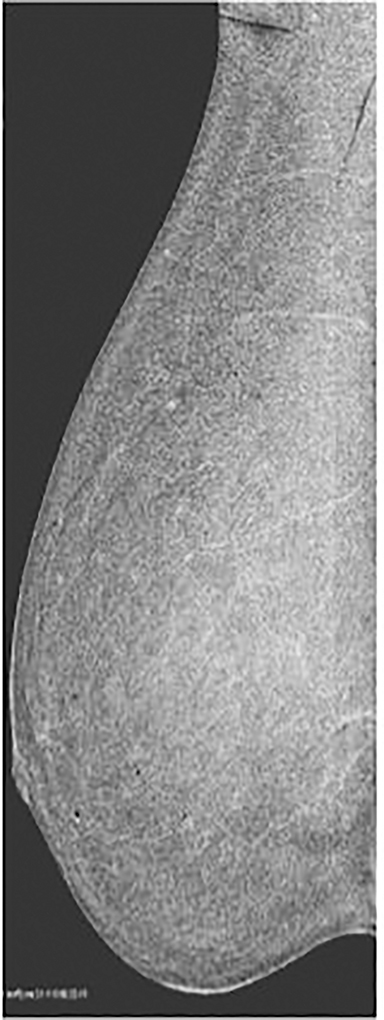
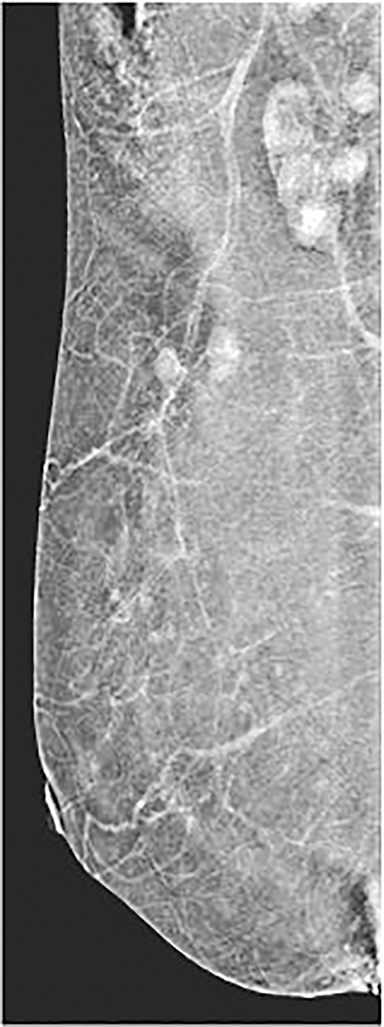
The next section in the CEDM report describes the findings on the subtracted image. The background parenchymal enhancement (BPE) is described (similar to BI-RADS MRI BPE) in 1 of 4 categories: minimal, mild, moderate, and marked (Table and Figure 10). Minimal BPE is defined as enhancement of 0% to 24%; mild as enhancement of 25% to 49%; moderate as enhancement of 50% to 74%; and marked as diffuse generalized enhancement of 75% to 100%.
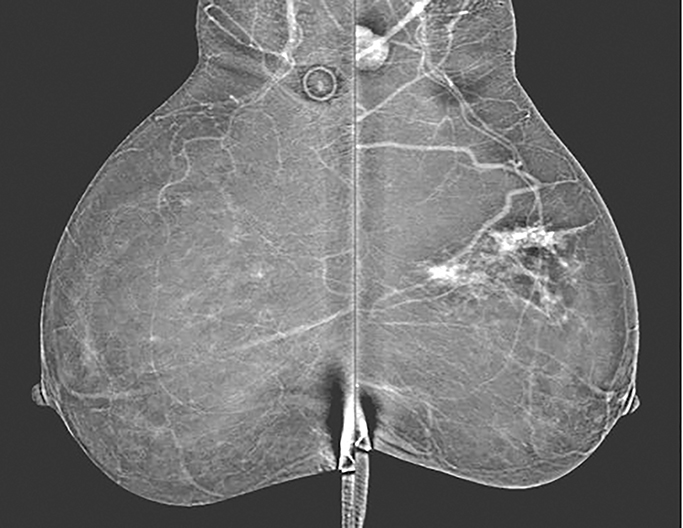
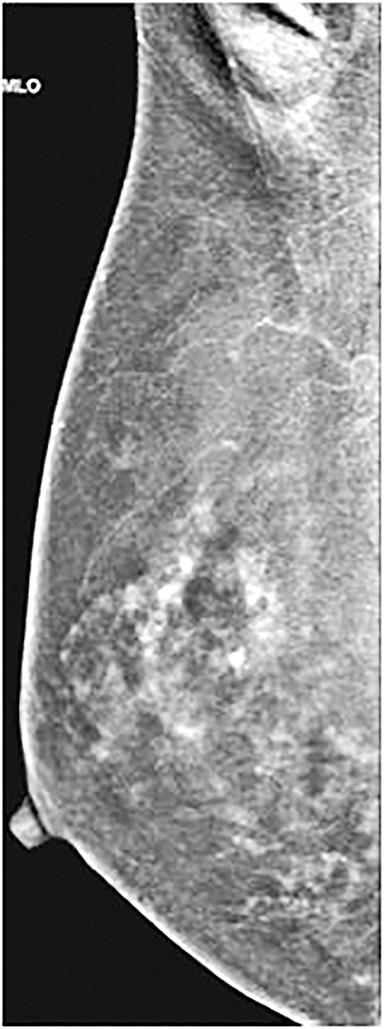
Similar to MRI, increased BPE may result in increased call-back rates. BPE is graded as symmetrical or asymmetrical between the breasts and, similar to MRI, asymmetrical enhancement can be seen because of benign and malignant causes, including those in patients with a history of radiation treatment or extensive pathologic manifestation in one breast (Figure 11).17
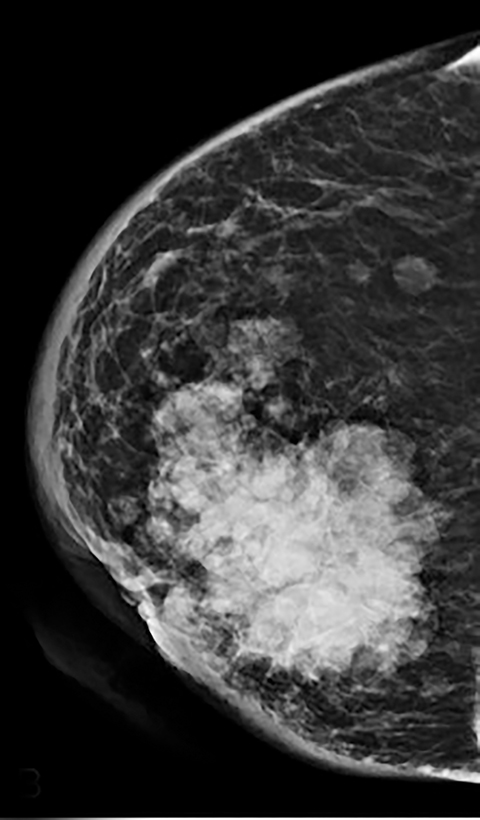
Findings described on low-energy mammography, such as calcifications, asymmetries, and masses, are further evaluated for any corresponding areas of abnormal enhancement on the subtracted images. Areas of abnormal enhancement are described further as mass or non-mass enhancement.
The term mass enhancement is used to describe a space-occupying lesion with mass-like borders; the term non-mass enhancement describes an asymmetry without clear borders.16 Determination of mass or non-mass enhancement is best made through interrogation of the low-energy image in conjunction with the subtracted image, because the shape and margins are often better delineated on the low-energy image. Both mass and non-mass enhancements are described by their quadrant location and given a 3-dimensional measurement.
In addition, areas of mass enhancement are described by their enhancement pattern, including homogeneous, heterogeneous, or rim enhancing. The degree of mass or non-mass enhancement is documented using 1 of 4 categories: none, mild, moderate, or marked. Finally, pertinent findings regarding structures outside the breast parenchyma (eg, axilla, skin, nipple) are reported (Figure 12).
Conclusion
CEDM is a novel modality that continues to show improved sensitivity in breast cancer detection compared with standard mammography. Studies reported in the literature continue to measure the performance of CEDM compared with standard mammography, MRI, and other breast-imaging modalities. We provide the first guide, to our knowledge, for radiologists and clinicians in interpreting the contrast-enhanced subtracted images. In providing case examples of the encountered anatomic and non-anatomic artifacts in our practice, we hope to ease the transition and help troubleshoot questions that may arise during the initial interpretation. A BI-RADS-based reporting structure is offered to enable consistent, quality-driven reports for clinicians.
References
- Francescone MA, Jochelson MS, Dershaw DD, et al. Low energy mammogram obtained in contrast-enhanced digital mammography (CEDM) is comparable to routine full-field digital mammography (FFDM). Eur J Radiol. 2014;83(8):1350-1355.
- Koukou V, Martini N, Fountos G, et al. Calcification detection optimization in dual energy mammography: influence of the x-ray spectra. In: Roa Romero LM, ed. XIII Mediterranean conference on medical and biological engineering and computing. MEDICON; 2013 Sep 25-28; Seville, Spain. Cham (ZG): Springer International; c2014: 459-462.
- Fallenberg EM, Dromain C, Diekmann F, et al. Contrast-enhanced spectral mammography: does mammography provide additional clinical benefits or can some radiation exposure be avoided? Breast Cancer Res Treat. 2014;146(2):371-381.
- Dromain C, Thibault F, Muller S, et al. Dual-energy contrast-enhanced digital mammography: initial clinical results. Eur Radiol. 2011;21(3):565-574.
- Jochelson MS, Dershaw DD, Sung JS, et al. Bilateral contrast-enhanced dual-energy digital mammography: feasibility and comparison with conventional digital mammography and MR imaging in women with known breast carcinoma. Radiology. 2013 ;266(3):743-751.
- Fallenberg EM, Dromain C, Diekmann F, et al. Contrast-enhanced spectral mammography versus MRI: initial results in the detection of breast cancer and assessment of tumour size. Eur Radiol. 2014 ;24(1):256-264.
- Hruska CB, Phillips SW, Whaley DH, et al. Molecular breast imaging: use of a dual-head dedicated gamma camera to detect small breast tumors. AJR Am J Roentgenol. 2008;191(6):1805-1815.
- Hruska CB, Boughey JC, Phillips SW, et al. Scientific impact recognition award: molecular breast imaging: a review of the Mayo Clinic experience. Am J Surg. 2008;196(4):470-476.
- Hruskaa CB, O’Connor MK. Quantification of lesion size, depth, and uptake using a dual-head molecular breast imaging system. Med Phys. 2008;35(4):1365-1376.
- Luczynska E, Heinze-Paluchowska S, Dyczek S, et al. Contrast-enhanced spectral mammography: comparison with conventional mammography and histopathology in 152 women. Korean J Radiol. 2014;15(6):689-696.
- Ojeda-Fournier H, Choe KA, Mahoney MC. Recognizing and interpreting artifacts and pitfalls in MR imaging of the breast. Radiographics. 2007;27 Suppl 1:S147-64.
- Nicholson BT, Harvey JA, Cohen MA. Nipple-areolar complex: normal anatomy and benign and malignant processes. Radiographics. 2009;29(2):509-523.
- Yasumura K, Ogawa K, Yuasa Y, et al. [Dynamic MRI and tumor angiogenesis of breast cancer]. Nihon Igaku Hoshasen Gakkai Zasshi. 2000;60(7):379-388. Japanese.
- Spillane AJ, Donnellan M, Matthews AR. Clinical significance of intramammary lymph nodes. Breast. 1999;8(3):143-146.
- Macura KJ, Ouwerkerk R, Jacobs MA, et al. Patterns of enhancement on breast MR images: interpretation and imaging pitfalls. Radiographics. 2006;26(6):1719-1734.
- D’Orsi CJ, Sickles EA, Mendelson EB, et al. Breast imaging reporting and data system. In: ACR BI-RADS Atlas. 5th edition Reston ,VA: American College of Radiology; c2013.
- 17.Li J, Dershaw DD, Lee CH, et al. Breast MRI after conservation therapy: usual findings in routine follow-up examinations. AJR Am J Roentgenol. 2010;195(3):799-807. Erratum in: AJR Am J Roentgenol. 2010;195(4):1043.
Dr. Lewis, Dr. Patel and Dr. Pizzitola are with the Department of Radiology, Mayo Clinic, Scottsdale, AZ.