3T MRI of prostate cancer
Images
Dr. Fütterer is a Radiologist and Dr. Barentsz is a Professor of Radiology and a Radiologist, Department of Radiology, University Medical Centre, Nijmegen, The Netherlands.
Prostate cancer is the most frequently diagnosed noncutaneous cancer in Western men. It was estimated that 27,050 men would die of this disease in 2007, and an estimated 218,890 new cases of prostate cancer would be diagnosed in the United States.1 From 1985 to 1992, the age-adjusted mortality rose dramatically,1 suggesting both a true increase in clinically important disease in addition to an increase in diagnostic sensitivity.
Detection and clinical staging of prostate cancer currently includes a prostate-specific-antigen test, a digital rectal examination, and a transrectal ultrasound-guided biopsy. The clinical stage is identified using these variables and is expressed in the TNM staging classification. In prostate cancer staging, it is important to differentiate between stage T2 (disease confined to the prostate) and T3 extraprostatic tumor disease. Curative therapy can be considered in cases of localized disease.
In the previous decade, magnetic resonance imaging (MRI) was used for local staging of prostate cancer. However, initially this technique did not yield optimal results. In 2 meta-analyses, a maximum joint sensitivity and specificity of 71% to 74% for conventional anatomical 1.5T MRI was found.2,3 With the improvement of curative therapies, exact localization of prostate cancer has become increasingly important. This information is used for image-guided treatments such as intensity-modulated radiotherapy, high-intensity focused ultrasound therapy, and cryotherapy. A recent study showed an area under the receiver operating curve of 0.67 to 0.69 for localizing prostate with regular 1.5T anatomical MRI.4 The localization accuracy increased to 0.80 and 0.91 using MR spectroscopic imaging (MRSI) and by utilizing a contrast agent, respectively.4
High-field-strength MR scanners (ie, 3T) are becoming more widely available in the scientific and clinical setting. The increased signal-to-noise ratio (SNR) inherent at 3T as compared with 1.5T offers potential for clinical MRI such as shortening of acquisition time and increased spatial resolution, or a combination of these two. This may improve local staging and localization accuracy in prostate cancer patients. It is likely that this increase in SNR will expand potential clinical applications in evaluating the prostate.5
3T MRI
The use of high magnetic field strength offers new possibilities in MRI. Many of the differences between MRI at 1.5T and 3T are the direct result of MR physical properties related to magnetic field strength changes. The SNR increases almost linearly with the magnetic field strength, whereas noise remains nearly unchanged.6-8 Thus, the SNR is approximately 2 times higher at 3T compared with 1.5T. The most significant benefit is probably the increase in spatial resolution to improve visualization of anatomical detail and/or to shorten acquisition time in order to increase patient throughput.
The chemical shift effect increases linearly with the main magnetic field strength. Spectral resolution is, therefore, increased compared with 1.5T. However, one should take into account that field inhomogeneity tends to increase with field strength.9 Potentially, signal intensity and frequency dispersion are higher, which may lead to better tumor characterization.
In dynamic contrast-enhanced MRI (DCE-MRI), the SNR increase can be used to improve the temporal resolution of dynamic measurements. An increased temporal resolution may allow a more accurate estimation of pharmacokinetic parameters.5 Adjustments to DCE-MRI sequences for kinetic analysis are, however, necessary.10
Potential drawbacks and challenges of clinical MRI at high field strengths include a quadrupling of radiofrequency (RF) power deposition compared with 1.5T,9,11 shorter T2- and longer T1-relaxation times, increased susceptibility differences, dielectric effect, and signal heterogeneity from larger B1 field variations.12 Using thinner slices, increasing the spatial resolution or bandwidth at higher field could partially circumvent some of these issues. However, these changes will "cost" some SNR. The loss in SNR is less than linear with voxel size because of the decreasing line width (eg, when resolution is increased from 0.75 to 0.094 cm3 , the SNR decreases between 44% and 60%.)13 Due to RF penetration effects, it can be difficult to achieve good RF field homogeneity.9 Parallel imaging techniques, increased repetition time (TR), reduced flip angle, and increased RF pulse duration can be used to overcome these problems, but at the cost of SNR.
The application of high field strength to the prostate may result in a more accurate delineation of cancer in this organ. This may potentially lead to improved tumor detection, localization, and staging.
Prostate anatomy
Normal anatomy
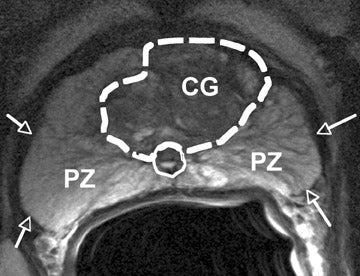
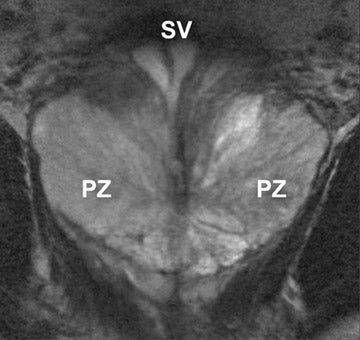
The prostate gland is situated directly under the bladder and envelops the prostatic urethra and the ductus ejaculatorii. The prostateis divided into apex and base (Figure 1). The latter is directed upward and is applied to the inferior surface of the bladder. The apex is directed downward and is in contact with the superior fascia of the urogenital diaphragm. Anteriorly, the prostate is directed to the pubic bone and is covered by a thick layer of fibromuscular stroma.14 The "true" prostatic capsule is a thin (0.5 to 2 mm) layer of connectiv etissue located external to the peripheral zone. Sattar et al15 considered the prostate capsule an extension of the prostate parenchyma itself.The seminal vesicles are paired grapelike pouches filled with fluid. Their size may vary depending on age and sexual activity.16 They lie caudolateral to the corresponding deferent duct, between the bladder and the rectum (Figure 1).
The prostate gland is composed of 30 to 50 small glands arranged in acini, separated by stroma. Twenty or thirty long tubuloalveolar glands connect the acini to the urethra. The prostate gland is divided into 3 zones: the peripheral, transition, and central zones. The size of the prostate is age-dependent; during puberty the prostate grows, in the presence of testosterone. With aging, the periurethral glandular tissue and the transition zone may considerably hypertrophy, gradually compressing the central zone and stretching the peripheral zone.17 The transition zone and central zone together are called the central gland . The periprostatic venous plexus surrounds the gland and drains into the internal iliac and presacral veins. The neurovascular bundle courses along the posterolateral aspect of the gland and is a preferential path for tumor spread because of small nerve branches that penetrate the prostate capsule in this area.
Prostate cancer
The peripheral zone consists of most of the glandular tissue, and most tumors are of glandular origin; therefore, 70% of all tumors are located in the peripheral zone. Approximately 20% of the prostate tumors emerge in the transitional zone and 10% in the central zone. Most central gland tumors have additional tumor foci in the peripheral zone.18
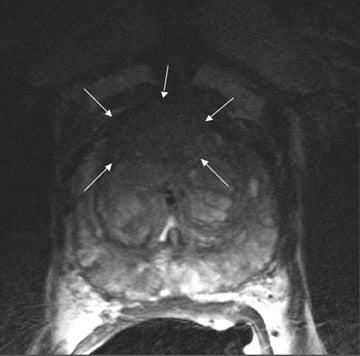
On T2-weighted (T2W) MR images, prostate carcinoma usually appears as an area of low signal intensity within a brighter normal peripheral zone (composed of ductal and acinar elements) (Figure 2).19,20 In addition to carcinoma, the differential diagnosis of an area of low signal intensity includes postbiopsy hemorrhage, chronic prostatitis, benign prostatic hyperplasia, effects of hormone or radiation treatment, scars, calcifications, smooth muscle hyperplasia, and fibromuscular hyperplasia.21
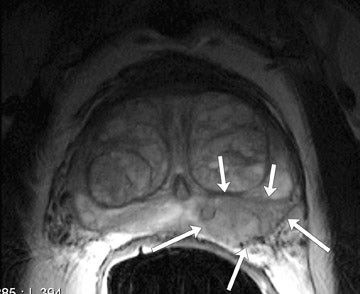
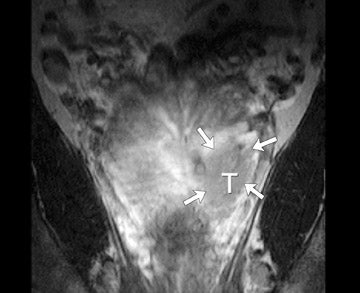
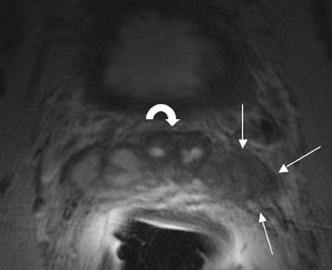
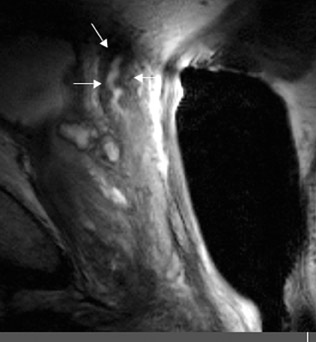
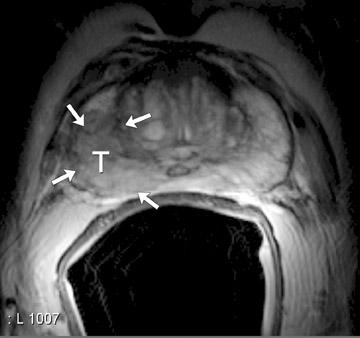
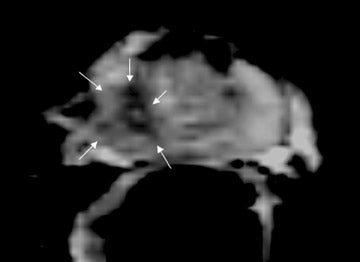
The central gland usually consists of nodular areas of varying signal intensity, depending on the relative amount of stromal and glandular hyperplasia.22 Detecting prostate carcinoma in the central gland on T2W images is difficult, especially when stromal hyperplasia dominates, which has signal intensity similar to that of carcinoma. A homogeneous lenticular-shaped area of low signal intensity is associated with prostate cancer in the central gland23 (Figure 3). On T2W images, abnormal asymmetric low signal intensity within thelumen or thickening of the seminal vesicle wall is suggestive of seminal vesicle invasion (Figure 4).24
Prostate MRI
The prostate can be well visualized using an endorectal coil combined with a pelvic phased-array coil at 1.5T.25 Initially, only a pelvic phased-array coil was available for prostate imaging at 3T.26,27 In 2004, a prototype endorectal coil was introduced that resulted in increased spatial resolution of T2W and contrast-enhanced T1-weighted (T1W) MRI, an increased temporal resolution of DCE-MRI,and increased spectral resolution of MRSI.5 Bloch et al28 investigated the feasibility of MRI of the prostate with a combination of an endorectal and pelvic phased-array coils. This resulted in high diagnostic quality and excellent anatomic detail on MR images.
At our institution, regular prostate MRI is performed at 3T (MAGNETOM Trio with TIM, Siemens Medical Solutions, Erlangen,Germany) using an endorectal coil (MEDRAD, Warrendale, PA) and a commercially available 8-channel body-array coil. Sagittal and axial T2W half-Fourier acquisition single-shot turbo spin-echo localizer images are obtained to check endorectal coil positioning. MRI is performed at least 3 to 4 weeks after prostate biopsy29,30 because the presence of blood products may obscure or be mistaken for prostate cancer. Prior to MRI, an intramuscular spasmolytic drug is injected to diminish bowel peristalsis. The endorectal coil is inserted and inflated with approximately 60 to 80 mL of liquid per fluorocarbon.31,32 In our experience, the patients tolerate the endorectal coil well. The imaging protocol consists of T2W turbo spin-echo MR images in 3 planes: MRS images, diffusion-weighted MR images, and DCE-MR images.
T2-weighted MRI
The need for using an endorectal coil at 3T has been questioned. Sosna et al26 found no significant difference in image quality between torso phased-array 3T imaging and endorectal 1.5T imaging of the prostate. However, they compared 20 patients scanned at 3T with 20 different patients at 1.5T. Heijmink et al33 found a significant improvement of image quality and staging accuracy using an endorectal coil compared with a body-array coil. A sensitivity of 73% to 80% and specificity of 97% to 100% for staging prostate cancer were found. These endorectal staging results were cofirmed in a different study, in which 3T endorectal MRI was investigated. The authors found a high accuracy of 94% and specificity of 96%.34 In this study, 2 of 3 histopathology-proven cases of minimal capsular invasion were detected with endorectal MRI. Therefore, it is advised to perform local staging with an endorectal coil at 3T.
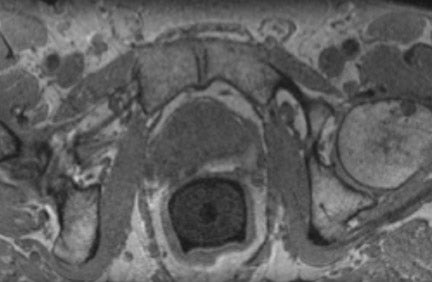
For T2W MRI, the following parameters are suggested: TR (msec)/echo time (TE) (msec) 3500-5000/124, 2.5 to 3-mm section thickness, 18 to 20 slices, 200-mm field of view (FOV) and 768 to 512 × 512 matrix. Hyperechoes are used to reduce the RF power deposition from the spin-echo train.35 The spin echoes are obtained with a train of low-power pulses with modulated flip angles to producea full spin echo at the effective TE. At 3T, the T1 and T2 relaxation time increases and decreases, respectively, compared with 1.5T. DeBazelaire et al36 found an increase of 21% for T1 relaxation time and a decrease of 16% for T2 relaxation time in the prostate (compared with 1.5T). At longer TEs (TE time beyond the T2 relaxation time of the prostate, ie, 74 ± 9 msec), the difference between cancer and healthy prostate tissue is more profound, provided the tissue with the shortest T2 still has adequate SNR.33 In addition to T2W images, an axial (T1W) intermediate-weighted sequence with the following parameters is required: TR/TE 20/4.4 msec, flip angle of 8º, and 280- to 320-mm FOV for detecting postbiopsy hemorrhage (Figure 5).
MR spectroscopic imaging
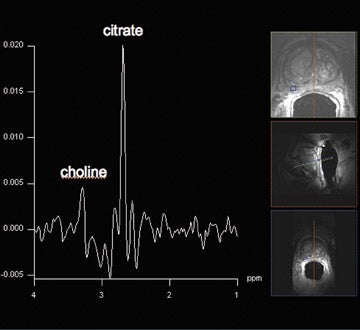
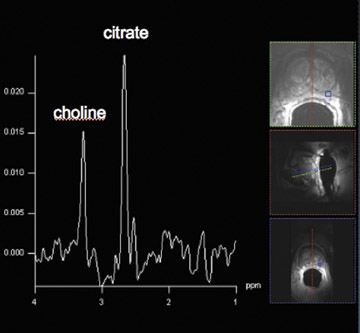
Proton MRSI reveals specific metabolic information about the prostate. This MR technique can be used for tumor localization, characterization, treatment planning, and therapy evaluation.37,38 Reduced levels of citrate and increased levels of choline are indicative of prostate cancer (Figure 6).38,39 A commonly used marker for cancer tissue is the ratio of choline + creatine/citrate. At 1.5T, MRSI of the prostate is performed with an endorectal coil. Specificities of 49% to 88% were achieved with accompanying sensitivities of 63% to92%, respectively.40,41 Using a standardized (zone-specific) threshold approach in MRSI of the prostate resulted in good accuracy and interobserver agreement in the differentiation between benign and malignant tissues.4,42 MR spectroscopic imaging of the prostate without an endorectal coil is feasible using the spine-array surface coil at 1.5T.43 However, spectral quality and SNR are clearly inferior to those in examinations performed with endorectal coils. Since the development of the endorectal coil, it has been possible to perform 3-dimensional (3D) proton MRSI of the prostate with a spatial resolution of up to 0.22 cm.3, 37
Spectroscopic MRI at 3T benefits from an increased signal intensity and improved spectral resolution. An adequate suppression oflipid signals and a locally homogeneous magnetic field strength are essential.44 In order to minimize magnetic field inhomogeneity, the endorectal coil should be filled with liquid perfluorocarbon. This decreases the susceptibility effect. Scheenen et al44 suggested using short TEs (eg, 75 msec) based on calculated T2 values of citrate and choline; however, problems with lipid contamination can occur. A short repetition time of 750 msec partially saturates choline signals but increases the SNR per unit time for citrate. The spectral shape of citrate is changed, which might impair its detection.45 This indicates that there is room for improvement and/or development of new pulse sequences in the future for optimizing MRSI at 3T. In our routine protocol, the authors perform MRSI with an endorectal coil with a spatial resolution of 5 × 5 × 5 mm.3
Diffusion-weighted imaging
Diffusion is a 3D, physical process that is important in many physiological functions. Diffusion-weighted MRI was initially appliedto the brain for stroke and ischemia detection.46,47 Only recently, this technique has been introduced in prostate MRI because of the development of ultrafast echoplanar sequences. To date, only a few papers have been published concerning diffusion-weighted imaging of the prostate at 3T.48-53
The apparent diffusion coefficient (ADC) values of malignant tissue are lower than in the healthy peripheral zone54 (Figure 7). This decrease is probably caused by increased cellular density.55 The ADC value of the healthy peripheral zone is also higher compared with that of the central gland. This can be explained by the higher water content of the prostatic luminal space. Diffusion-weighted imaging was successfully performed using an endorectal coil. Although air was used for inflation, the diagnostic quality was not degraded at1.5T.56 Sato et al57 compared the ADC values of normal and cancerous tissue in both peripheral and transition zones at 1.5T. The ADC values of prostate cancer in both zones were significantly lower than those of benign tissue in the corresponding zone. Biopsy, as the standard of reference, may have introduced inaccurate correlation between the region-of-interest and the biopsy specimen.
Pickles et al52 were the first to report the application of diffusion-weighted imaging of the prostate at 3T. Although ADC values were lower for tumors compared with those of the normal-appearing peripheral zone, there was considerable intersubject variability. Kim et48 focused on both peripheral and transition zones and used whole-mount section histopathology as the standard of reference. It was found that the ADC values of malignant tissues were significantly lower than those of benign tissues in the peripheral zone and transition zone. Almost all previous studies focused on ADC measurements in healthy and cancerous tissue. Manenti et al53 performed a feasibility study for 3T diffusion tensor imaging and fiber tracking in prostate cancer patients that resulted in good delineation of the prostate anatomy (capsule outline, peripheral and central area borders), neoplastic lesion extension, and capsule infiltration. The true clinical value of diffusion-weighted imaging, diffusion tensor imaging, and fiber tracking in prostate cancer patients has to be investigated in future studies.
Dynamic contrast-enhanced MRI
Dynamic contrast-enhanced MRI is a method to probe tumor angiogenesis. Data reflecting tissue perfusion, micro-vessel permeability, and the extracellular leakage space can be obtained. Insights into these physiologic processes are obtained qualitatively by characterizing kinetic enhancement curves or quantitatively by applying complex compartmental modeling techniques.58
Low molecular weight, extravascular and extracellular contrast agent (gadolinium chelate) shortens the T1 relaxation of water producing high signal intensity on T1W images. The T1 relaxation time of the tissues is prolonged at 3T compared with 1.5T. The relaxivity properties of gadolinium chelate are not significantly different at 1.5 from at 3T. The longer T1 relaxation time of tissues and increased SNR results in an increased contrast between tumor and normal tissue.59
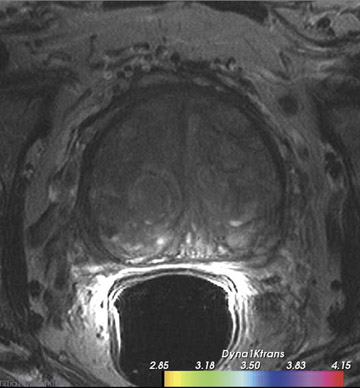
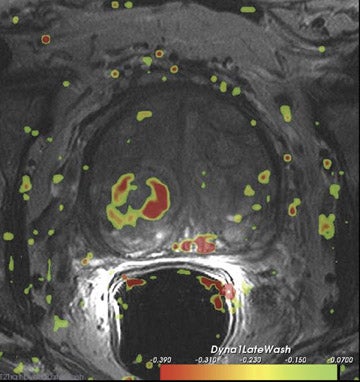
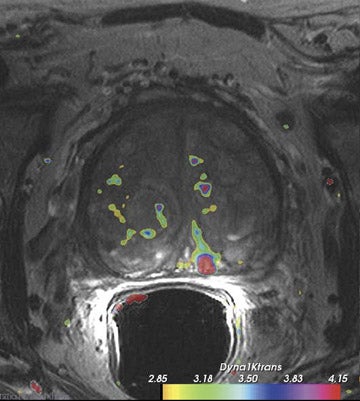
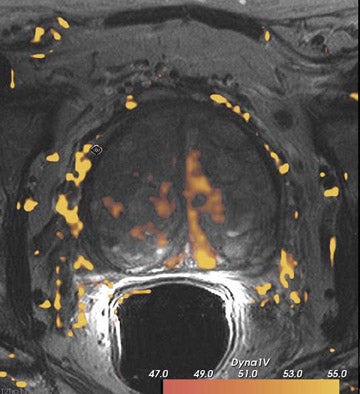
Dynamic contrast-enhanced MRI is less accurate because of limitations of temporal and spatial resolution at 1.5T. The dynamic MRI protocol used at the authors' institution includes an optimized T1W turbo fast low-angle shot (FLASH) sequence (230 mm FOV, 128× 128 matrix, and 16 slices) that is obtained with a fast temporal resolution (every 2.8 seconds for 2 minutes) and acquired with anendorectal coil. Gadolinium chelate is administered as contrast material. In this protocol, we have selected for high spatial resolution and intermediate temporal resolution (Figure 8). The use of 3T MRI enables the increase in temporal resolution of DCE-MRI from 2seconds to 1 second (10 partitions).5 Kim et al60 described the first localization results of prostate cancer by DCE-MRI at 3T. This article reported superior localization results for DCE-MRI compared with T2W imaging; however, this result did not achieve statistical significance. However, the depiction of tumor borders was statistically superior compared with anatomical MR images ( P = 0.006).
Conclusion
Results of prostate MRI at 3T are now being published more frequently in the scientific literature. At the moment, the most significant improvement of whole-body 3T prostate MRI is the increase in spatial resolution and high local staging accuracy. Local staging should be performed preferably with an endorectal coil at 3T. Pelvic phased-array 3T imaging and endorectal 1.5T imaging reveal equal image quality and anatomical details. However, tumor lesion detection or localization will probably not benefit from high field strengths because tissue contrast is minimally affected. Currently, 3D MRSI is feasible without an endorectal coil.61 This noninvasive technique can be used for patients with negative biopsies and rising PSA values. Diffusion-weighted imaging can be an important addition to 3Tprostate MRI. However, larger studies with adequate MR and pathological correlation should be performed to evaluate this technique more rigorously. Endorectal DCE-MRI makes it possible to combine fast imaging (<3 sec/image set) with good spatial resolution. This technique directly benefits from the increase in SNR. In the end, a dedicated imaging protocol, including optimal sequences and coil selection, should be developed and used for each unique indication (eg, tumor detection and localization, staging, local recurrence, etc).
REFERENCES
- Jemal A, Siegel R, Ward E, et al. Cancer statistics. 2007. CA Cancer J Clin. 2007;57:43-66.
- Sonnad SS, Langlotz CP, Schwartz JS. Accuracy of MR imaging for staging prostate cancer: A meta-analysis to examine the effect of technologic change. Acad Radiol. 2001;8:149-157.
- Engelbrecht MR, Jager GJ, Laheij RJ, et al. Local staging of prostate cancer using magnetic resonance imaging: A meta-analysis. Eur Radiol. 2002; 12:2294-2302.
- Fütterer JJ, Heijmink SW, Scheenen TWJ, et al. Prostate cancer localization with dynamic contrast-enhanced MR imaging and proton MR spectroscopic imaging. Radiology. 2006;241:449-458.
- Fütterer JJ, Scheenen TW, Huisman HJ, et al. Initial experience of 3 Tesla endorectal coil magnetic resonance imaging and 1H-spectroscopic imaging of the prostate. Invest Radiol. 2004;39:671-680.
- Bottomley PA, Foster TH, Argersinger RE, Pfeifer LM. A review of normal tissue hydrogen NMR relaxation times and relaxation mechanisms from 1-100 MHz: Dependence on tissue type, NMR frequency, temperature, species, excision, and age. Med Phys. 1984;11(4):425-448.
- Edelstein WA, Glover GH, Hardy CJ, Redington RW. The intrinsic signal-to-noise ratio in NMR imaging. Magn Reson Med. 1986;3:604-618.
- Hoult DI, Chen CN, Sank VJ. The field dependence of NMR imaging. II. Arguments concerning an optimal field strength. Magn Reson Med. 1986;3: 730-746.
- Schick F. Whole-body MRI at high field: Technical limits and clinical potential. Eur Radiol. 2005;15:946-959.
- Wang J, Alsop DC, Li L, et al. Comparison of quantitative perfusion imaging using arterial spin labeling at 1.5 and 4.0 Tesla. Magn Reson Med. 2002;48:242-254.
- Bernstein MA, Huston J 3rd, Lin C, et al. High-resolution intracranial and cervical MRA at 3.0T: Technical considerations and initial experience. Magn Reson Med 2001;46:955-962.
- Greenman RL, Shirosky JE, Mulkern RV, Rofsky NM. Double inversion black-blood fast spin-echo imaging of the human heart: Acomparison between 1.5T and 3.0T. J Magn Reson Imaging. 2003;17:648-655.
- Gruber D, Mlynárik V, Moser E. High-resolution 3D proton spectroscopic imaging of the human brain at 3T: SNR issues and application for anatomy-matched voxel sizes. Magn Reson Med. 2003; 49:299-306.
- Myers RP, Goellner JR, Cahill DR. Prostate shape, external striated urethral sphincter and radical prostatectomy: The apical dissection. J Urol. 1987;138:543-550.
- Sattar AA, Noël JC, Vanderhaeghen JJ, et al. Prostate capsule: Computerized morphometric analysis of its components. Urology. 1995;46:178-181.
- Fuse H, Okumura A, Satomi S, et al. Evaluation of seminal vesicle characteristics by ultrasonography before and after ejaculation. Urol Int. 1992; 49:110-113.
- Villeirs GM and De Meerleer GO. Magnetic resonance imaging (MRI) anatomy of the prostate and application of MRI in radiotherapy planning. Eur J Rad. 2007; 63:361-368.
- McNeal JE. Normal and pathologic anatomy of prostate. Urology. 1981;17(suppl 3):11-16.
- Cruz M, Tsuda K, Narumi Y, et al. Characterization of low-intensity lesions in the peripheral zone of prostate on pre-biopsy endorectal coil MR imaging. Eur Radiol. 2002;12:357-365.
- Claus FG, Hricak H, Hattery RR. Pretreatment evaluation of prostate cancer: Role of MR imaging and 1H MR spectroscopy. Radiographics. 2004;24 (suppl 1):S167-S180.
- Schiebler ML, Schnall MD, Pollack HM, et al. Current role of MR imaging in the staging of adenocarcinoma of the prostate. Radiology. 1993;189:339-352.
- Janus C, Lippert M. Benign prostatic hyperplasia: Appearance on magnetic resonance imaging. Urology. 1992;40(6):539-541.
- Akin O, Sala E, Moskowitz CS, et al. Transition zone prostate cancers: Features, detection, localization, and staging at endorectal MR imaging. Radiology. 2006;239:784-792.
- Outwater EK, Petersen RO, Siegelman ES. Prostate carcinoma: Assessment of diagnostic criteria for capsular extension on endorectal coil images. Radiology. 1994;193:333-339.
- Fütterer JJ, Engelbrecht MR, Jager GJ, et al. Prostate cancer: Comparison of local staging accuracy of pelvic phased-array coil alone versus integrated endorectal-pelvic phased-array coils. Local staging accuracy of prostate cancer using endorectal coil MR imaging. Eur Radiol. 2007;17: 1055-1065.
- Sosna J, Pedrosa I, Dewolf WC, et al. MR imaging of the prostate at 3 Tesla: Comparison of an external phased-array coil to imaging with an endorectal coil at 1.5 Tesla. Acad Radiol . 2004;11:857-862.
- Kim HW, Buckley DL, Peterson DM, et al. In vivo prostate magnetic resonance imaging and magnetic resonance spectroscopy at 3 Tesla using a transceive pelvic phasedarray coil: Preliminary results. Invest Radiol. 2003;38:443-451.
- Bloch BN, Rofsky NM, Baroni RH, et al. 3 Tesla magnetic resonance imaging of the prostate with combined pelvic phased-array and endorectal coils; Initial experience (1). Acad Radiol. 2004;11:863-867.
- White S, Hricak H, Forstner R, et al. Prostate cancer: Effect of postbiopsy hemorrhage on interpretation of MR images. Radiology. 1995;195:385-390.
- Ikonen S, Kivisaari L, Vehmas T, et al. Optimal timing of post-biopsy MR imaging of the prostate. Acta Radiol. 2001;42:70-73.
- Prando A, Kurhanewicz J, Borges AP, et al. Prostatic biopsy directed with endorectal MR spectroscopic imaging findings in patients with elevated prostate specific antigen levels and prior negative biopsy findings: Early experience. Radiology. 2005; 236:903-910.
- Rosen Y, Bloch BN, Lenkinski RE, et al. 3T MR of the prostate: Reducing susceptibility gradients by inflating the endorectal coil with a barium sulfate suspension. Magn Reson Med. 2007;57:898-904.
- Heijmink SW, Fütterer JJ, Hambrock T, et al. Prostate cancer: Body-array versus endorectal coil MR imaging at 3 T-comparison of image quality, localization, and staging performance. Radiology. 2007;244:184-195.
- Fütterer JJ, Heijmink SW, Scheenen TW, et al. Prostate cancer: Local staging at 3-T endorectal MR imaging-early experience. Radiology. 2006; 238:184-191.
- Hennig J, Scheffler K. Hyperechoes. Magn Reson Med. 2001;46:6 -12.
- de Bazelaire CM, Duhamel GD, Rofsky NM, Alsop DC. MR imaging relaxation times of abdominal and pelvic tissues measured in vivo at 3.0 T: Preliminary results. Radiology. 2004;230:652-659.
- Kurhanewicz J, Vigneron DB, Hricak H, et al. Three-dimensional H-1 MR spectroscopic imaging of the in situ human prostate with high (0.24-0.7-cm3) spatial resolution. Radiology. 1996;198:795-805.
- Heerschap A, Jager GJ, van der Graaf M, et al. In vivo proton MR spectroscopy reveals altered metabolite content in malignant prostate tissue. Anticancer Res. 1997;17:1455-1460.
- Kurhanewicz J, Vigneron DB, Nelson SJ, et al. Citrate as an in vivo marker to discriminate prostate cancer from benign prostatic hyperplasia and normal prostate peripheral zone: Detection via localized proton spectroscopy. Urology. 1995;45:459-456.
- Zakian KL, Sircar K, Hricak H, et al. Correlation of proton MR spectroscopic imaging with Gleason score based on step-section pathologic analysis after radical prostatectomy. Radiology. 2005;234:804-814.
- Scheidler J, Hricak H, Vigneron DB, et al. Prostate cancer: Localization with three-dimensional proton MR spectroscopic imaging-clinicopathologic study. Radiology. 1999;213:473-480.
- Jung JA, Coakley FV, Vigneron DV, et al. Prostate depiction at endorectal MR spectroscopic imaging: Investigation of a standardized evaluation system. Radiology. 2004;233:701-708.
- Lichy MP, Pintaske J, Kottke R, et al. 3D proton MR spectroscopic imaging of prostate cancer using a standard spine coil at 1.5 T in clinical routine: A feasibility study. Eur Radiol. 2005;15:653-660.
- Scheenen TW, Gambarota G, Weiland E, et al. Optimal timing for in vivo 1H-MR spectroscopic imaging of the human prostate at 3T. Magn Reson Med. 2005;53:1268-1274.
- Rouvière O, Hartman RP, Lyonnet D. Prostate MR imaging at high-field strength: Evolution or revolution? Eur Radiol. 2006;16:276-284.
- Moseley ME, Kucharczyk J, Mintorovitch J, et al. Diffusion-weighted MR imaging of acute stroke: Correlation with T2-weighted and magnetic susceptibility-enhanced MR imaging in cats. AJNR Am J Neuroradiol. 1990;11:423-429.
- Lansberg MG, Thijs VN, O'Brien MW, et al. Evolution of apparent diffusion coefficient, diffusion-weighted, and T2-weighted signal intensity of acute stroke. AJNR Am J Neuroradiol. 2001;22:637-644.
- Kim CK, Park BK, Han JJ, et al. Diffusion-weighted imaging of the prostate at 3 T for differentiation of malignant and benign tissue in transition and peripheral zones: Preliminary results. J Comput Assist Tomogr. 2007;31:449-454. Erratum in: J Comput Assist Tomogr. 2007;31:656.
- Gibbs P, Pickles MD, Turnbull LW. Repeatability of echo-planar-based diffusion measurements of the human prostate at 3T. Magn Reson Imaging. 2007; 25:1423-1429.
- Miao H, Fukatsu H, Ishigaki T. Prostate cancer detection with 3-T MRI: Comparison of diffusion-weighted and T2-weighted imaging. Eur J Radiol. 2007;61:297-302.
- Gibbs P, Pickles MD, Turnbull LW. Diffusion imaging of the prostate at 3.0 tesla. Invest Radiol. 2006;41:185-188.
- Pickles MD, Gibbs P, Sreenivas M, Turnbull LW. Diffusion-weighted imaging of normal and malignant prostate tissue at 3.0T. J Magn Reson Imaging 2006;23:130-134.
- Manenti G, Carlani M, Mancino S, et al. Diffusion tensor magnetic resonance imaging of prostate cancer. Invest Radiol. 2007;42:412-419.
- Issa B. In vivo measurement of the apparent diffusion coefficient in normal and malignant prostatic tissues using echo-planar imaging. J Magn Reson Imaging. 2002;16:196-200.
- Anderson AW, Xie J, Pizzonia J, et al. Effects of cell volume fraction changes on apparent diffusion in human cells. Magn Reson Imaging. 2000;18:689-695.
- Hosseinzadeh K, Schwarz SD. Endorectal diffusion-weighted imaging in prostate cancer to differentiate malignant and benign peripheral zone tissue. J Magn Reson Imaging. 2004;20:654-661.
- Sato C, Naganawa S, Nakamura T, et al. Differentiation of noncancerous tissue and cancer lesions by apparent diffusion coefficient values in transition and peripheral zonesof the prostate. J Magn Reson Imaging. 2005;21:258-262.
- d'Arcy JA, Collins DJ, Padhani AR, et al. Informatics in Radiology (infoRAD): Magnetic Resonance Imaging Workbench: analysis and visualization of dynamic contrast-enhanced MR imaging data. Radiographics. 2006;26:621-632.
- Nöbauer-Huhmann IM, Ba-Ssalamah A, Mlynarik V, et al. Magnetic resonance imaging contrast enhancement of brain tumors at 3 tesla versus 1.5 tesla. Invest Radiol. 2002;37:114-119.
- Kim CK, Park BK, Kim B. Localization of prostate cancer using 3T MRI: Comparison of T2-weighted and dynamic contrast-enhanced imaging. J Comput Assist Tomogr. 2006;30:7-11.
- Scheenen TWJ, Heijmink SW, Roell SA, et al. Three-dimensional proton MR spectroscopy of human prostate at 3T without endorectal coil: feasibility. Radiology. 2007;245:507-516.