A Radiologist’s Guide to Radiation Dose Index Monitoring
By Jordan DW, Dietz AT
CME credits are available for this article here.
Radiation dose index monitoring (RDIM) software can automatically collect and store digital data related to patient radiation exposure and other examination parameters in diagnostic imaging. Numerous commercial solutions provide various tools to analyze and interpret the data. This review provides radiologists with a brief overview of these technologies and relevant informatics considerations. It also provides several use cases in quality management.
There are several important points that radiologists should be mindful of with respect to implementing RDIM technology. First, RDIM enables automated collection of large amounts of data for analysis from a single modality device or from throughout an entire facility or enterprise. Such data sets can be valuable for quality management purposes, as they provide robust information about the behavior and performance of imaging equipment for a given patient population.
Second, RDIM collects data that are related to patient radiation dose but do not constitute actual patient dose. Dose index values are usually correlated to the radiation output of a device and may or may not include other factors needed to determine dose (eg, patient body habitus). These data should be interpreted with caution and with assistance from a qualified medical physicist.1
Third, while it is a quality management tool, RDIM with few exceptions should not be used for clinical decision making; eg, for recording cumulative patient dose histories or guiding decisions about future radiological procedures.2 Every radiological procedure is accompanied by an independent benefit-risk consideration for each patient in their current circumstances, and past exposure does not affect the risk when considering another procedure.3–5 In many cases, RDIM data do not contain accurate calculations of patient absorbed dose, organ dose, or effective dose.6
Furthermore, no universally accepted standard method exists for measuring image quality in RDIM systems. A number of techniques have been developed to automatically quantify image quality,7,8 while many RDIM systems focus solely on radiation dose index data. Since image quality strongly affects the benefit of a radiological procedure, RDIM data and analytics are usually unable to present a comprehensive or balanced view of risk and benefit. Clinical decision making should follow evidence-based consensus guidelines and appropriateness criteria.9
Fourth, RDIM systems are complex informatics platforms that require substantial expert effort to implement, validate, and maintain.10 Radiologists should engage sufficient medical physics and informatics support for clinical use of these systems to ensure data quality and system reliability.
Radiation Dose Quantities and Dose Indices
Absorbed dose (expressed in mGy) describes the amount of energy deposited in matter (such as tissue) by an episode of radiation exposure, while effective dose (expressed in mSv) adjusts the absorbed dose by the relative radiosensitivity of the exposed tissue to provide a quantitative value that correlates more closely to risk. This is valid for populations and unlikely to be meaningful for individual patients.
Organ dose is the dose absorbed by a specific organ. Peak skin dose (PSD) is the highest absorbed dose delivered to any location on a patient’s skin during a radiologic procedure.
There are a number of dose index values for specific imaging modalities that quantify the amount of source radiation that delivers absorbed, organ, skin, and effective doses to patients.11 Examples include volume CT dose index (CTDIvol) and dose-length product (DLP) in CT or reference point air kerma (Ka,r) and kerma-area product (PKA) in interventional fluoroscopy.
Technical Description
Radiological imaging equipment stores information about radiation exposure, as well as other relevant patient, exam, protocol, and technique factors, in log files formatted as digital imaging and communications in medicine (DICOM) Radiation Dose Structured Report (RDSR) objects.
Typically, an RDSR is generated at the end of an exam or procedure and stored locally in the modality database. It may or may not be visible in the patient or image directory. RDSR objects may automatically be transmitted to a designated network node, or the user may be required to send them manually. Other data formats have been used in the past, but the utility and widespread availability of RDSR data from imaging modalities have relegated other approaches, such as modality performed-procedure step message collection or optical character recognition of exam information page images, to legacy status, and commercial RDIM solutions are likely to discontinue support of them in the near future.
RDIM implementation consists of the following: a DICOM node to collect incoming RDSR objects; processing to parse the contents of the RDSR and extract data elements of interest; a database to store the extracted data elements; and one or more applications to either present the database information to a user as charts, tables, or graphs, or export the data in files for further analysis. An on-premises implementation may use a single physical or virtual server connected to the same local area network (LAN) as the imaging modality equipment and running all of these functions.
For enterprise applications, a typical hybrid implementation includes one or more DICOM nodes on the imaging facility LAN or virtual LAN (VLAN) with processing, database, and user applications hosted on a remote server or cloud computing platform.12 The collecting DICOM node or nodes on the facility LAN forward the collected RDSR objects to the cloud platform over a virtual private network connection for further processing and long-term storage.
In a hybrid topology, the LAN-based collecting node may perform some processing and extract data from the RDSR objects, or it may simply forward the objects to the remote server. Some implementations may modify RDSR objects to anonymize or de-identify data at the LAN node before transmission to the remote server to comply with institutional policies or local laws or regulations concerning the privacy and confidentiality of personally identifiable patient information, especially since such information is not needed for most RDIM use cases.
The data stored in the RDIM database contain two types of values. Primary values are stored in the RDSR object by the originating imaging modality and then directly extracted and stored in the RDIM database. Derived values are calculated, usually by the RDIM processing or ancillary applications, and stored in the RDIM database. Derived values usually use information from the RDSR and may require additional information, such as patient body habitus from images or digital phantoms. Examples of derived values in CT include size-specific dose estimates,13 organ doses, and effective doses.
There are numerous possibilities for end-user applications, which are normally accessed through a web browser. Common capabilities include: chronological trends in dose index values for a specific modality and exam; histograms of dose index values for specific exams; alert dashboards showing exams for which dose index values exceed predetermined thresholds; tables of detailed data values; and displays of the full database record for an individual patient record or procedure. Most analytics interfaces allow the user to search, filter, and sort the data in real time, as well as to save specific search and filter criteria for repeated review. User applications may provide access to primary data, derived values, or both.
RDIM Use Cases
Radiation Exposure Benchmarking
RDIM can be useful for comparing a facility’s radiation exposure parameters to external benchmarks and monitoring trends. Sources of benchmark values for specific exams and patient populations include scientific and medical literature,14 accreditation program standards,15,16 and professional consensus practice guidelines.17
Facility data are used to calculate the Diagnostic Reference Level (DRL) and Achievable Dose (AD) for various exams.18,19 RDIM provides a useful data source for these calculations, and some RDIM tools include automated routines or macros to select exams and time periods of interest and to calculate DRL and AD from the database. The facility DRL and AD values can be compared to the external benchmarks to determine whether any practice changes are indicated to align patient radiation exposure with the chosen benchmarks.
Radiation Dose Registries
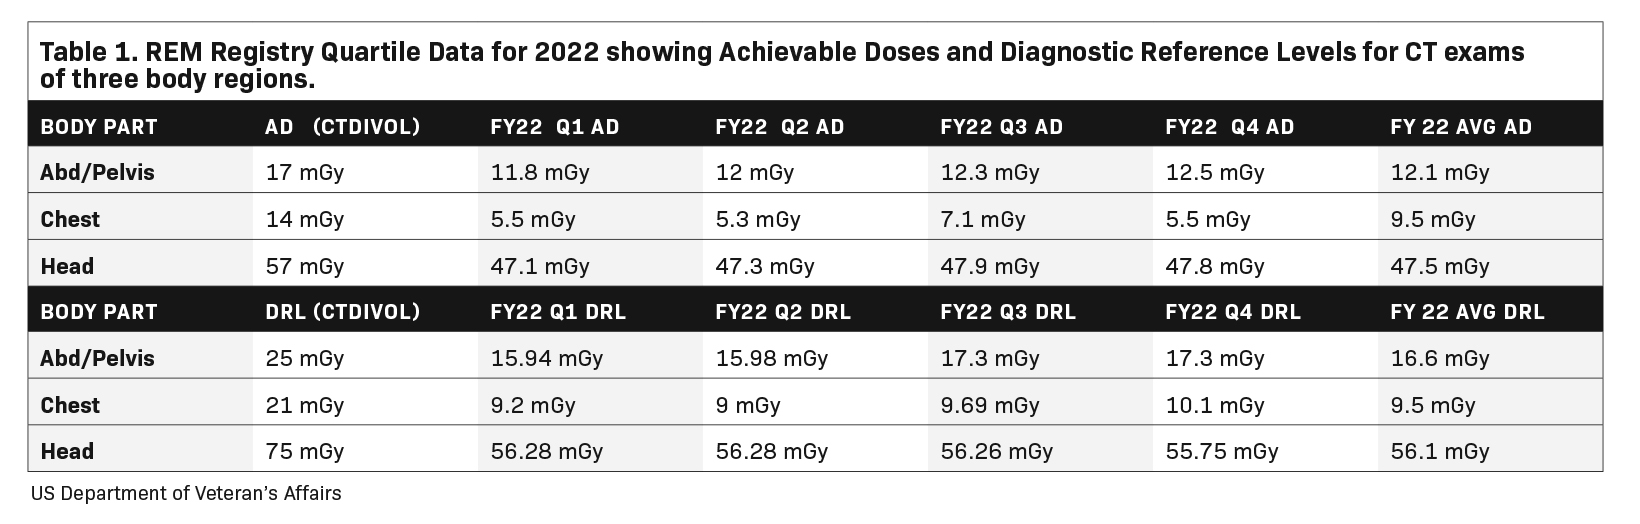
RDIM has enabled the creation of large registries of radiation dose index data aggregated across multiple facilities to aid in bench-marking and making comparisons. The American College of Radiology’s Dose Index Registry (DIR) has continuously collected data on millions of exams from thousands of participating sites since its inception in 2011.20 Users receive regular feedback comparing their results with national and regional facilities of similar sizes and practice profiles. Within the US Veterans Health Administration (VA), the VA Radiation Dose Network was formed to connect RDIMs across VA facilities, culminating in the creation of the VA’s Radiation Exposure Monitoring (REM) Registry. The VA REM Registry provides dose index comparisons within a facility, across a Veterans Integrated Service Network, or across the entire REM Registry (Table 1), enabling facility users to identify outlier exams and protocols that do not conform to typical operating and performance levels across the organization.
To maximize participation, registries typically accommodate data connections from participants using a variety of RDIM software platforms. The simplest implementation is for participating sites to forward raw RDSR objects to another RDIM system operated as the registry. This has the advantage of compatibility, as no special protocols are needed for the systems to communicate. The disad- vantage is that any derived data produced by the site RDIM may not be stored in the registry. To capture derived data elements from site RDIM systems, registries must be configured to communicate with the site RDIM via protocols that may be proprietary to either or both of the connected systems.
Fluoroscopy Peak Skin Dose
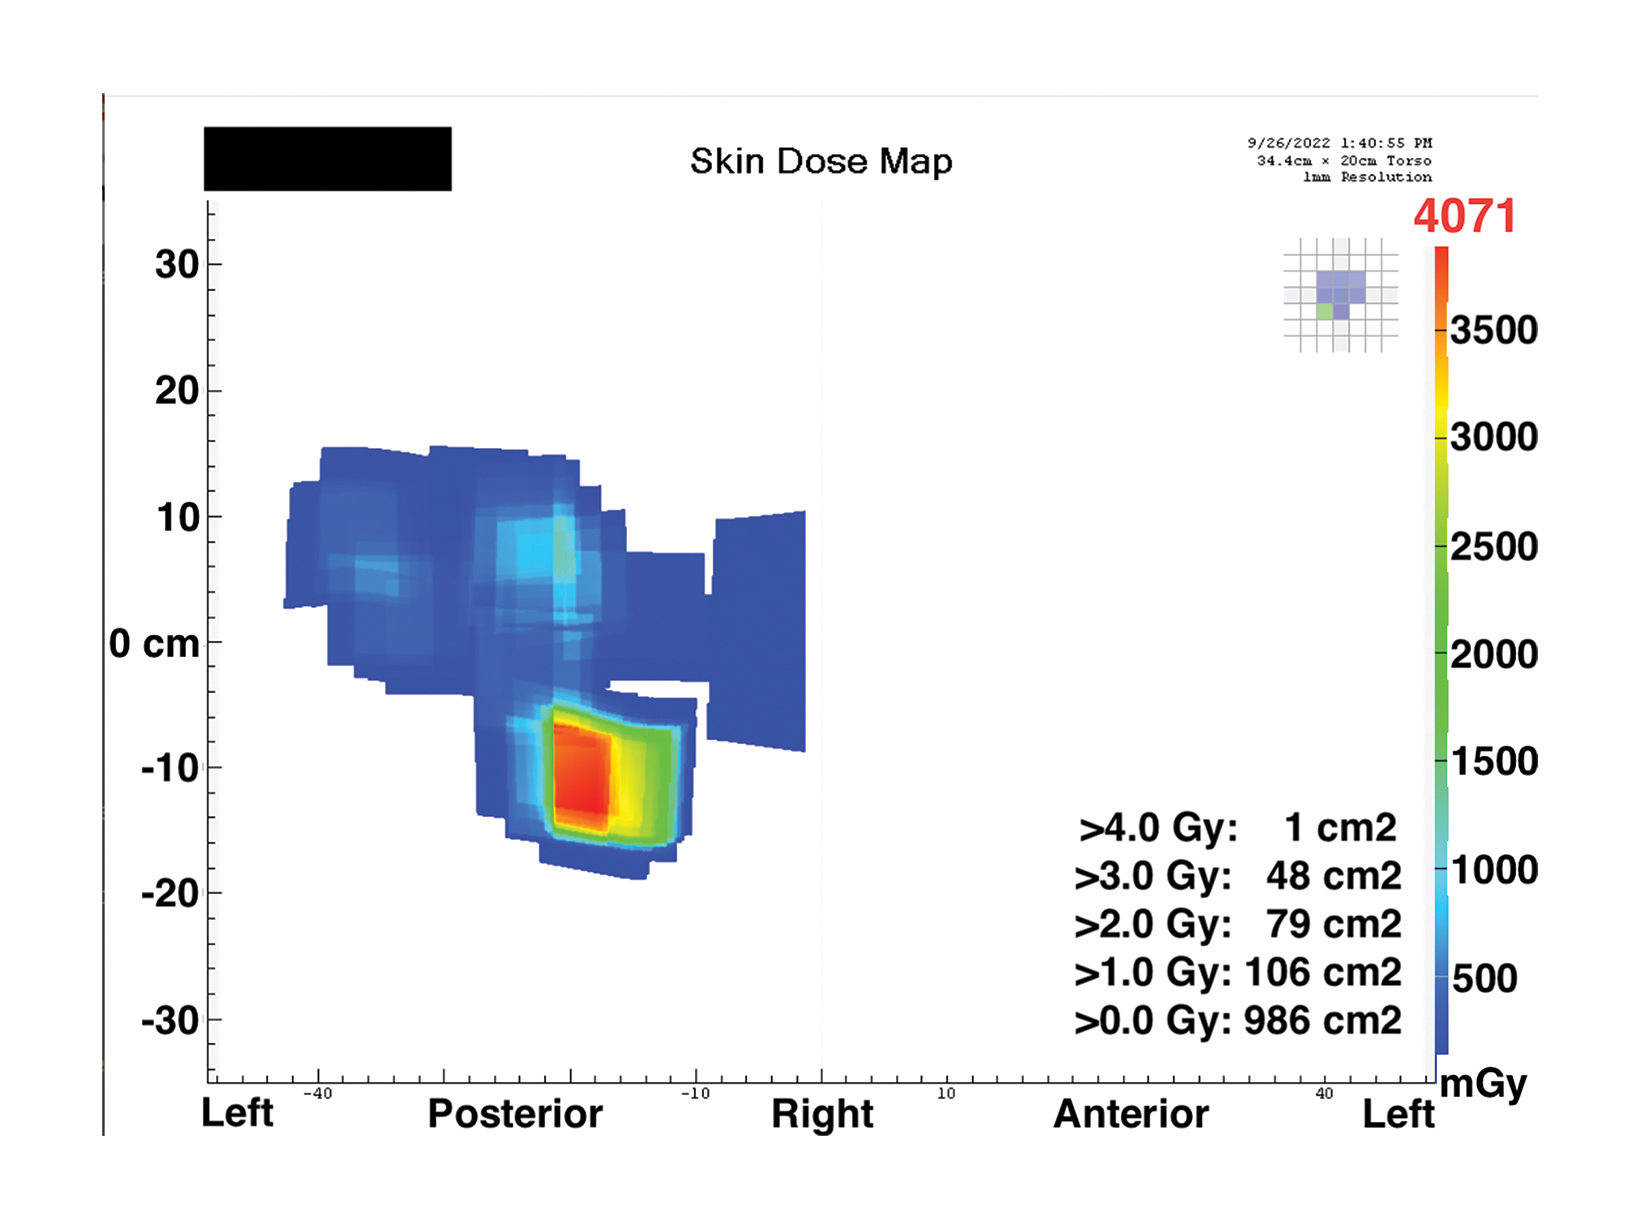
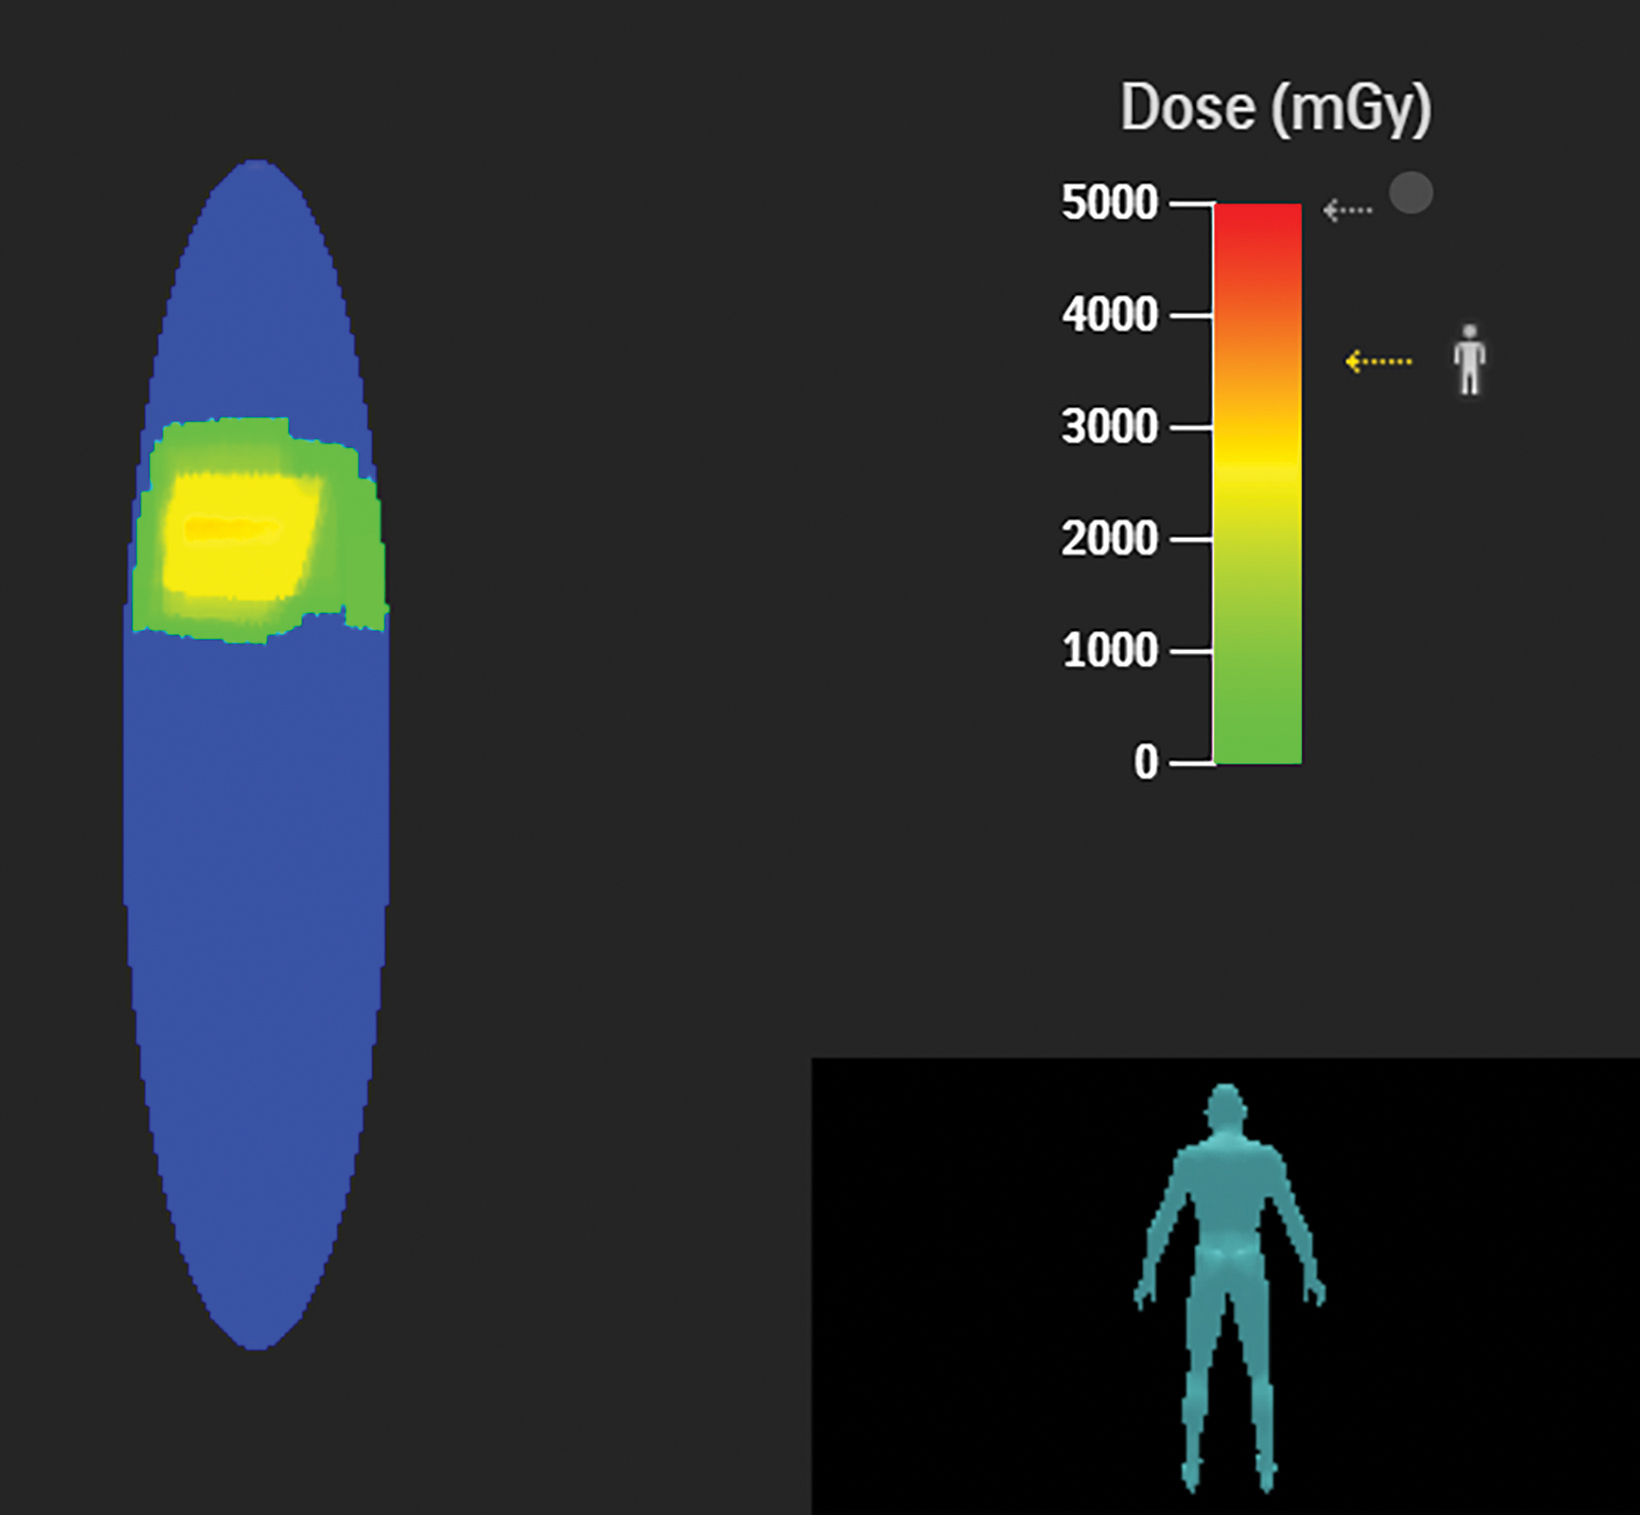
The PSD from a fluoroscopic procedure can be estimated using data collected by RDIM.21 These estimates can be refined using the data captured by RDIM describing X-ray tube and patient-table positioning, and some RDIM systems can construct sophisticated geometric mapping of estimated skin dose distributions.22 These calculated estimates and maps can be valuable in determining which patients are at risk for radiation-induced skin injury and recommending appropriate follow-up.
Patients whose exposure exceeds a Substantial Radiation Dose Level (SRDL) threshold (as defined by the facility) should receive additional post-procedure instructions and specific follow-up examinations depending on the magnitude of the suspected dose.23,24 As it is important to provide this information to patients before discharge, identification of SRDLs and calculation of PSD estimates must be completed fairly quickly after completion of the procedure, especially for outpatient procedures. An RDIM system could send an immediate alert to the medical physicist once the data for the SRDL procedure is received and processed, and the PSD estimate could be calculated automatically for rapid review and validation. Examples are shown in Figures 1 and 2.
RDIM can also assist interventional radiologists in assessing a patient’s recent skin doses and potential for increased sensitivity to radiation-induced injury during the next procedure. This is a setting where cumulative skin dose histories for individual patients are useful. When planning a procedure, the interventional radiologist could review the patient’s history in the RDIM system for any recent exposures, particularly fluoroscopy of the same area. Current guidance suggests that all exposures within a 60-day period be summed when estimating risk of skin injury; thus, a patient’s threshold for skin injury should be considered reduced by the skin dose received within the 60 days prior to the current procedure.24
CT Protocol Management
In addition to dose data, RDIM captures a number of other details about imaging procedures in the RDSR data object. These include details that can be used to examine adherence to the facility’s established imaging protocols and the use of correct and appropriate scanning protocols for a given exam. This capability can be used for ongoing monitoring of all procedures, as well as troubleshooting of specific situations.
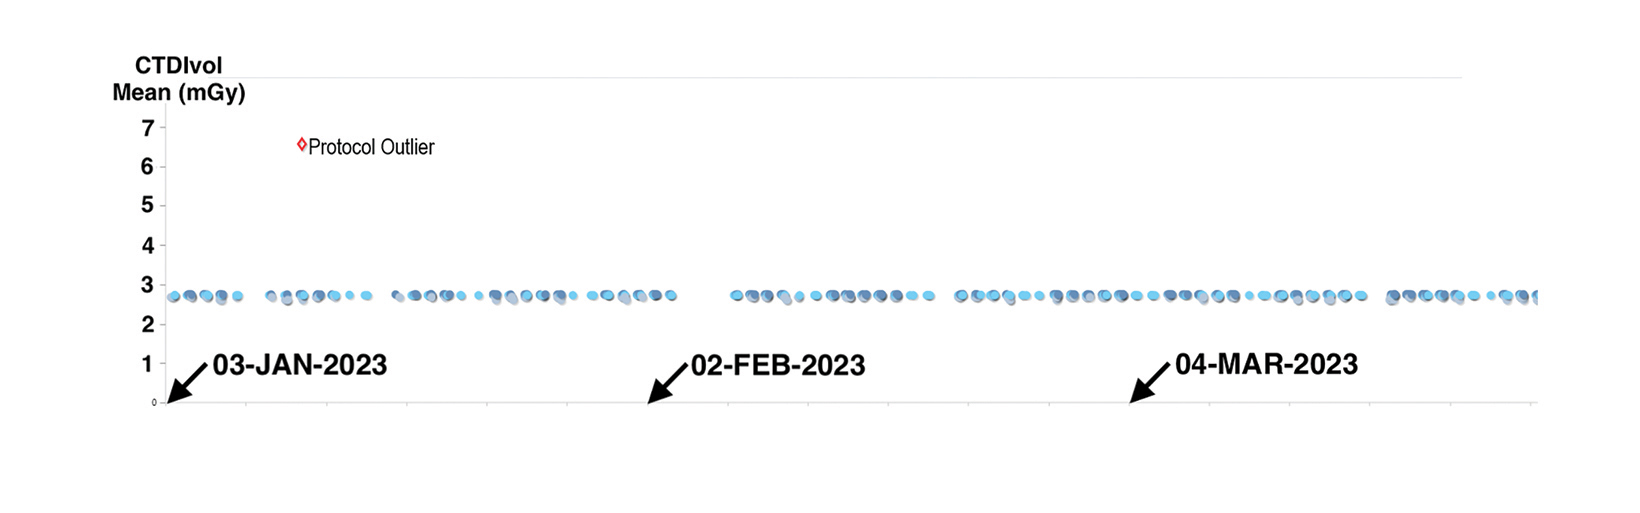
For example, the timeline plot in Figure 3 shows a substantial variation in dose index for one low-dose CT lung cancer screening scan of the thorax. This discrepancy was noted when reviewing RDIM data for screening exams, as indicated by the exam description. Upon investigating, the facility’s medical physics personnel found that the CT technologists occasionally selected the routine diagnostic thorax CT protocol rather than the specific protocol created for lung cancer screening. The medical physics team was able to identify the problem and complete the investigation in a matter of minutes, without leaving their desks.
Other Applications
RDIM can be a valuable tool for a radiation safety officer overseeing clinical research when determining the facility’s typical patient effective doses for specific exams. While RDIM-calculated effective dose estimates are neither accurate6 nor meaningful25 for individual patient radiation risk estimates, the aggregated estimates for a patient population can inform the risk assessment for research trials in a similar population. This information can be used to guide investigators and institutional review boards concerned with radiation risk to subjects, and is often needed for informed consent documents as well. In any event, for many procedures, typical dose values are difficult to find in the literature and may not be applicable to the facility’s technology.
Automated data collection, once established for RDIM, may provide infrastructure for other business intelligence or analytics applications that are not directly related to radiation exposure but can benefit from automated large-scale collection of structured data. Examples include equipment uptime, room turnover time, and other asset and staff utilization information that can be directly extracted from RDSR data or inferred from information found there.
Quality Indicators
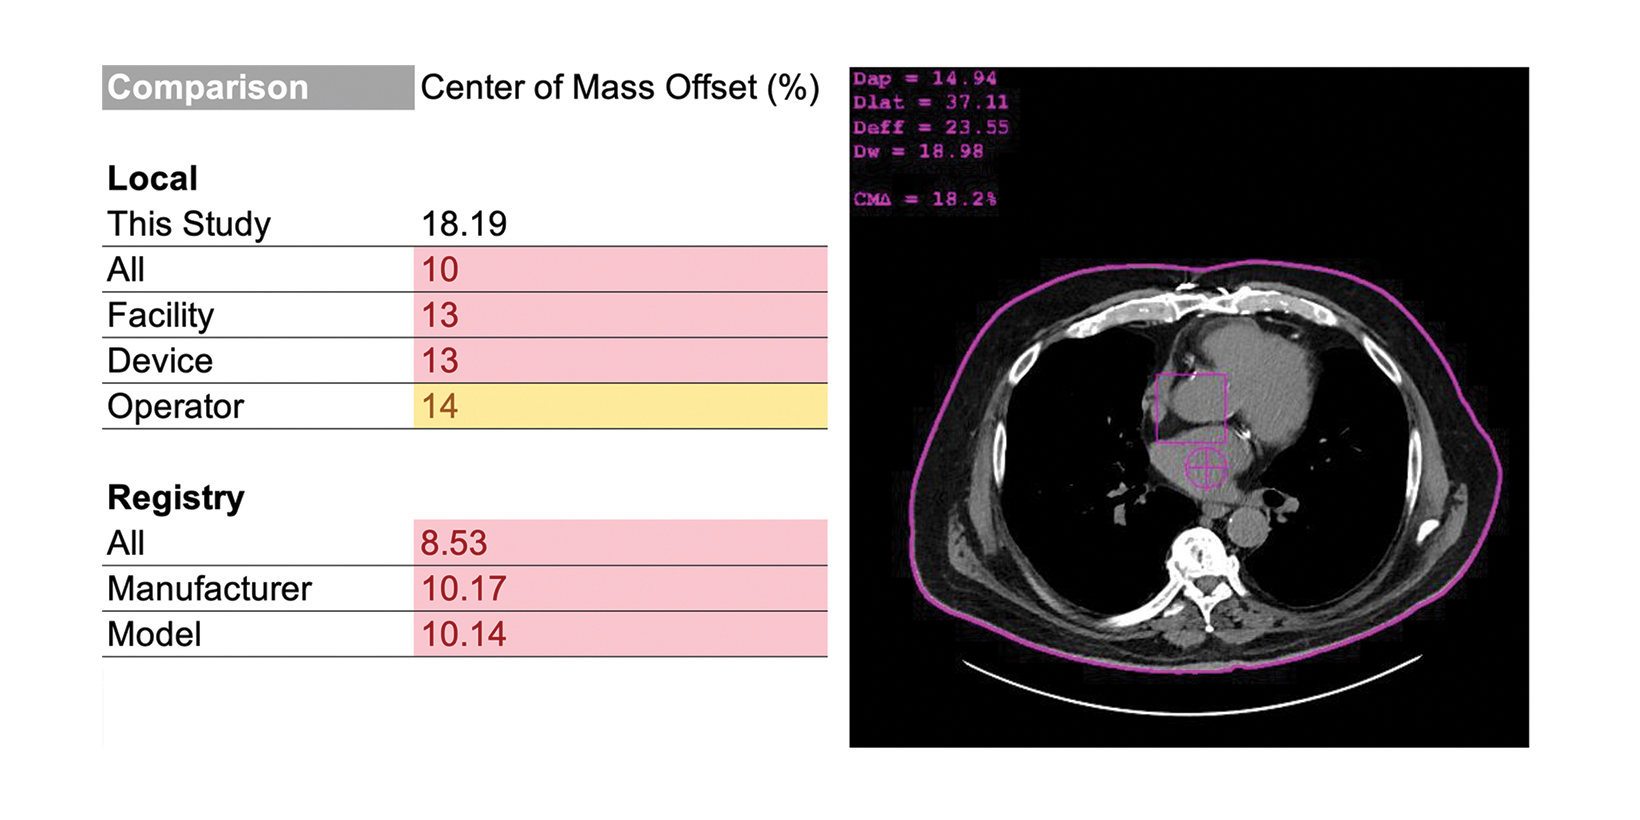
Radiologists should consider RDIM that includes assessments of image or exam quality. In CT, a common, and correctable, quality issue is improper vertical centering of patients.26–30 In the example in Figure 4, the RDIM system uses patient images to calculate the offset between the rotational center of the CT scanner and the center of mass of the patient; the result is labeled the “center of mass offset” and cited as a percentage. This calculation requires the CT images and RDSR to be sent to RDIM, but the results are stored in the database for review, trending, and even comparison with other sites. This example demonstrates an opportunity for quality improvement.
In digital radiography, RDIM can be used to monitor the Deviation Index, assuming the equipment is configured with appropriate Target Exposure Index values for each exam and view, and that the system is configured to include Deviation Index in the RDSR files.31
RDIM: Used with Care, Powerful Tools
These use cases represent only a sampling of the many applications to which medical imaging personnel can put the power of radiation dose index monitoring software tools to use. Leveraging the ability of RDIM to collect and store vast amounts of digital data from sources as small as a single imaging device to as large as an entire enterprise, medical physics personnel can quickly and efficiently analyze the performance of their institution’s imaging technology in a variety of circumstances and patient populations. However, RDIM systems are complex platforms, and radiologists should take care to engage expert medical physics and informatics support to ensure the quality of their data, the reliability of their system, and the accuracy of their results.
References
- Vano E, Fernández JM, Ten JI, Sanchez RM. Benefits and limitations for the use of radiation dose management systems in medical imaging. Practical experience in a university hospital. Br J Radiol. 2022;95(1133):20211340. doi:10.1259/bjr.20211340
- AAPM. AAPM/ACR/HPS Joint Statement on Proper Use of Radiation Dose Metric Tracking for Patients Undergoing Medical Imaging Exams. AAPM Position Statement 1-A. Published August 6, 2021. Accessed May 24, 2023. https://www.aapm.org/org/policies/details.asp?id=2545¤t=true
- Durand DJ. A rational approach to the clinical use of cumulative effective dose estimates. Am J Roentgenol. 2011;197(1):160-162. doi:10.2214/AJR.10.6195
- Durand DJ, Dixon RL, Morin RL. Utilization strategies for cumulative dose estimates: a review and rational assessment. J Am Coll Radiol. 2012;9(7):480-485. doi:10.1016/j. jacr.2012.03.003
- Walsh C, Murphy D. Should the justification of medical exposures take account of radiation risks from previous examinations? Br J Radiol. 2014;87(1037):20130682. doi:10.1259/bjr.20130682
- Gress DA, Dickinson RL, Erwin WD, et al. AAPM medical physics practice guideline 6.a.: Performance characteristics of radiation dose index monitoring systems. J Appl Clin Med Phys. 2017;18(4):12-22. doi:10.1002/acm2.12089
- Smith TB, Abadi E, Sauer TJ, Fu W, Solomon J, Samei E. Development and validation of an automated methodology to assess perceptual in vivo noise texture in liver CT. J Med Imaging. 2021;8(05). doi:10.1117/1.JMI.8.5.052113
- Alsaihati N, Ria F, Solomon J, Ding A, Frush D, Samei E. Making CT dose monitoring meaningful: augmenting dose with imaging quality. Tomography. 2023;9(2):798-809. doi:10.3390/tomography9020065
- American College of Radiology. ACR Appropriateness Criteria. Published online 2023. Accessed May 19, 2023. https://www.acr.org/Clinical-Resources/ACR-Appropri- ateness-Criteria
- Ria F, D’Ercole L, Origgi D, et al. Statement of the Italian Association of Medical Physics (AIFM) task group on radiation dose monitoring systems. Insights Imaging. 2022;13(1):23. doi:10.1186/s13244-022-01155-1
- Vano E, Frija G, Loose R, et al. Dosimetric quantities and effective dose in medical imaging: a summary for medical doctors. Insights Imaging. 2021;12(1):99. doi:10.1186/ s13244-021-01041-2
- Leuenberger R, Kocak R, Jordan DW, George T. Medical physics: quality and safety in the cloud. Health Phys. 2018;115(4):512-522. doi:10.1097/HP.0000000000000894
- Boone JM, Strauss KJ, Cody DD, McCollough CH, McNitt-Gray MF, Toth T. Size-specific dose estimates (SSDE) in pediatric and adult body CT examinations. American Association of Physicists in Medicine; 2011. Accessed May 24, 2023. https://www.aapm.org/pubs/reports/rpt_204.pdf
- Kanal KM, Butler PF, Sengupta D, Bhargavan-Chatfield M, Coombs LP, Morin RL. U.S. diagnostic reference levels and achievable doses for 10 adult CT examinations. Radiology. 2017;284(1):120-133. doi:10.1148/radiol.2017161911
- American College of Radiology. Radiation Dosimetry: CT (Revised 11-9-2022). Accreditation Support. Published 2022. Accessed May 20, 2023. https://accreditationsupport.acr.org/support/solutions/articles/11000056198-radiation-dosimetry-ct-revised-11-9-2022-
- Bohl MA, Goswami R, Strassner B, Stanger P. Meeting the Joint Commission’s dose incident identification and external benchmarking requirements using the ACR’s Dose Index Registry. J Am Coll Radiol. 2016;13(8):936-942. doi:10.1016/j.jacr.2016.04.026
- American College of Radiology. ACR–AAPM–SPR practice parameter for diagnostic reference levels and achievable doses in medical X-ray imaging. Published online 2018. Accessed May 20, 2023. https://www.acr.org/-/media/ACR/Files/Practice-Parameters/diag-ref-levels.pdf
- NCRP. Reference levels and achievable doses in medical and dental imaging: recommendations for the United States. NCRP Report 172. National Council on Radiation Protection and Measurement; 2012.
- ICRP. Diagnostic reference levels in medical imaging. ICRP Publication 135. Ann ICRP. 2017;46(1). https://journals.sagepub.com/doi/pdf/10.1177/ANIB_46_1
- Bhargavan-Chatfield M, Morin RL. The ACR computed tomography Dose Index Registry: the 5 million examination update. J Am Coll Radiol. 2013;10(12):980-983. doi:10.1016/j.jacr.2013.08.030
- Jones AK, Pasciak AS. Calculating the peak skin dose resulting from fluoroscopically guided interventions. Part I: Methods. J Appl Clin Med Phys. 2011;12(4):231-244. doi:10.1120/jacmp.v12i4.3670
- Colombo PE, Rottoli F, Felisi M, et al. Validation of a dose tracking software for skin dose map calculation in interventional radiology. Phys Med. 2020;72:122-132. doi:10.1016/j.ejmp.2020.03.008
- NCRP. Radiation dose management for fluoroscopically guided interventional medical procedures. NCRP Report 168. National Council on Radiation Protection and Measurement; 2012.
- Fisher RF, Applegate KE, Berkowitz LK, et al. AAPM Medical Physics Practice Guideline 12.a: Fluoroscopy dose management. J Appl Clin Med Phys. 2022;23(3). doi:10.1002/acm2.13526
- AAPM. Position Statement on Radiation Risks from Medical Imaging Procedures. Position Statement 4-A. Published April 10, 2018. Accessed May 24, 2023. https://www. aapm.org/org/policies/details.asp?id=2548¤t=true
- Toth T, Ge Z, Daly MP. The influence of patient centering on CT dose and image noise: How patient centering affects CT dose and noise. Med Phys. 2007;34(7):3093-3101. doi:10.1118/1.2748113
- Habibzadeh MA, Ay MR, Asl ARK, Ghadiri H, Zaidi H. Impact of miscentering on patient dose and image noise in x-ray CT imaging: phantom and clinical studies. Phys Med. 2012;28(3):191-199. doi:10.1016/j.ejmp.2011.06.002
- Kaasalainen T, Palmu K, Reijonen V, Kortesniemi M. Effect of patient centering on patient dose and image noise in chest CT. Am J Roentgenol. 2014;203(1):123-130. doi:10.2214/AJR.13.12028
- Al-Hayek Y, Zheng X, Hayre C, Spuur K. The influence of patient positioning on radiation dose in CT imaging: A narrative review. J Med Imaging Radiat Sci. 2022;53(4):737-747. doi:10.1016/j.jmir.2022.09.027
- DeWeese L, Griglock T, Moody A, Mehlberg A, Winters C. The improvement of patient centering in computed tomography through a technologist-focused education initiative. J Digit Imaging. 2022;35(2):327-334. doi:10.1007/s10278-021-00580-w
- Shepard SJ, Wang J, Flynn M, et al. An exposure indicator for digital radiography: AAPM Task Group 116 (executive summary). Med Phys. 2009;36(7):2898-2914. doi:10.1118/1.3121505